
A Comprehensive Guide to APM Dashboard
Scope:
The Application Portfolio Management solution helps enterprises build a holistic view of business applications in an enterprise landscape for better application rationalization. APM Dashboards play a pivotal role in managing the application landscape efficiently. This article is aimed at users with an in-depth understanding of Reports & Charts used in APM Dashboards – what they are and how to define them manually.
New Feature Update:
- In Prolaborate 5.1, we are introducing the capability for users to export and import dashboards across instances
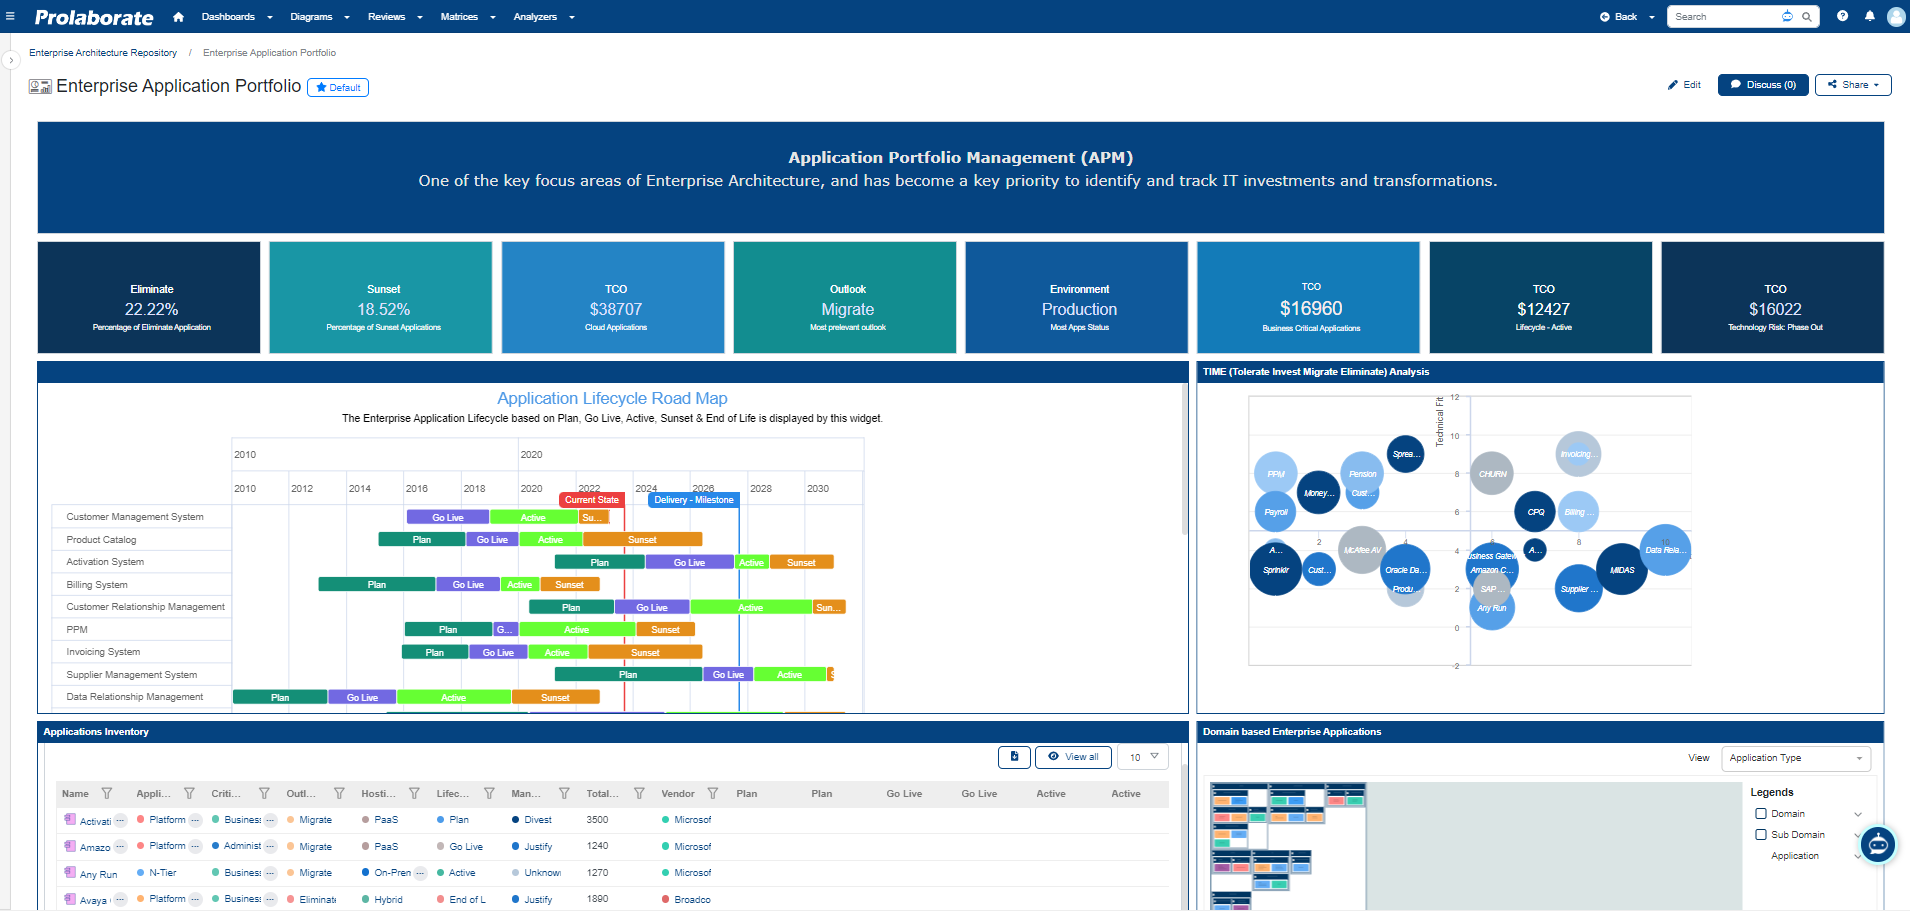


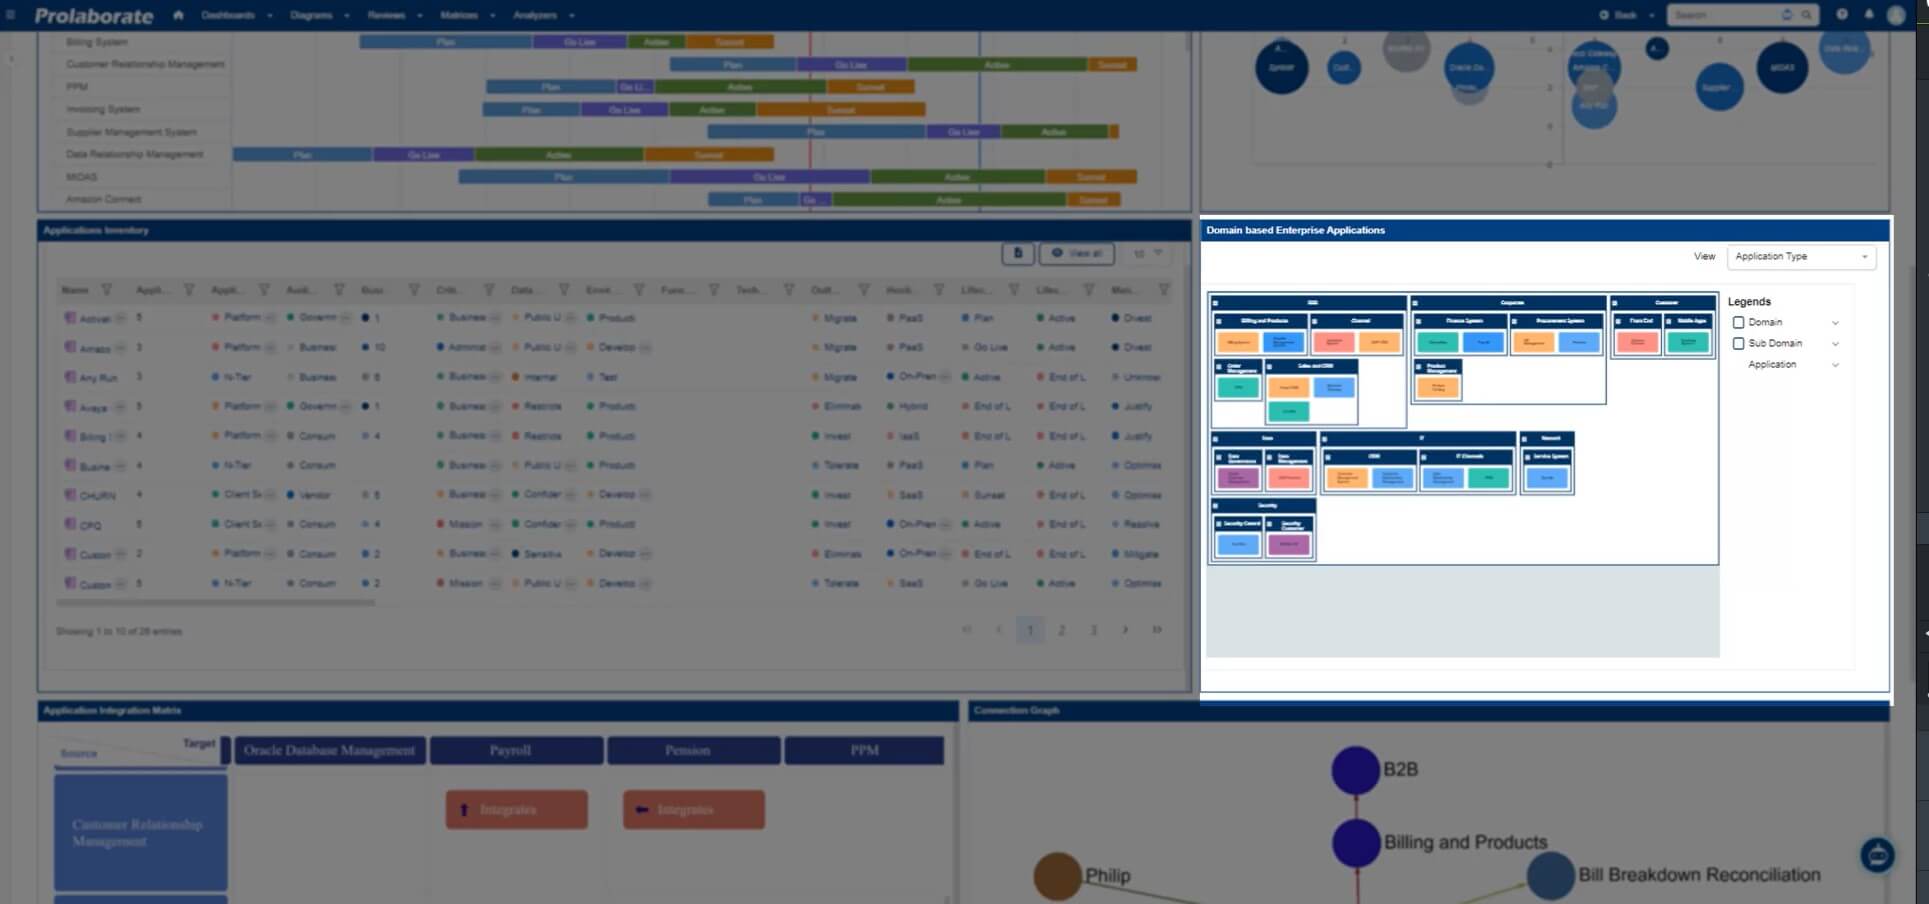
The Prolaborate APM dashboard includes over 12+ reports measuring various metrics and insights. In this article, we will explore how users can manually define these reports on their dashboard.
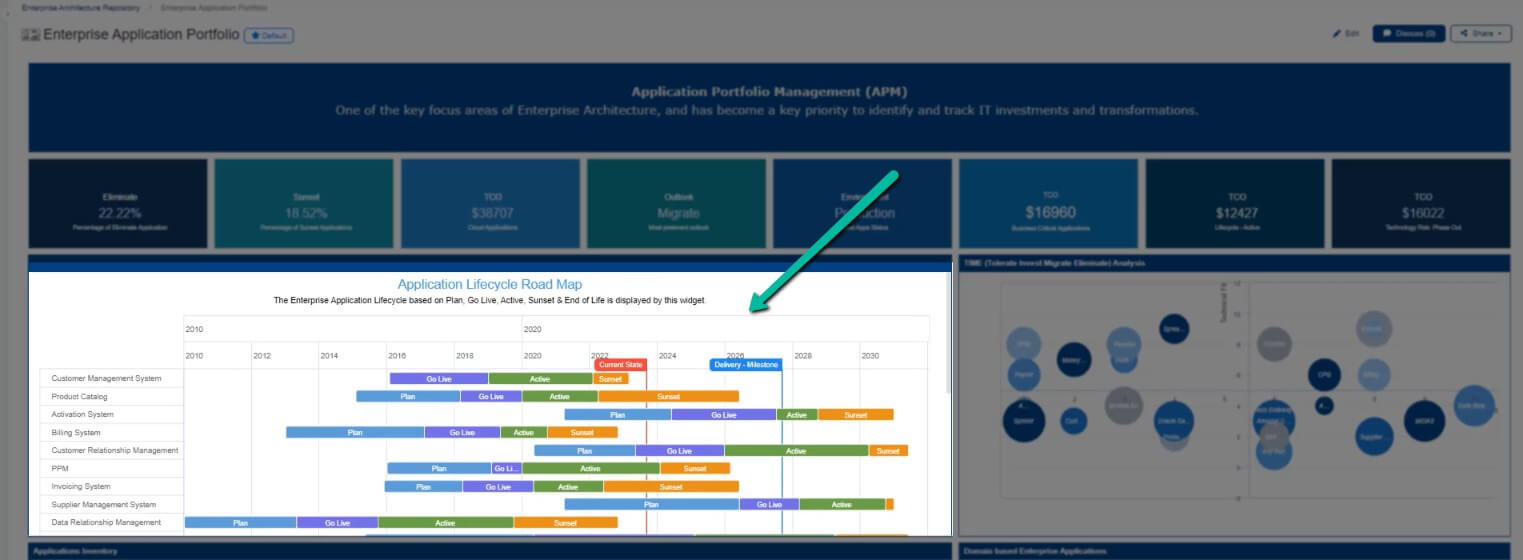
KPI Reports using Cards Widget
APM Based Report 1: Know the percentage of applications which must be eliminated
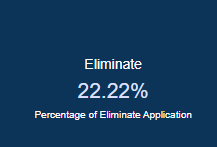
To learn how to create this chart, Click here
APM Based Report 2: Know the percentage of applications which are at phase out state
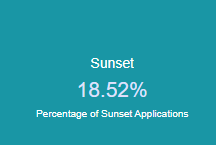
To learn how to create this chart, Click here
APM Based Report 3: Know the total cost of investments on Cloud Applications
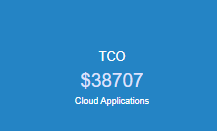
To learn how to create this chart, Click here
APM Based Report 4: Know the most prevalent outlook of applications
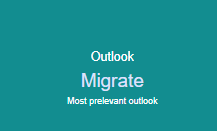
To learn how to create this chart, Click here
APM Based Report 5: Know the most prevalent Application Status
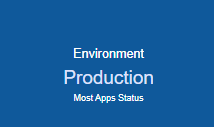
To learn how to create this chart, Click here
APM Based Report 6: Know about the Total cost of ownership for Business-Critical Applications
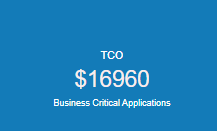
To learn how to create this chart, Click here
APM Based Report 7: Know the Total cost of ownership for Active Application
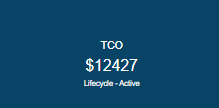
To learn how to create this chart, Click here
APM Based Report 8: Know Total cost of ownership for Phase out Applications
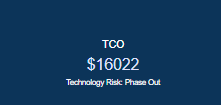
To learn how to create this chart, Click here
KPI Reports using Charts and Reports
APM Based Report 9: Application Lifecycle Road map
To learn how to create this chart, Click here
APM Based Report 10: Build a TIME (Tolerate, Invest, Migrate, Eliminate) Analysis chart for Applications
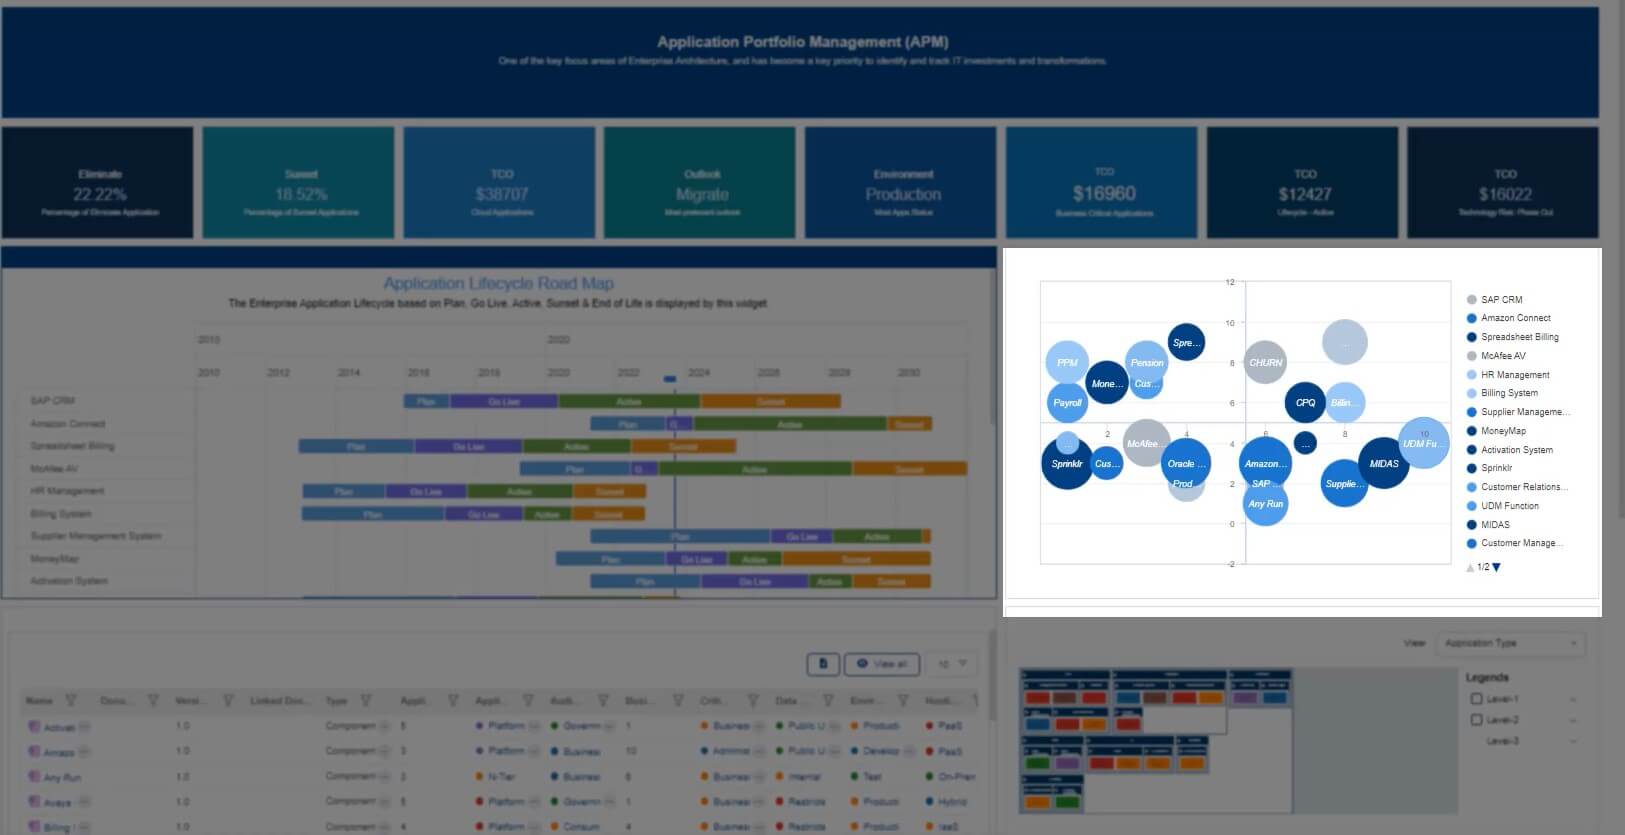
To learn how to create this chart, Click here
APM Based Report 11: Applications Inventory Report
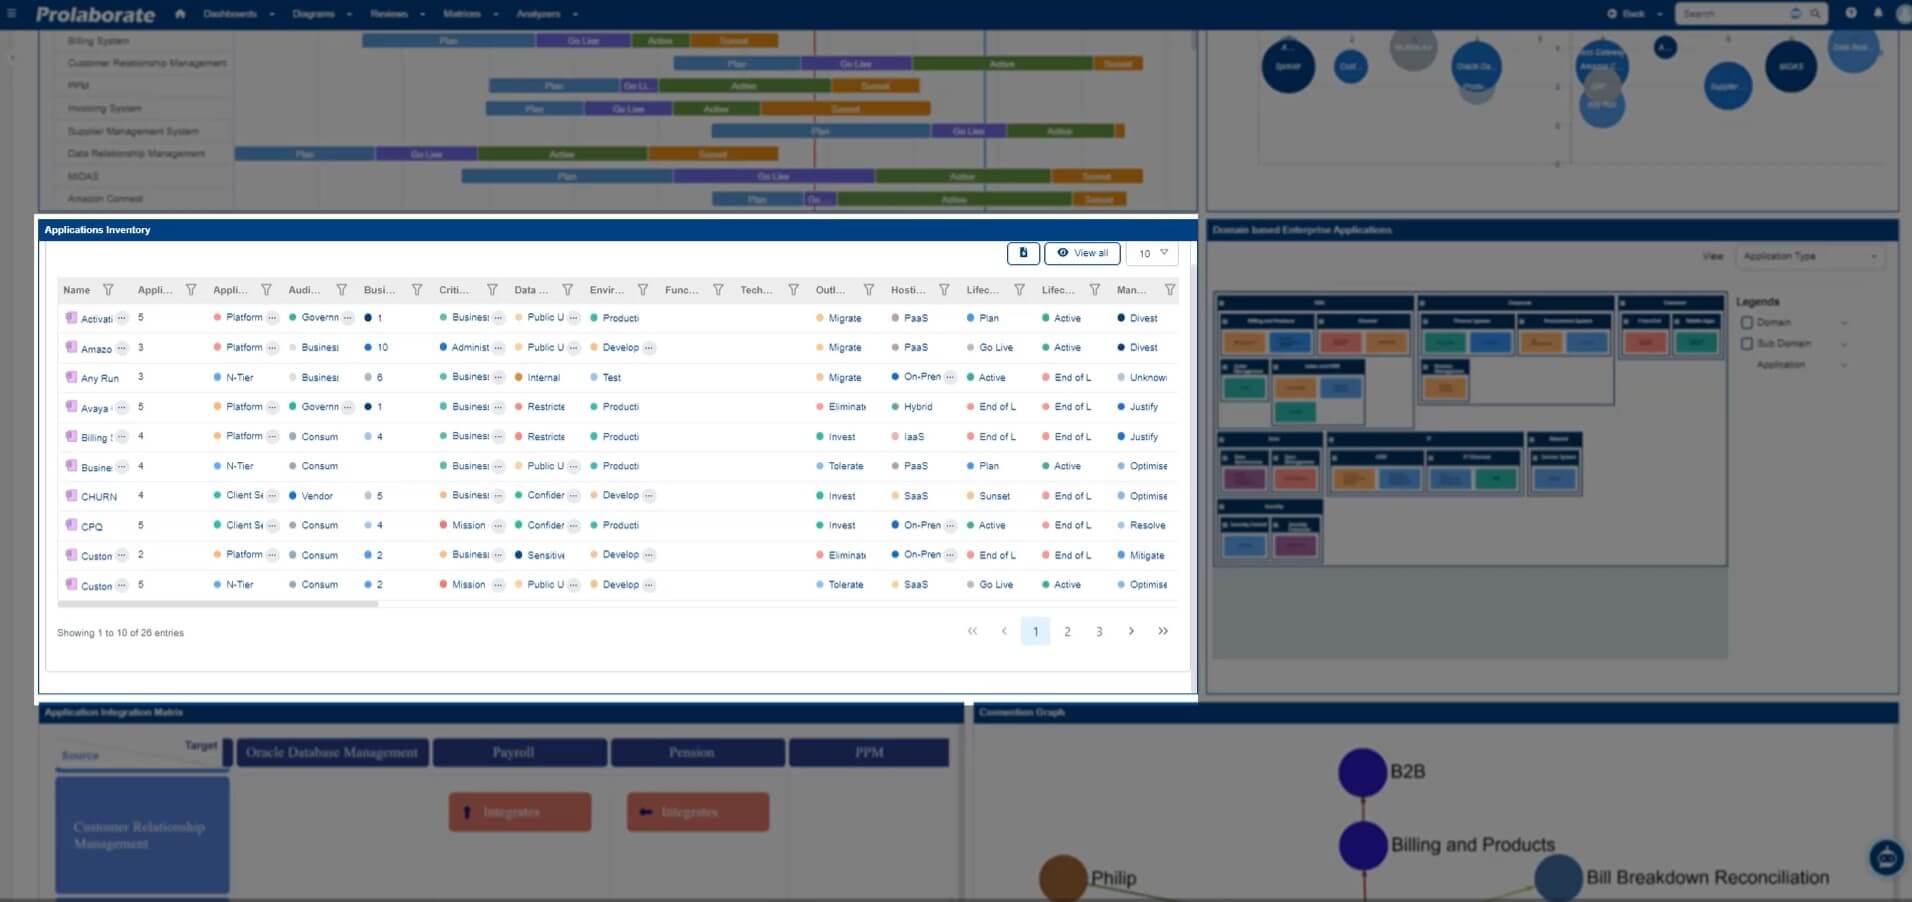
To learn how to create this chart, Click here
APM Based Report 12: Holistic View of Enterprise Applications classified based on Domains
To learn how to create this chart, Click here
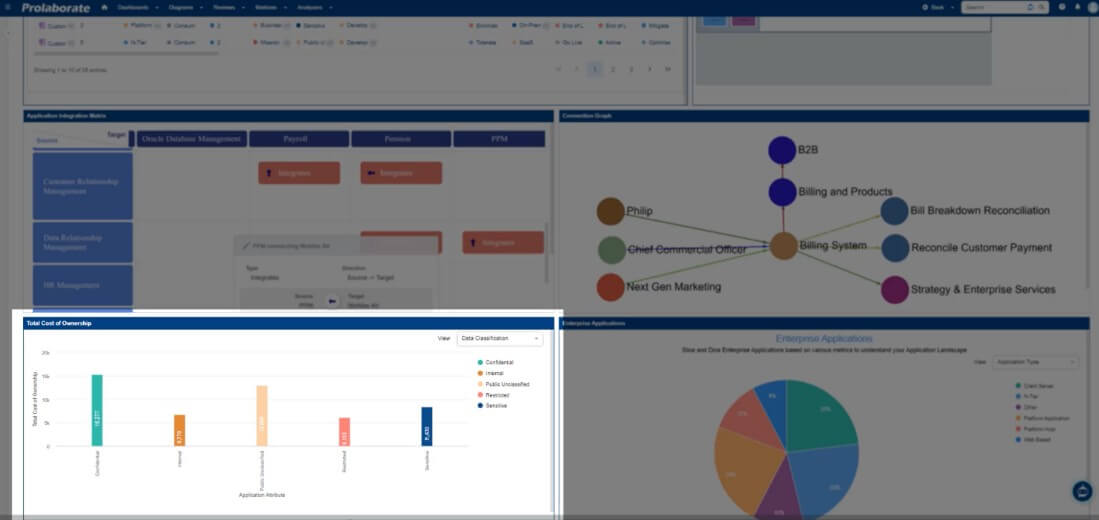
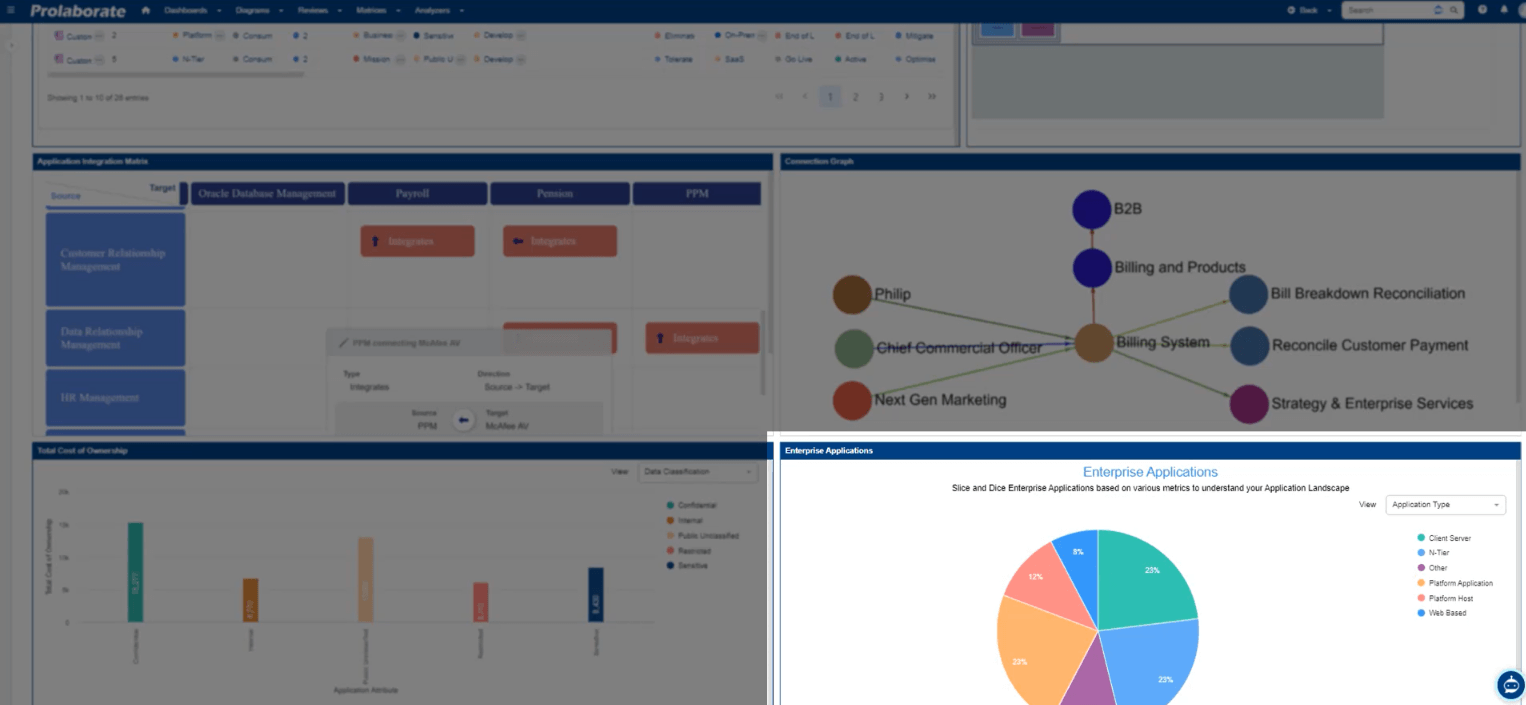
APM Based Report 13: Total Cost of Applications Ownership based on different attributes of an application
To learn how to create this chart, Click here
APM Based Report 14: Segment Enterprise Applications based on various metrics
To learn how to create this chart, Click here
KPI Reports using Matrix and Analyzer
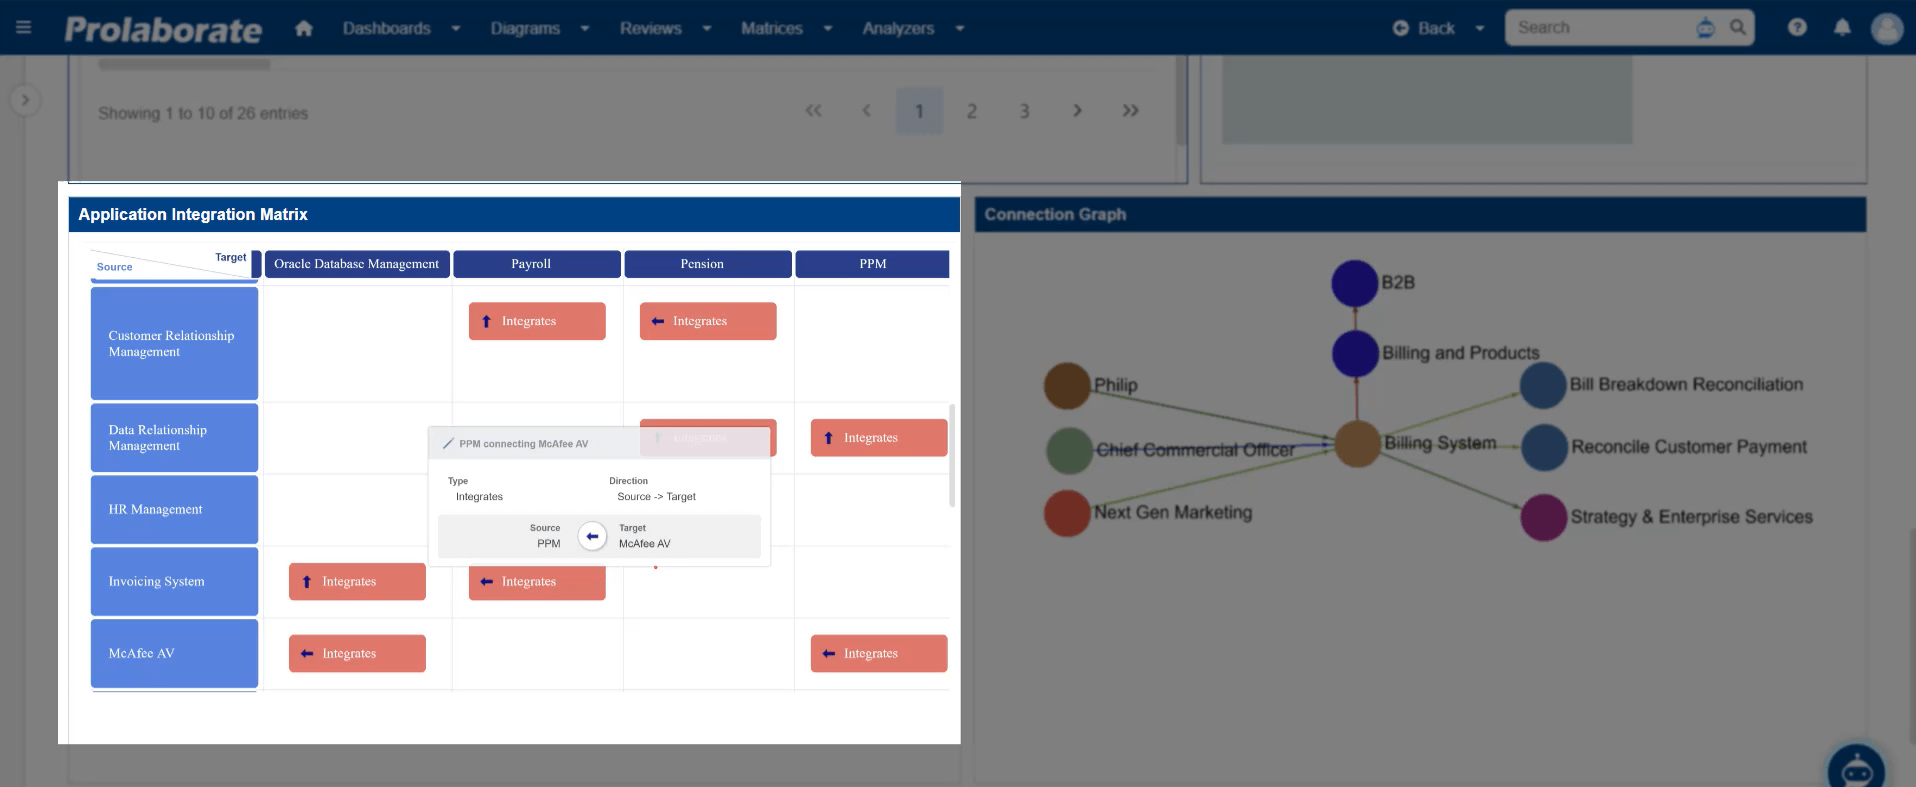
APM Based Report 15: Visualize Matrix Reports
To learn how to create this chart, Click here
APM Based Report 16: Impact of a specific application in an enterprise ecosystem
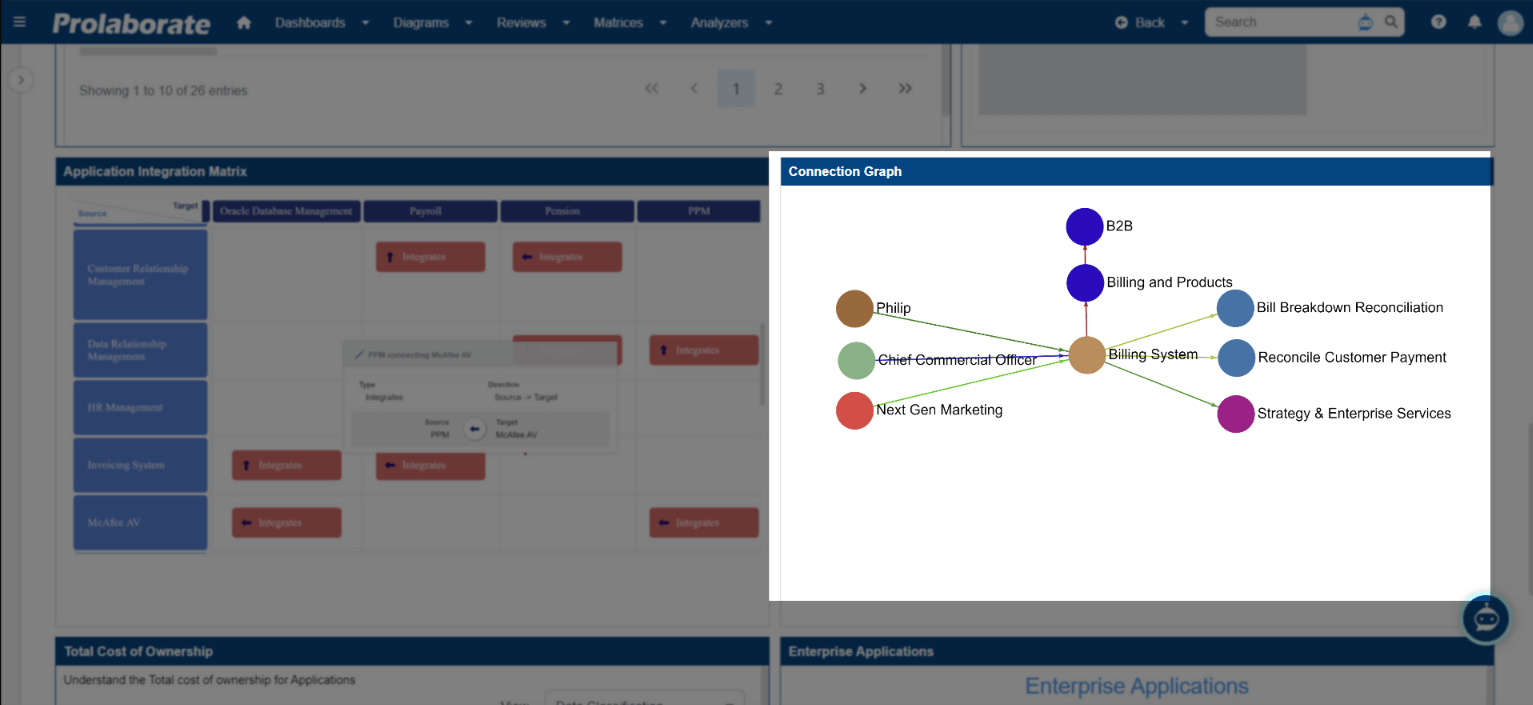
To learn how to create this chart, Click here