
Cards
Overview
Prolaborate now features a cards view for reports which gives you a quick and easy overview of your project data. It presents information in a concise and visually appealing format which helps you quickly understand the key information and explore more details if required.
Users always prefer curated and succinct insights from complex architecture information, to focus on important aspects of the business.
- cards Widget allows architects to highlight business information and key metrics from model in your dashboard designed to highlight vital metrics like cost, numbers, counts and text. The cards Widget allows for concise and visually appealing presentation of key information.
- Our business users highly appreciate this widget for providing valuable insights into crucial aspects, including Total Cost Of (TCO) applications, applications count based on key attributes, percentage of high-impact applications and much more.
Different formats of cards report
Cards can be configured to display different output result using designer or query
| cards Types | Configuration Technique: Designer | Configuration Technique: SQL Query |
|---|---|---|
Count Click here to design a cards like this |
Yes (click here to see) | Yes (click here to see) |
Sum Click here to design a cards like this |
Yes (click here to see) | Yes (click here to see) |
Percentage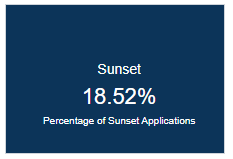 Click here to design a cards like this |
Not Applicable | Yes (click here to see) |
Text Click here to design a cards like this |
Not Applicable | Yes (click here to see) |
Note:
- When multiple stereotypes are listed under the selected package, the columns displayed will be based on the general properties applied. Use the stereotype dropdown to filter the list and display the columns based on the form designer configured for the selected stereotype.
Each cards report displays the following
- Title: Each cards has a title that tells you what the report is about. It helps you identify the content at a glance. Title is positioned at the top of cards widget.
- Key Metrics: The cards highlights key metrics or performance indicators related to the report. These are presented in a clear and concise format, so you can quickly understand the most important aspects of the report. It is positioned in the middle of the cards widget.
- Description: It elaborates on what the report shows. It is positioned at the bottom of the cards widget.
Prerequisites
- Prolaborate version should be 5.0 and above.
- Users must have access to the EA repository in Prolaborate.
- User must be part of a user group to which the access to dashboard is given to that user group by the admin.
Steps to add a new cards Widget
To add a cards widget in a dashboard, follow the below steps
Step 1: Create a Dashboard
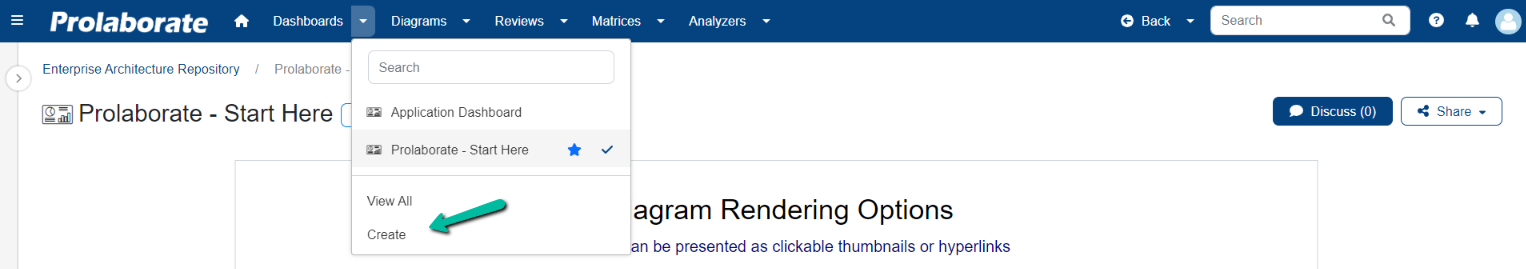
The first step is to create a dashboard which incorporates the cardss as a widget. A new dashboard can be created by choosing Create from the dropdown in the header menu.


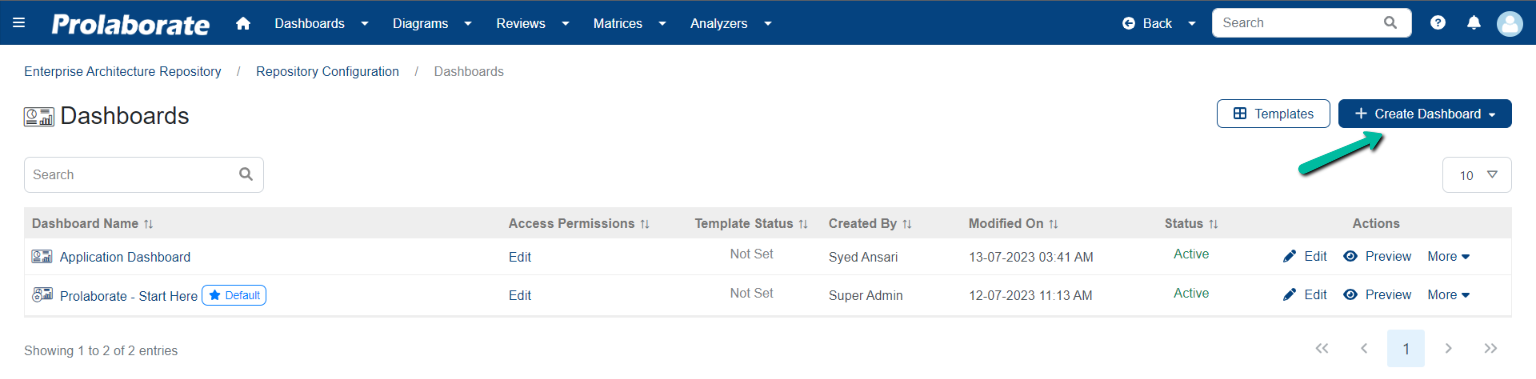
Users can also choose View all to navigate to the dashboard landing page and choose Create Dashboard.
Step 2: Add New Widget
To add a widget, click Add Widget Button > Add New by any one of the options given below.
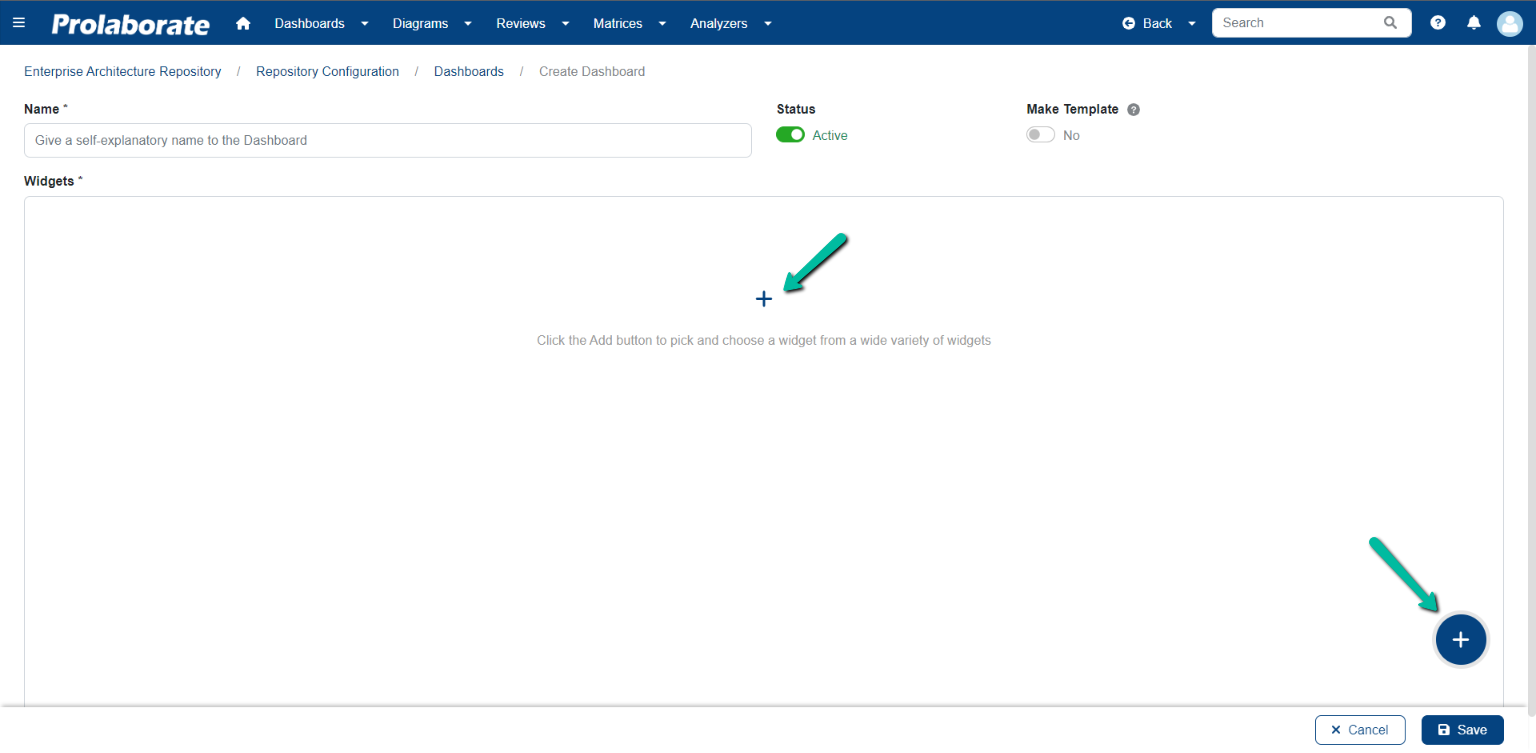
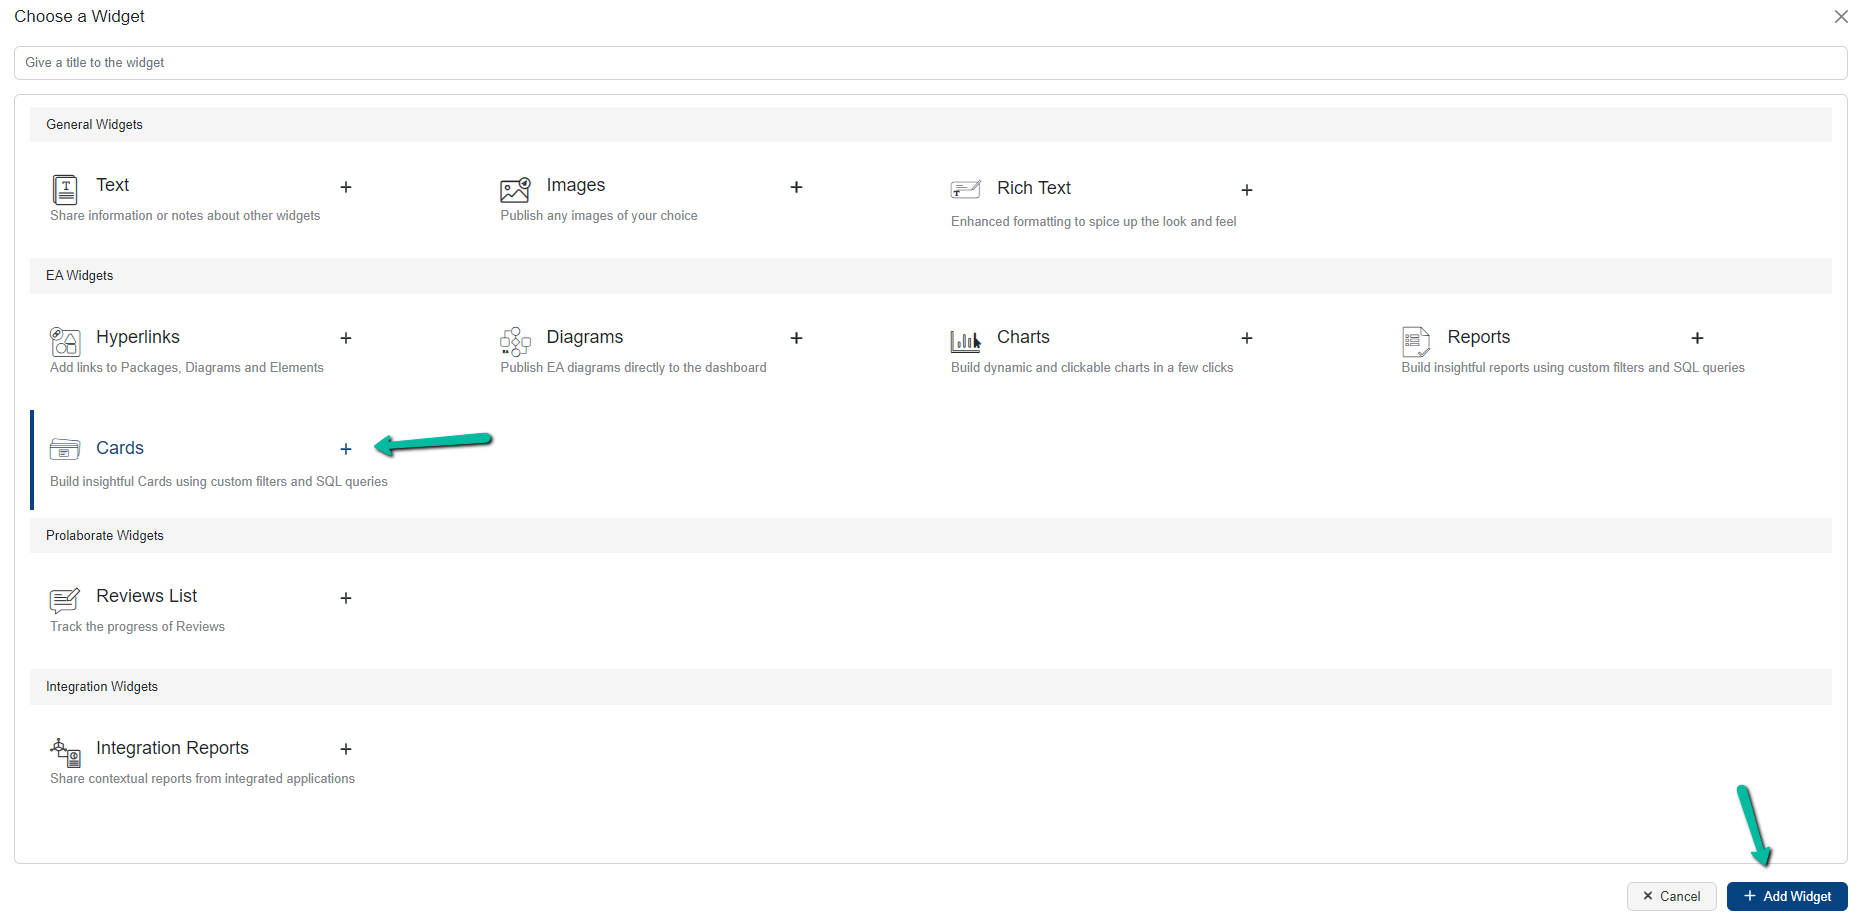
In Choose a Widget page, choose Cards under EA widgets and click Add Widget.
You can configure the cards widget using Designer or SQL Query for the desired output using the following examples.
Count Based Report – E.g. Useful for calculating No. Of. Artifacts
The count based can help us answer No. Of Applications present in the Architectural Repository. We can apply filters to answer a very narrow question such as the count of No. Of Business Applications.
This can be achieved by using both Designer and SQL Query. Let us see an example on how to display the application count on a cards report.
Count Based Report – Designer Configuration
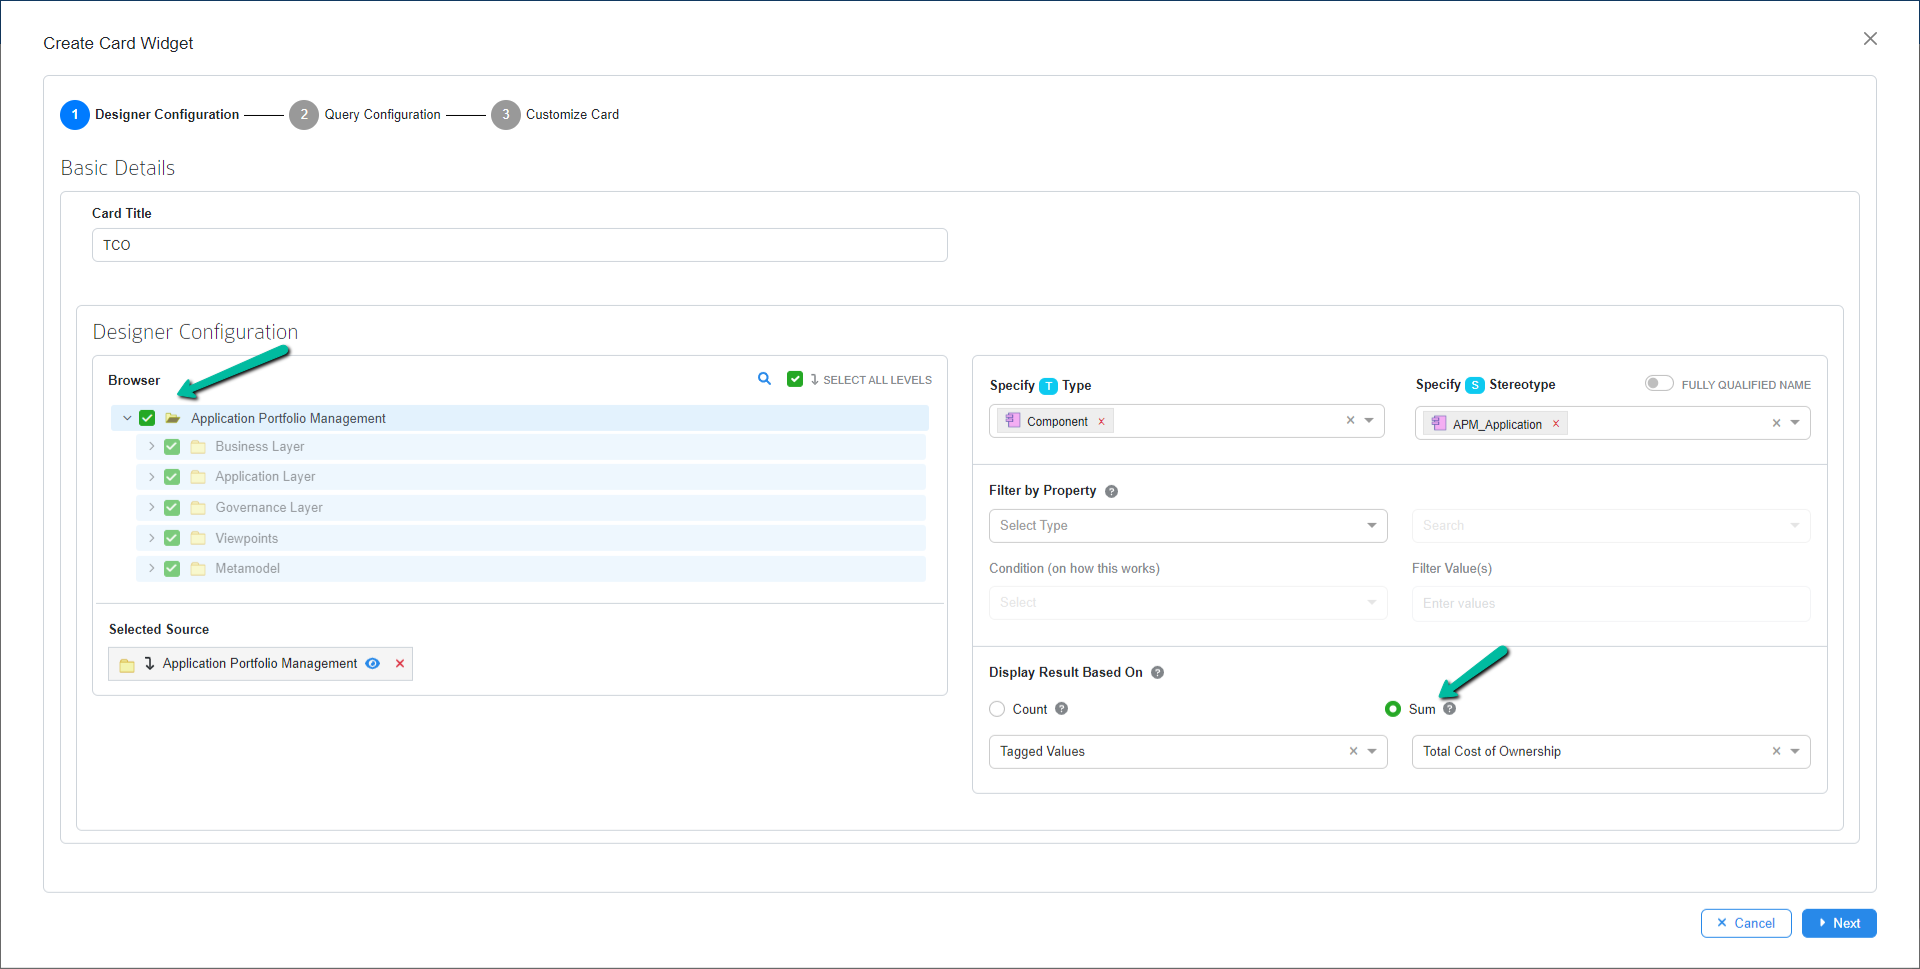
In the designer configuration page, configure the options. Below table explains things you need to know in a designer configuration page.
| Options | Description |
|---|---|
| Browser | It displays the list of packages that the user has access to in the repository. |
| Search Repository | It facilitates the search for packages and elements. Clicking on the Search icon opens the repository search page, where users can search for elements by name or alias. Users can also select object type, type, and stereotype from the dropdown menu to further filter the search. |
| Select All Levels | When the Select All Levels option is enabled, it automatically selects sub-packages and elements within a chosen package. |
| Specify Type | Choose the desired object types from the dropdown list within the package. |
| Specify Stereotype | Select the desired stereotypes from the dropdown list. |
| Fully Qualified Name | Enabling this option displays the complete name of the stereotype by combining the technology name and stereotype name. If disabled, only the stereotype name will be visible in the dropdown. |
| Filter By Property | Users can filter elements based on basic properties such as name, stereotype, status, notes, etc., as well as tagged values.Condition (on how this works):User can filter based on the conditions like IN, NOT IN from the tagged value and Basic Properties.Filter values: Based on the above Tagged value or Basic Property, user can filter in detail by using the values from the Tagged value or basic property. |
| Display Result Based On | Choose Count to display the number of elements with respect to the filters applied in the above configurations. |
Note:
- Source selection and display result fields are mandatory. Other fields are optional and can be applied if required, by referring to the above table.
This example shows the count of applications in the repository. Source packages are selected, and filters for type (Component) and stereotype (APM_Application) are applied to narrow the result. Count is selected in the Display Result Based On option, displaying the total number of business applications in the repository.
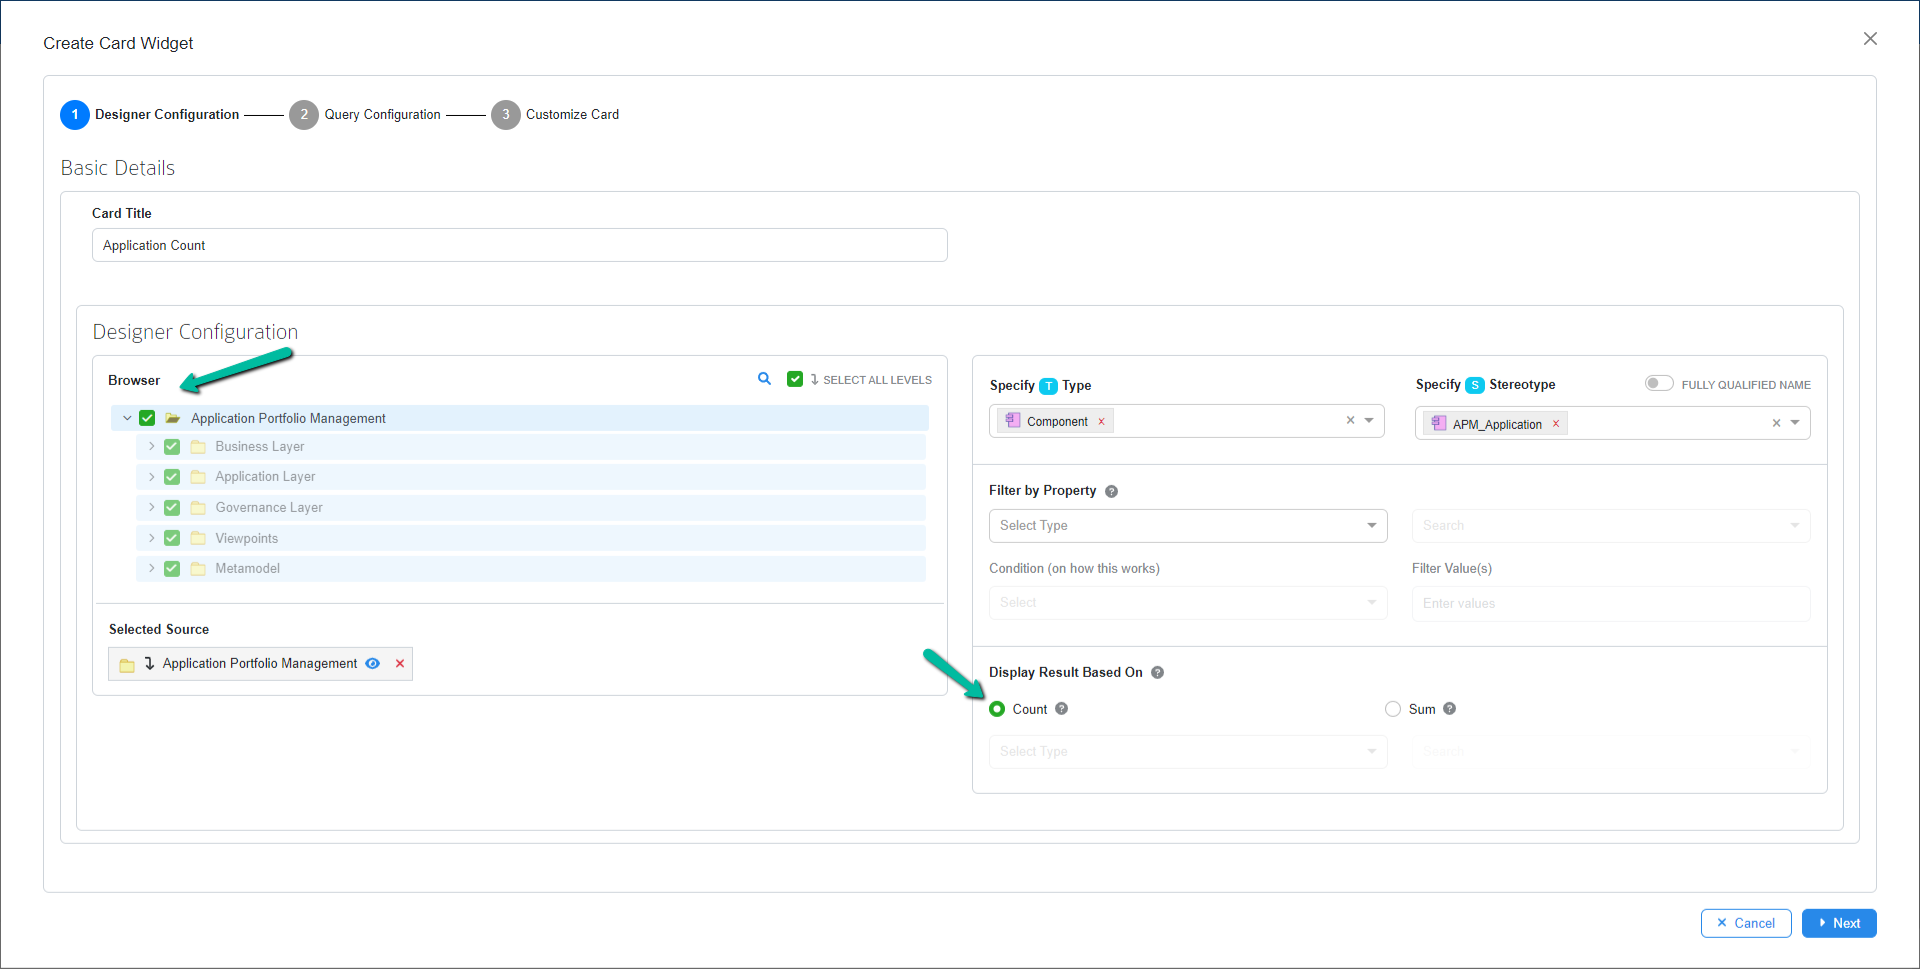
After choosing the required filters, click Next. Skip the query configuration page, the page displays auto generated query based on selection chosen from previous page. Users are allowed to modify the generated query by enabling Edit auto-generated query.
Click Next to navigate to the cards settings page.
Users can customize the style and aesthetics of the chart on the Chart Settings page. Click here to know more.
Click the Save button to save the widget once the configurations are done.
Count Based Report – Query Configuration
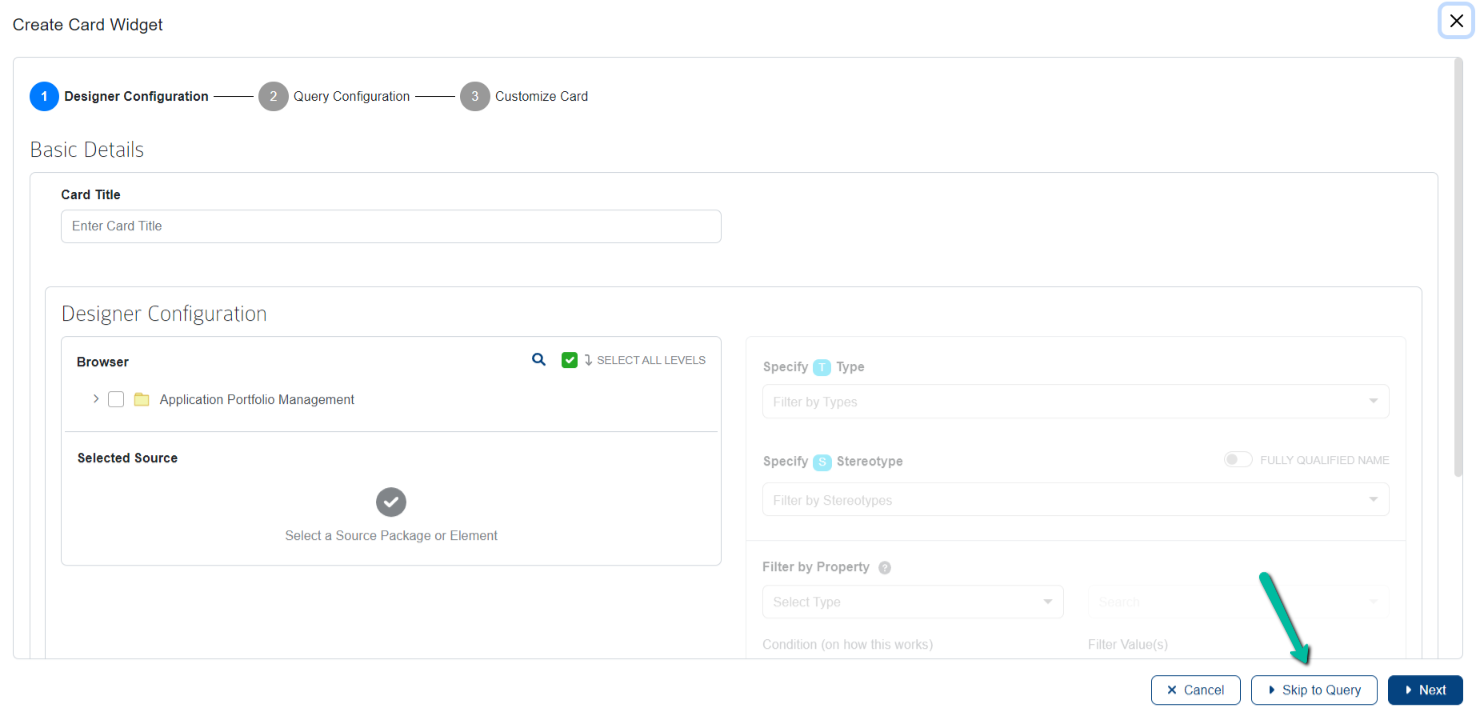
For advanced users, Cards can be configured directly by using SQL query. Click Skip to Query option at the bottom to go straight to the Query Configuration page.
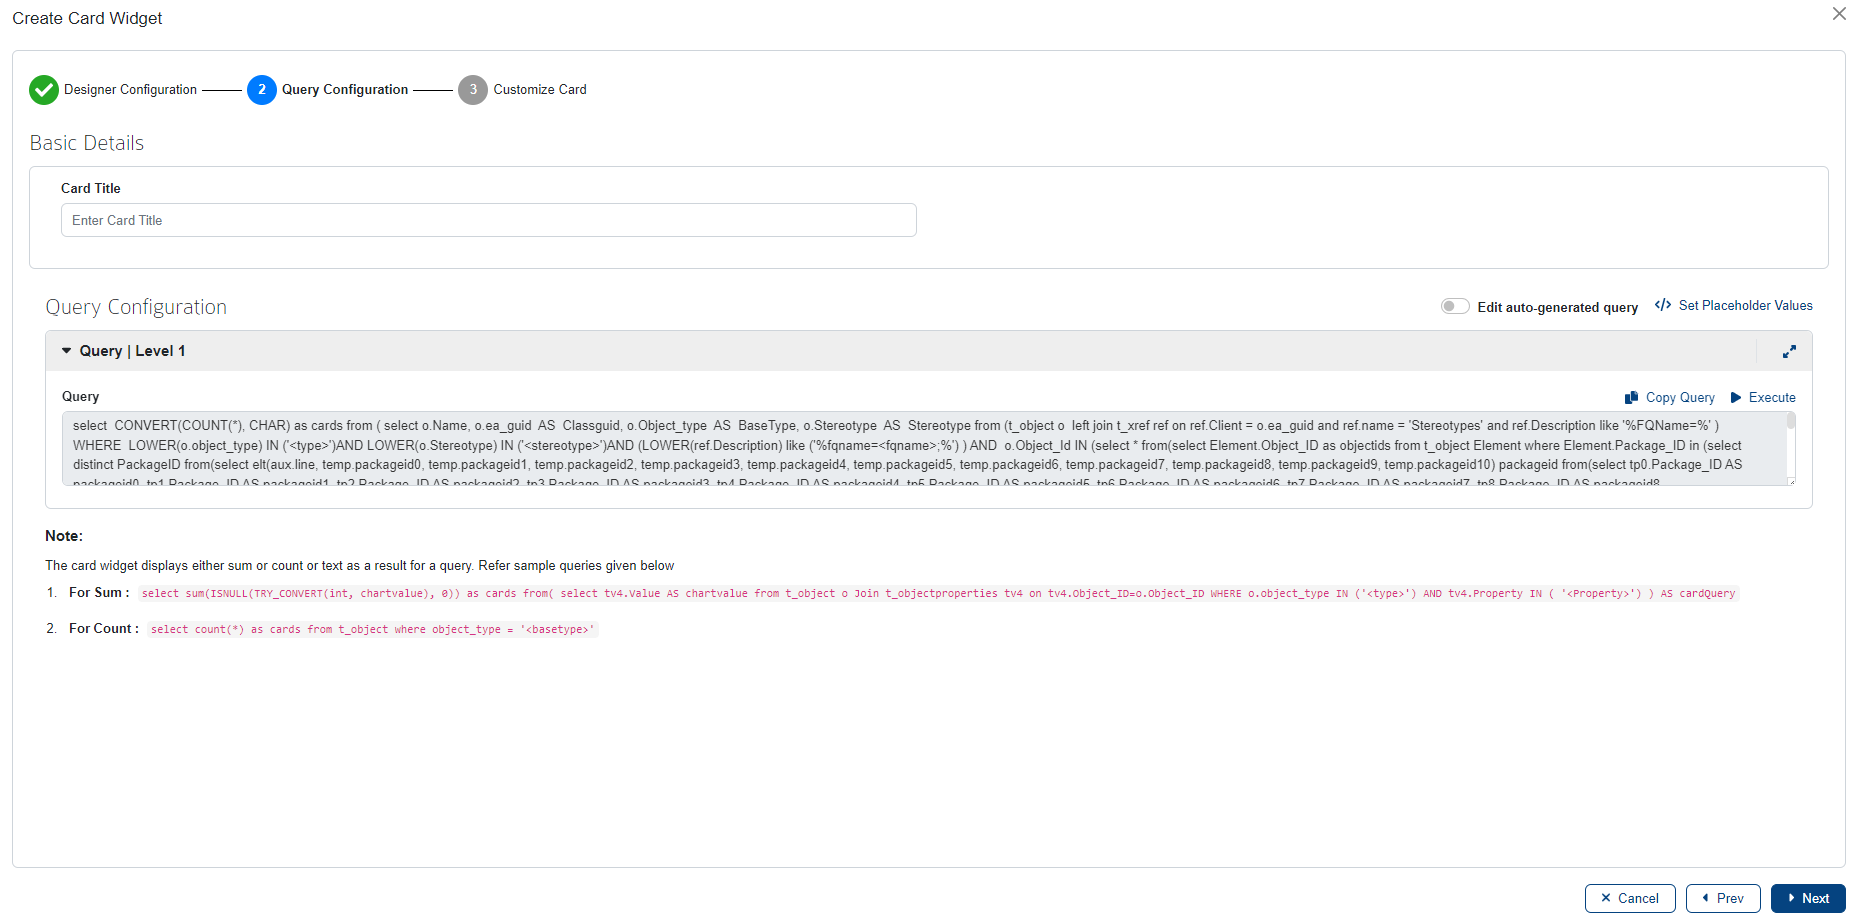
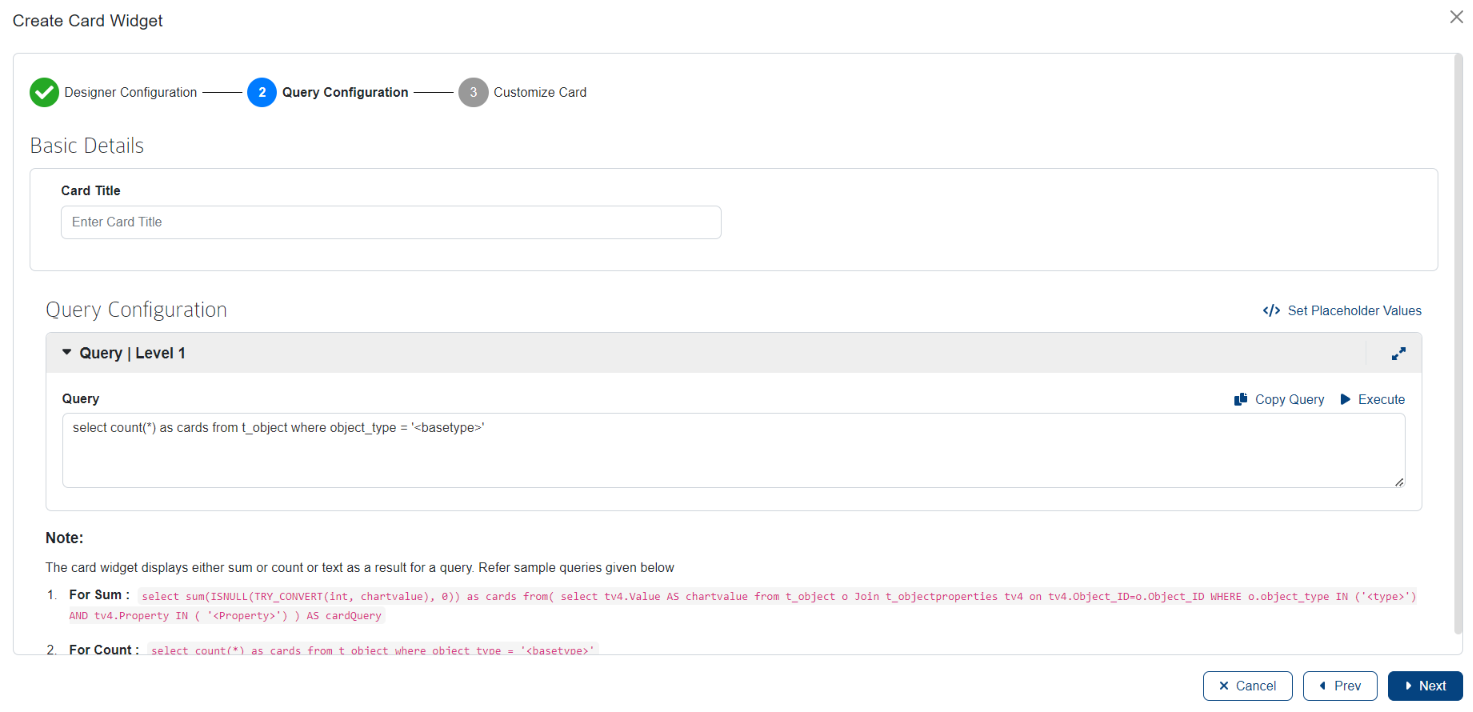
In the query configuration page, enter the query. Below table explains things you need to know in a query configuration page.
| Field | Description |
|---|---|
| Query | Enter the query in the space provided based on requirements. |
| Copy Query | Copy the entire query in a single click using this button. |
| Execute | Click Execute to open the Execute Query window and preview the results. If ‘Placeholders’ are present, enter values for them and preview the results using the Execute option. |
| Set Placeholder Values | Displays the list of placeholders in the query, if there is any. Enter values for the respective placeholders and save them. |
Sample Query:
select count(*) as cards from t_object where object_type = ''
The sample query above displays the business application count in the repository. Feel free to write your own query or copy and paste this query into the query field to view the results.
Note:
- In this example, the value of the placeholder <basetype> is ‘Component’
- The alias (cards) is mandatory to display the result in the final output.
Click Next to navigate to the Cards settings page.
Users can customize the style and aesthetics of the chart on the Chart Settings page. Click here to know more.
Click the Save button to save the widget once the configurations are done.

Sum Based Report – E.g. Useful for calculating total cost
The sum-based report can help us answer total cost spent on Applications and other artifacts. We can apply filters to answer a very narrow question such as total cost spend on Business Applications.
This can be achieved by using both Designer and SQL Query. Let us see an example on how to display the total cost of applications.
Sum Based Report- Designer Configuration
In the designer configuration page, configure the options. Below table explains things you need to know in a designer configuration page.
| Options | Description |
|---|---|
| Browser | It displays the list of packages that the user has access to in the repository. |
| Search Repository | It facilitates the search for packages and elements. Clicking on the Search icon opens the repository search page, where users can search for elements by name or alias. Users can also select object type, type, and stereotype from the dropdown menu to further filter the search. |
| Select All Levels | When the Select All Levels option is enabled, it automatically selects sub-packages and elements within a chosen package. |
| Specify Type | Choose the desired object types from the dropdown list within the package. |
| Specify Stereotype | Select the desired stereotypes from the dropdown list. |
| Fully Qualified Name | Enabling this option displays the complete name of the stereotype by combining the technology name and stereotype name. If disabled, only the stereotype name will be visible in the dropdown. |
| Filter By Property | Users can filter elements based on basic properties such as name, stereotype, status, notes, etc., as well as tagged values. |
| Display Result Based On | Choose Sum to display the number of elements with respect to the filters applied in the above configurations. |
Here, choose a tagged property with values as numbers to sum.
This example shows the sum of total cost spent applications. Source packages are selected, and filters for type (Component) and stereotype (APM_Application) are applied to narrow the result. Sum is selected in the Display Result Based On option and the required property (Total Cost of Ownership), displaying the total cost of business applications in the repository.
Note:
- Source selection and display result fields are mandatory. Other fields are optional and can be applied if required, by referring the above table.
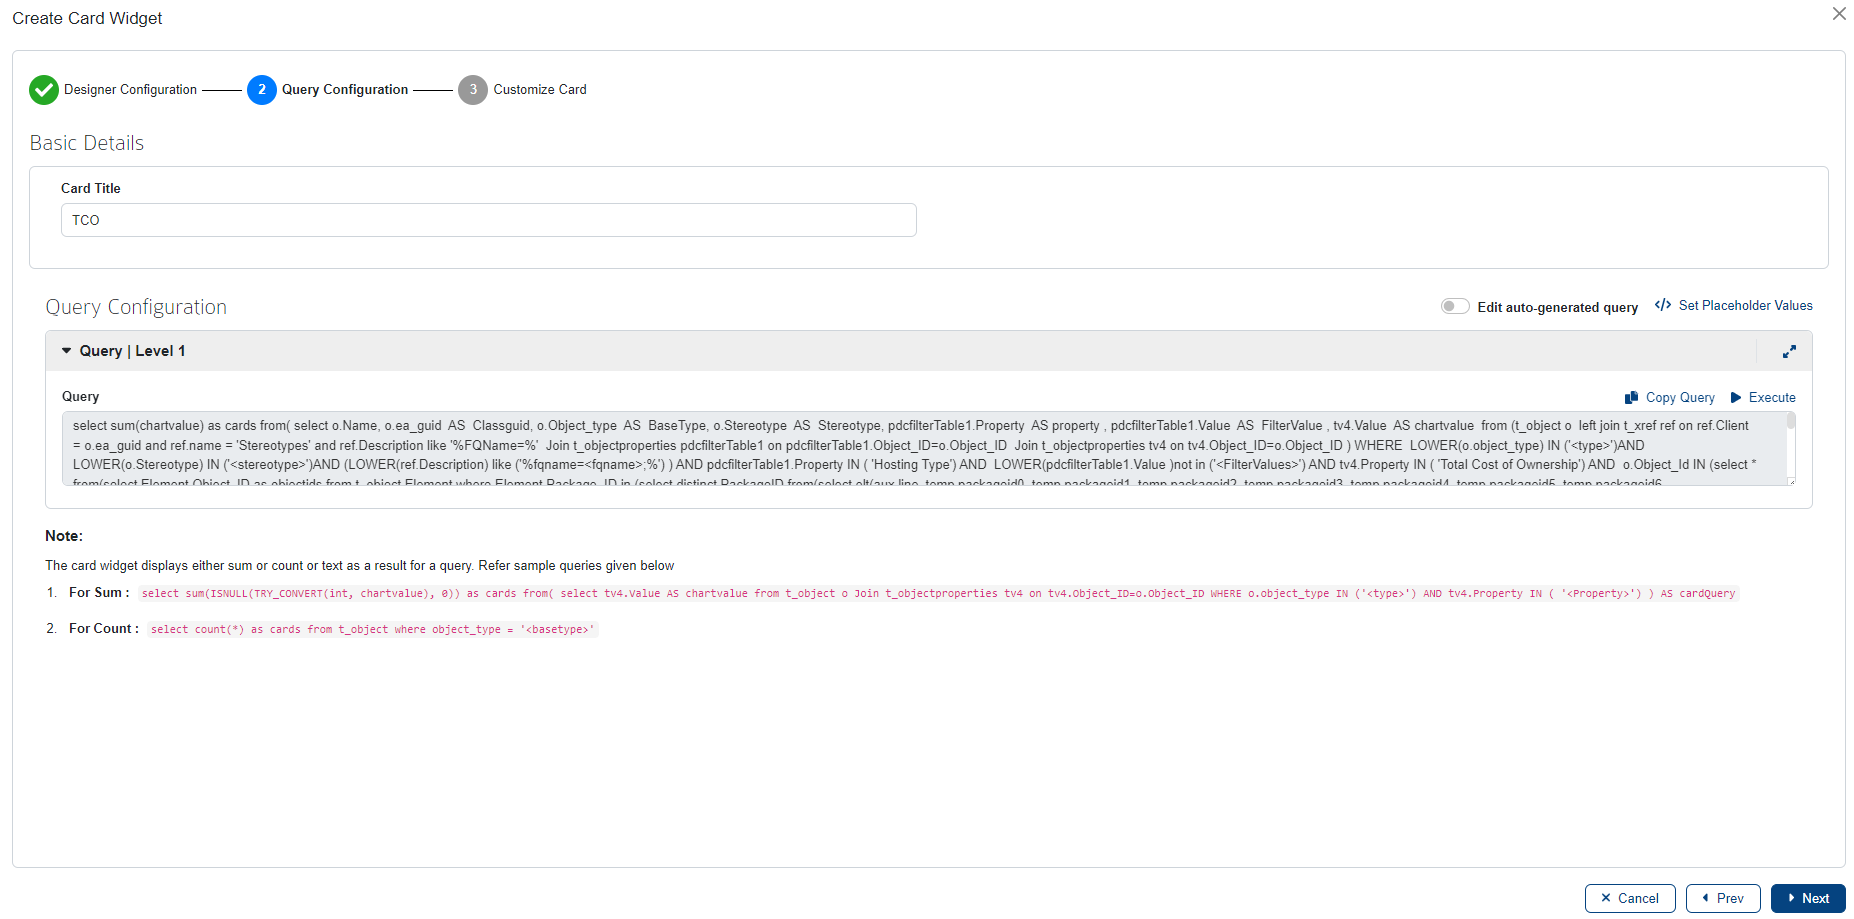
After choosing all the filters, click Next. On the query configuration page, the query is auto generated based on selection chosen from previous page. Users are freely allowed to modify the generated query by enabling Edit auto-generated query.
Click Next to navigate to the Cards settings page.
Users can customize the style and aesthetics of the chart on the Chart Settings page. Click here to know more.
Click the Save button to save the widget once the configurations are done.
Sum Based Report- Query Configuration
For advanced users, Cards can be configured directly by using SQL query. Click Skip to Query option at the bottom to go straight to the Query Configuration page.

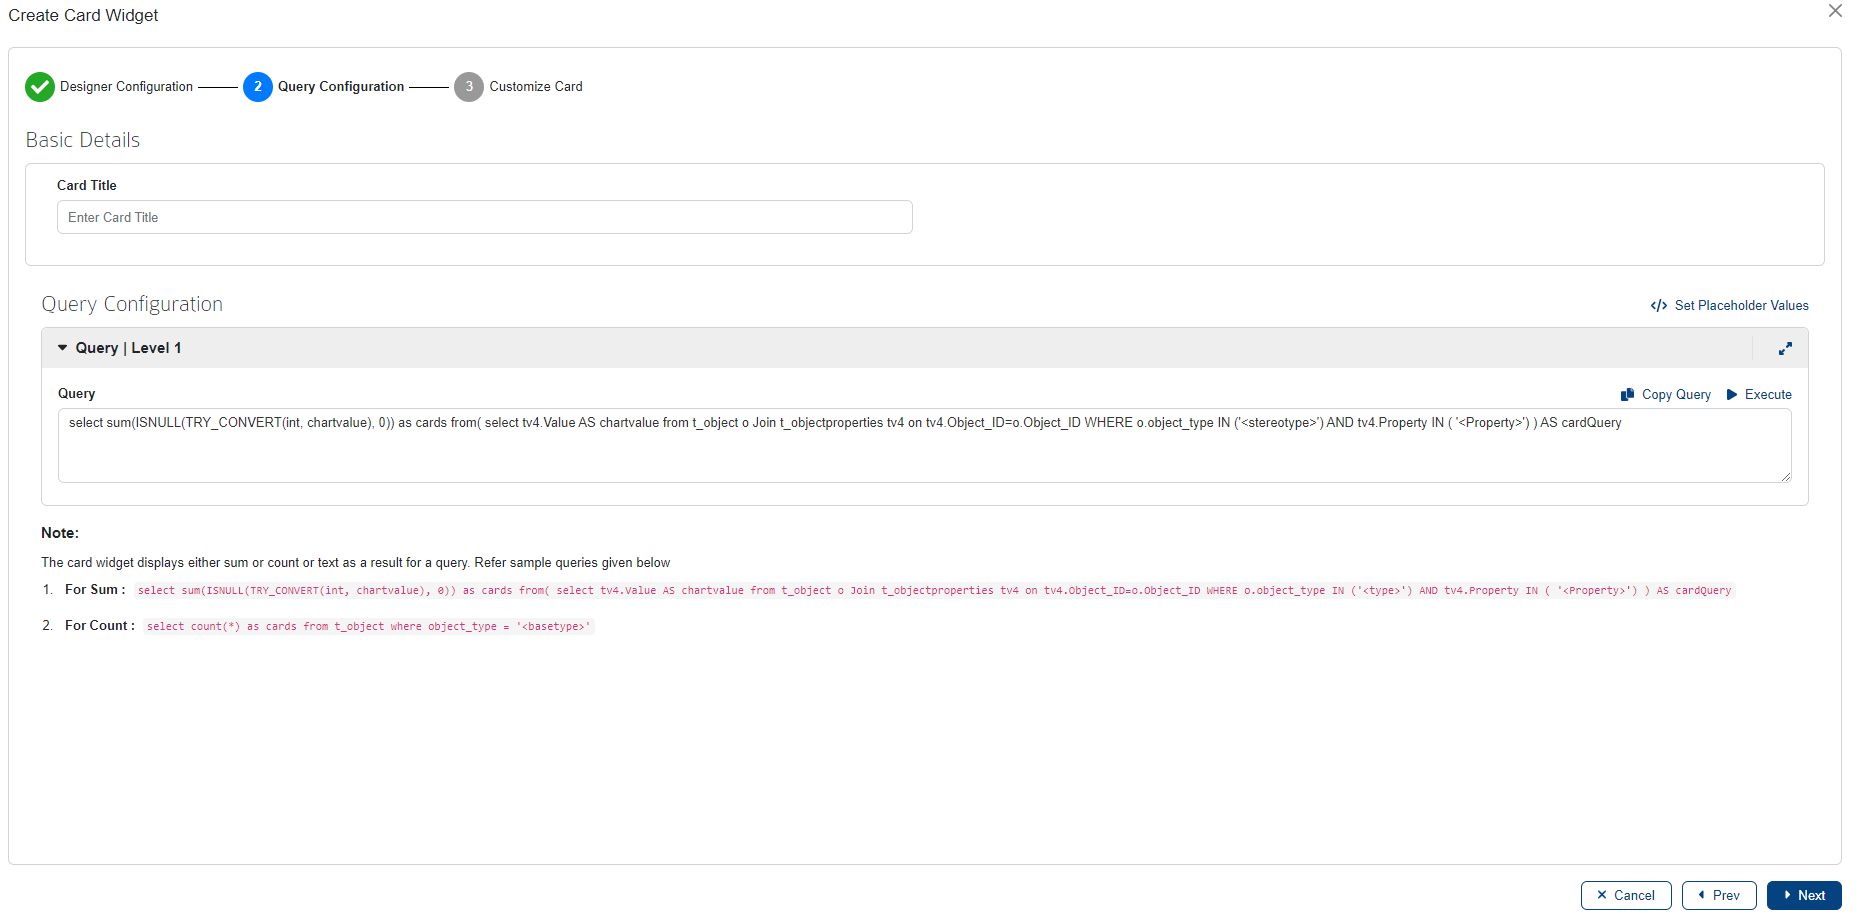
In the query configuration page, enter the query. Below table explains things you need to know in a query configuration page.
| Field | Description |
|---|---|
| Query | Enter the query in the space provided based on requirements. |
| Copy Query | Copy the entire query in a single click using this button. |
| Execute | Click Execute to open the Execute Query window and preview the results. If ‘Placeholders’ are present, enter values for them and preview the results using the Execute option. |
| Set Placeholder Values | Displays the list of placeholders in the query, if there is any. Enter values for the respective placeholders and save them. |
Sample Query:
MySQL
select sum(chartvalue) as cards from( select tv4.Value AS chartvalue from t_object o Join t_objectproperties tv4 on tv4.Object_ID=o.Object_ID WHERE o.object_type IN ('') AND tv4.Property IN ( '') ) AS cardQuery
MSSQL
select sum(ISNULL(TRY_CONVERT(int, chartvalue), 0)) as cards from( select tv4.Value AS chartvalue from t_object o Join t_objectproperties tv4 on tv4.Object_ID=o.Object_ID WHERE o.object_type IN ('') AND tv4.Property IN ( '') ) AS cardQuery
The sample query above returns the total cost of the business applications in the repository. Feel free to write your own query or copy and paste this query into the query field to view the results.
Note:
- For this example, the value of the placeholder <type> is ‘Component’ and <Property> is ‘Total Cost of Ownership’
- The alias ‘cards’ is mandatory to display the result in the final output
Click Next to navigate to the Cards settings page.
Users can customize the style and aesthetics of the chart on the Chart Settings page. Click here to know more.
Click the Save button to save the widget once the configurations are done.
Calculate Percentage
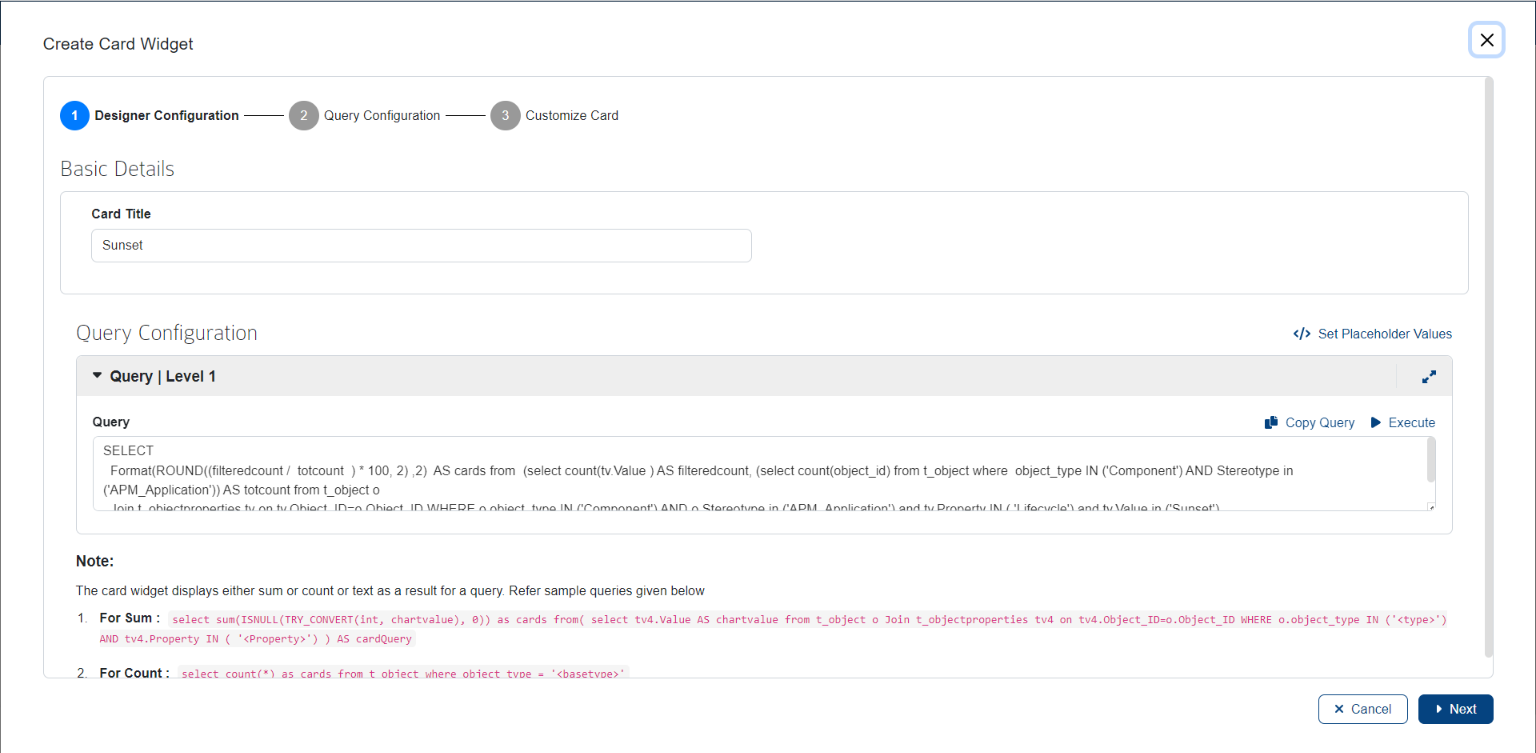
The percentage-based cards report can help us answer percentage applications with Lifecycle Status ‘Sunset’ against the total number of applications. This kind of cards report can be configured using SQL Query.
Query Configuration
Click Skip to Query option at the bottom to go straight to the Query Configuration page.

In the query configuration page, enter the query. Below table explains things you need to know in a query configuration page.
| Field | Description |
|---|---|
| Query | Enter the query in the space provided based on requirements. |
| Copy Query | Copy the entire query in a single click using this button. |
| Execute | Click Execute to open the Execute Query window and preview the results. If ‘Placeholders’ are present, enter values for them and preview the results using the Execute option. |
| Set Placeholder Values | Displays the list of placeholders in the query, if there is any. Enter values for the respective placeholders and save them. |
Sample Query:
MySQL
SELECT Format(ROUND((filteredcount /  totcount  ) * 100, 2) ,2) AS cards from (select count(tv.Value ) AS filteredcount, (select count(object_id) from t_object where  object_type IN ('') AND Stereotype in ('')) AS totcount from t_object o

                            Join t_objectproperties tv on tv.Object_ID=o.Object_ID WHERE o.object_type IN ('') AND o.Stereotype in ('') and tv.Property IN ('') and tv.Value in ('')) as completeQuery
MSSQL
SELECT (filteredcount * 100 /  totcount  )  AS cards from  (select count(tv.Value ) AS filteredcount, (select count(object_id) from t_object where  object_type IN ('') AND Stereotype in ('')) AS totcount from t_object o

                            Join t_objectproperties tv on tv.Object_ID=o.Object_ID WHERE o.object_type IN ('') AND o.Stereotype in ('') and tv.Property IN ('') and tv.Value in ('')) as completeQuery
The sample query above returns the percentage of applications with Lifecycle Status ‘Sunset’ against the total number of applications. Feel free to write your own query or copy and paste this query into the query field to view the results.
Note:
- In the above example, the value of the placeholder <Type> is ‘Component’, <Stereotype> is ‘<APM_Application>’, <Property> is ‘Lifecycle’ and <Value> is ‘Sunset’
- The alias ‘cards’ is mandatory to display the result in the final output
Click Next to navigate to the Cards settings page.
Users can customize the style and aesthetics of the chart on the Chart Settings page. Click here to know more.
Click the Save button to save the widget once the configurations are done.
Text Based Report – E.g. Useful for printing a text based on a condition
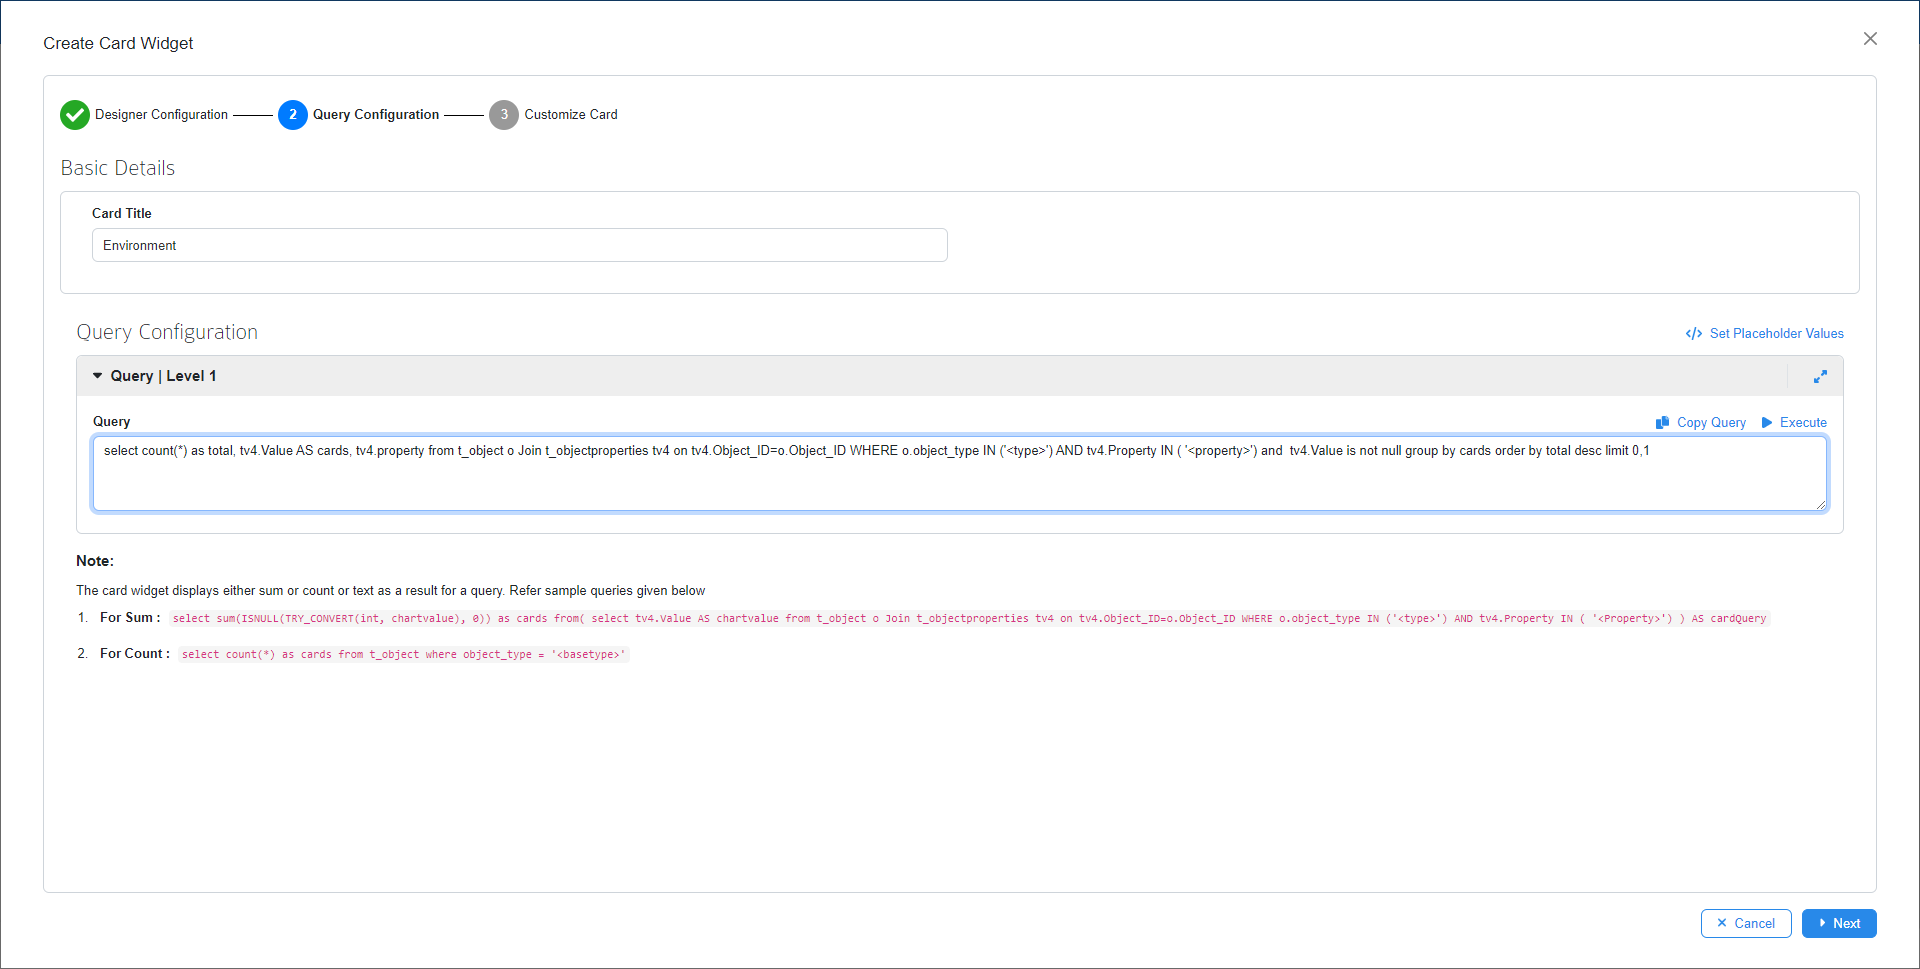
The text-based cards report can help us answer the maximum/minimum value or any value based on specific condition. This kind of cards report can be configured using SQL Query.
Query Configuration
Click Skip to Query option at the bottom to go straight to the Query Configuration page.

In the query configuration page, enter the query. Below table explains things you need to know in a query configuration page.
| Options | Description |
|---|---|
| Query | Enter the query in the space provided based on requirements. |
| Copy Query | Copy the entire query in a single click using this button. |
| Execute | Click Execute to open the Execute Query window and preview the results. If ‘Placeholders’ are present, enter values for them and preview the results using the Execute option. |
| Set Placeholder Values | Displays the list of placeholders in the query, if there is any. Enter values for the respective placeholders and save them. |
Sample Query:
MySQL
select count(*) as total, tv4.Value AS cards, tv4.property from t_object o Join t_objectproperties tv4 on tv4.Object_ID=o.Object_ID WHERE o.object_type IN ('') AND tv4.Property IN ( '') and tv4.Value is not null group by cards order by total desc limit 0,1
MSSQL
select STRING_AGG(finalVal.chartvalue, ',') as cards from (select finals.chartvalue, DENSE_RANK() OVER ( ORDER BY count(finals.chartvalue) DESC) as topValue from ( select tv4.Value AS chartvalue from t_object o Join t_objectproperties tv4 on tv4.Object_ID=o.Object_ID WHERE o.object_type IN ('') AND tv4.Property IN ( '') )finals group by finals.chartvalue)finalVal where finalVal.topValue=1;
The sample query above returns the maximum value of applications environment in a short text. Feel free to write your own query or copy and paste this query into the query field to view the results.
The text-based cards report can help us answer the maximum/minimum value or a value based on specific condition.
Note:
- In the above example, the value of the placeholder <Type> is ‘Component’ and <Property> is ‘Environment’
- The alias ‘cards’ is mandatory to display the result in the final output
Click Next to navigate to the Cards settings page.
Users can customize the style and aesthetics of the chart on the Chart Settings page. Click here to know more.
Click the Save button to save the widget once the configurations are done.
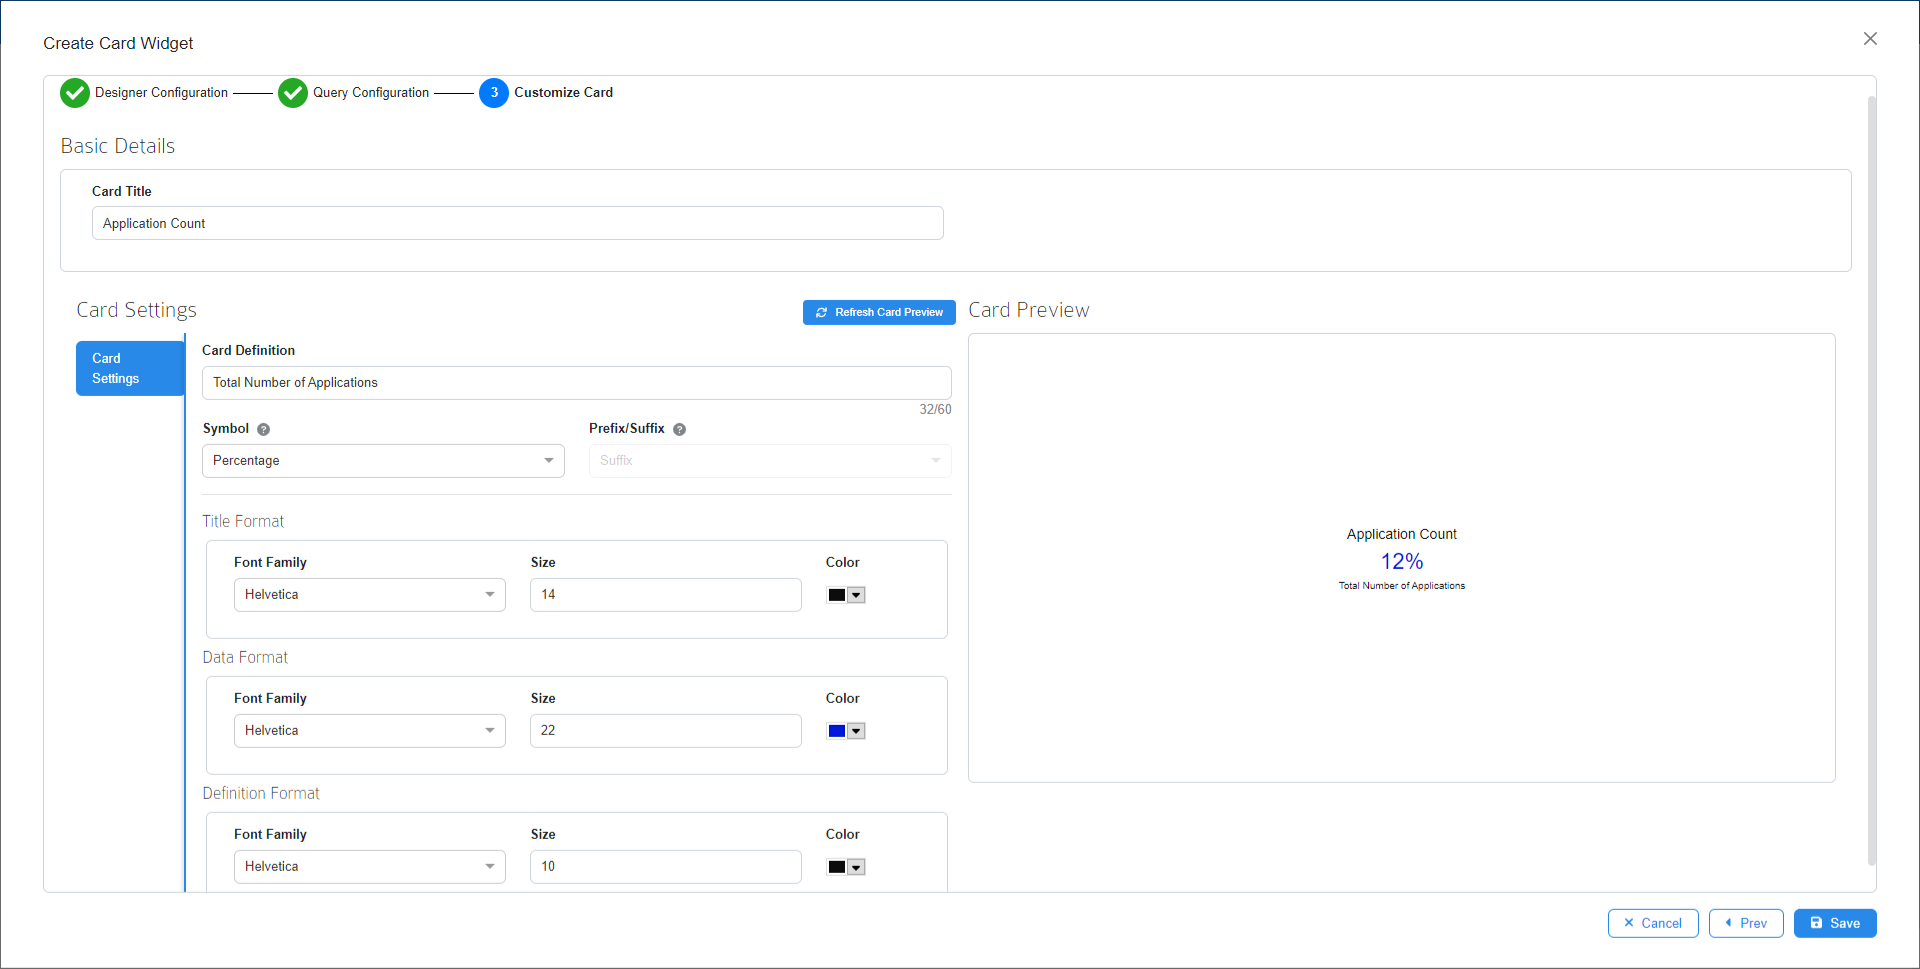
Customize Cards
Users can customize the style and aesthetics of the cards in the Cards Settings window. User can perform the formatting after selecting the source. Formatting can be performed during or after widget creation.
| Options | Description |
|---|---|
| Cards Title | Gives an insight about the cards report |
| Cards Definition | Gives an overview of the report’s purpose |
| Symbol | Set to None for count Select Dollar, Pound, Yen or Euro for cost related requirement and place it as a prefix or suffix to the result. Select Percentage as the symbol |
| Formatting | Customize the style and color of the output of Title, Data and Definition |
| Cards Preview | This section shows a preview of the cards |
| Refresh Cards Preview | This option allows you to see a preview of the changes made in the Cards Setting section |
Cards Widget Options
Once the chart widget is created, multiple options will be displayed when hovering on it.
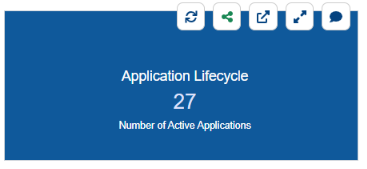
The option in the widget includes
- Refresh the widget, to reload the content
- Share the widget as a Public, Private or Embed link using a short URL
- View the widget in a separate page
- Maximize or minimize the widget in the dashboard
- Initiate a discussion on the widget