Lifecycle Roadmap
Overview
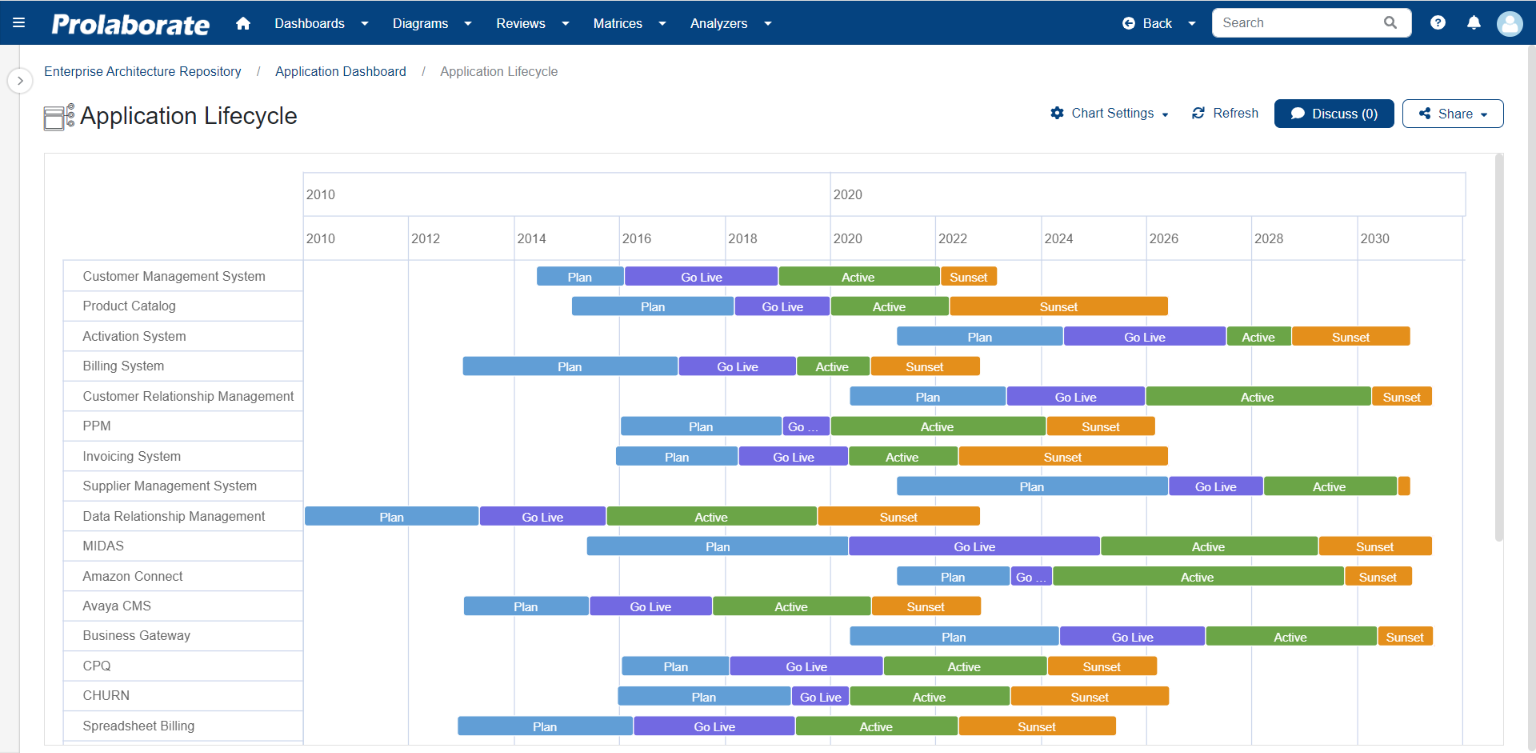
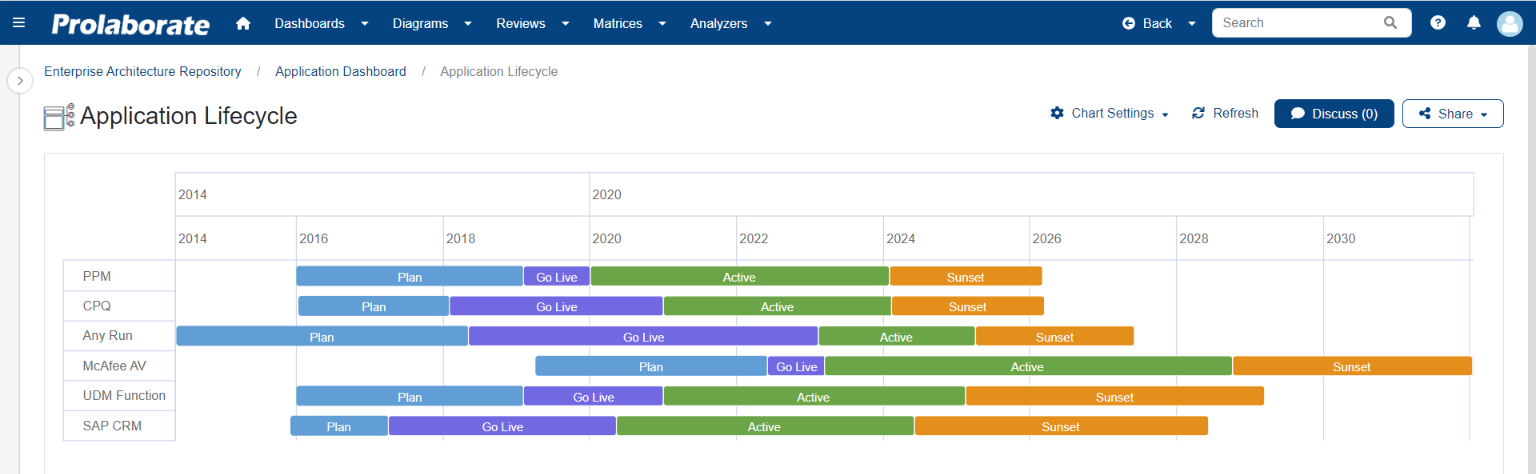
The advanced lifecycle roadmap is a powerful method for showcasing the status of various architectural artifacts, such as applications, capabilities, or projects. It plays a pivotal role in the Application Portfolio Planning providing a clear and concise overview of their lifecycles. It enables strategic planning, efficient resource allocation, risk management, enhanced decision-making, improves transparency of communication, and more which ultimately contributes to Business growth.


How to Create Lifecycle Roadmap?
Prerequisites to create Lifecycle Roadmap
- Prolaborate version should be 5.0 and above.
- The user must have access to the EA repository in Prolaborate.
- To create Lifecycle Roadmap, the user must be part of a user group which has administrative access to dashboard provided by admin.
- Lifecycle Configuration must be created for the stereotype for which a roadmap needs to be created. Click here to know about how to create Lifecycle Configuration.
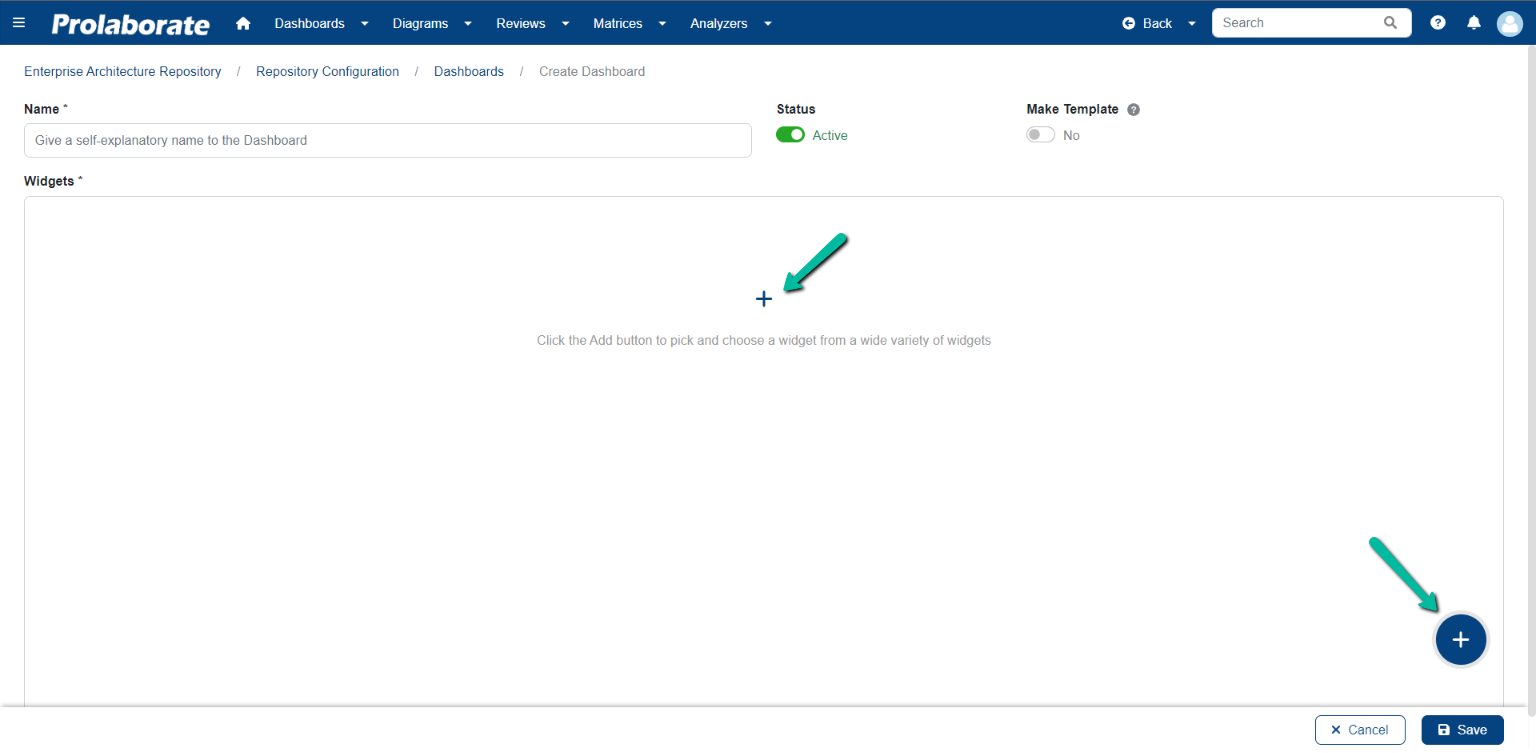
The first step is to create a dashboard or use an existing dashboard which incorporates the charts as a widget. A new dashboard can be created by choosing Create from the dropdown in the header menu.
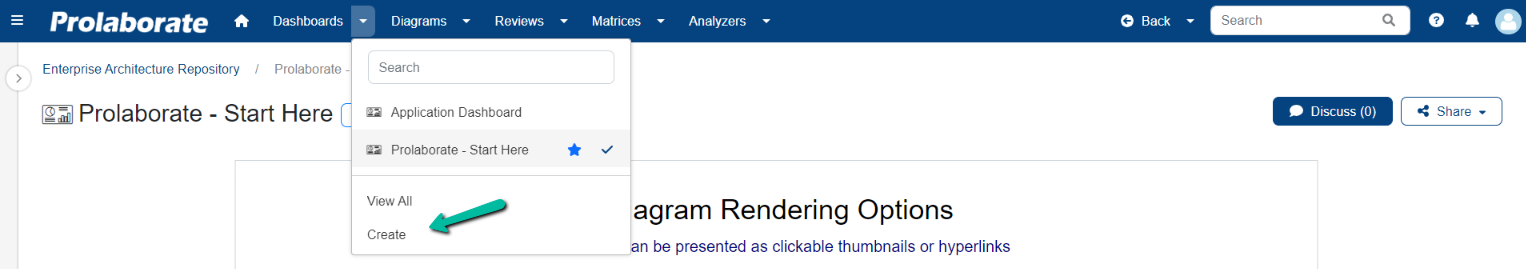
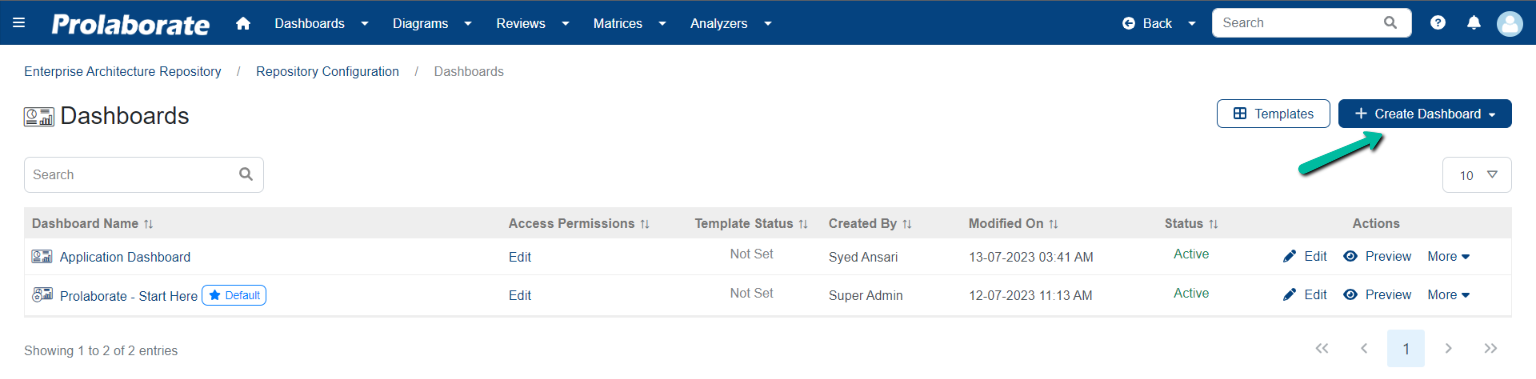
Users can also choose View all to navigate to the dashboard landing page and choose Create Dashboard.
Next add a widget by clicking Add Widget Button > Add New by any one of the options given below.
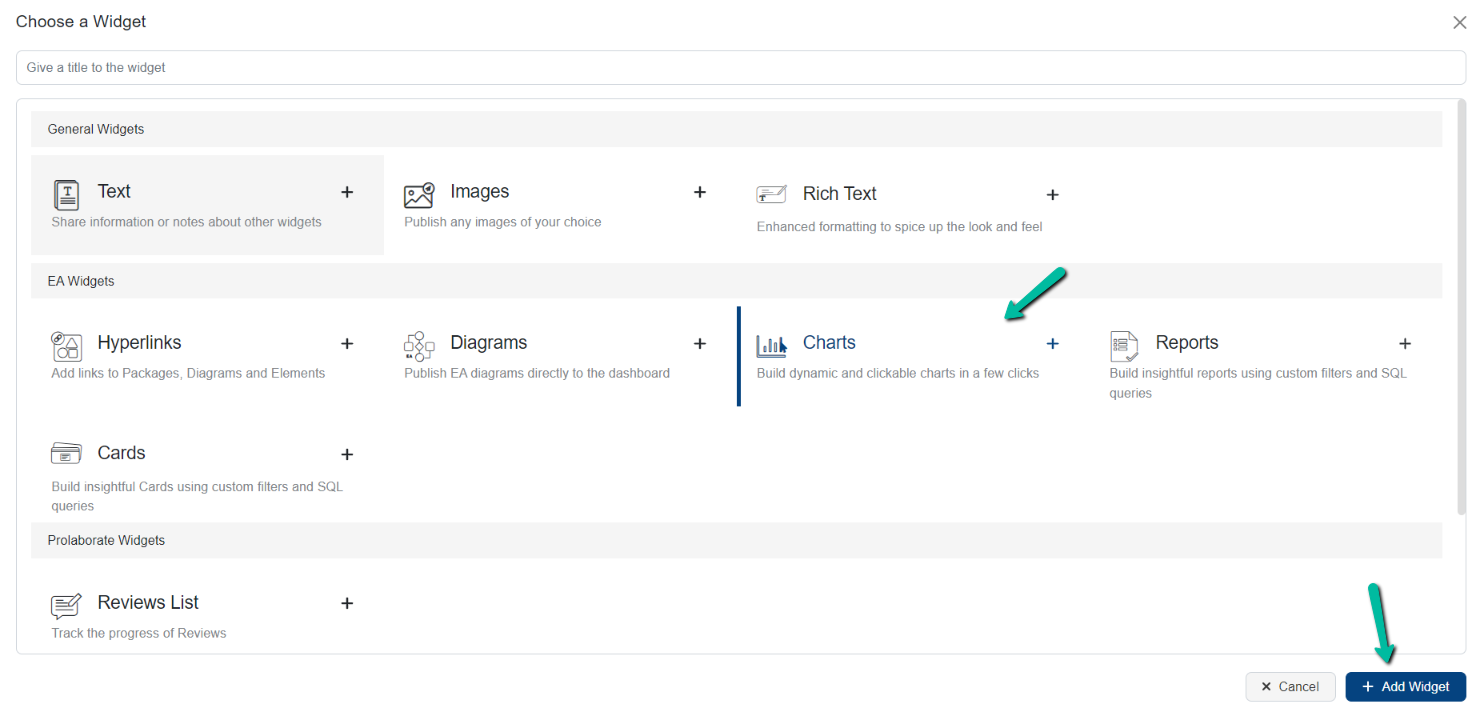
In Choose a Widget window, select the Chart type widget and click Add Widget.
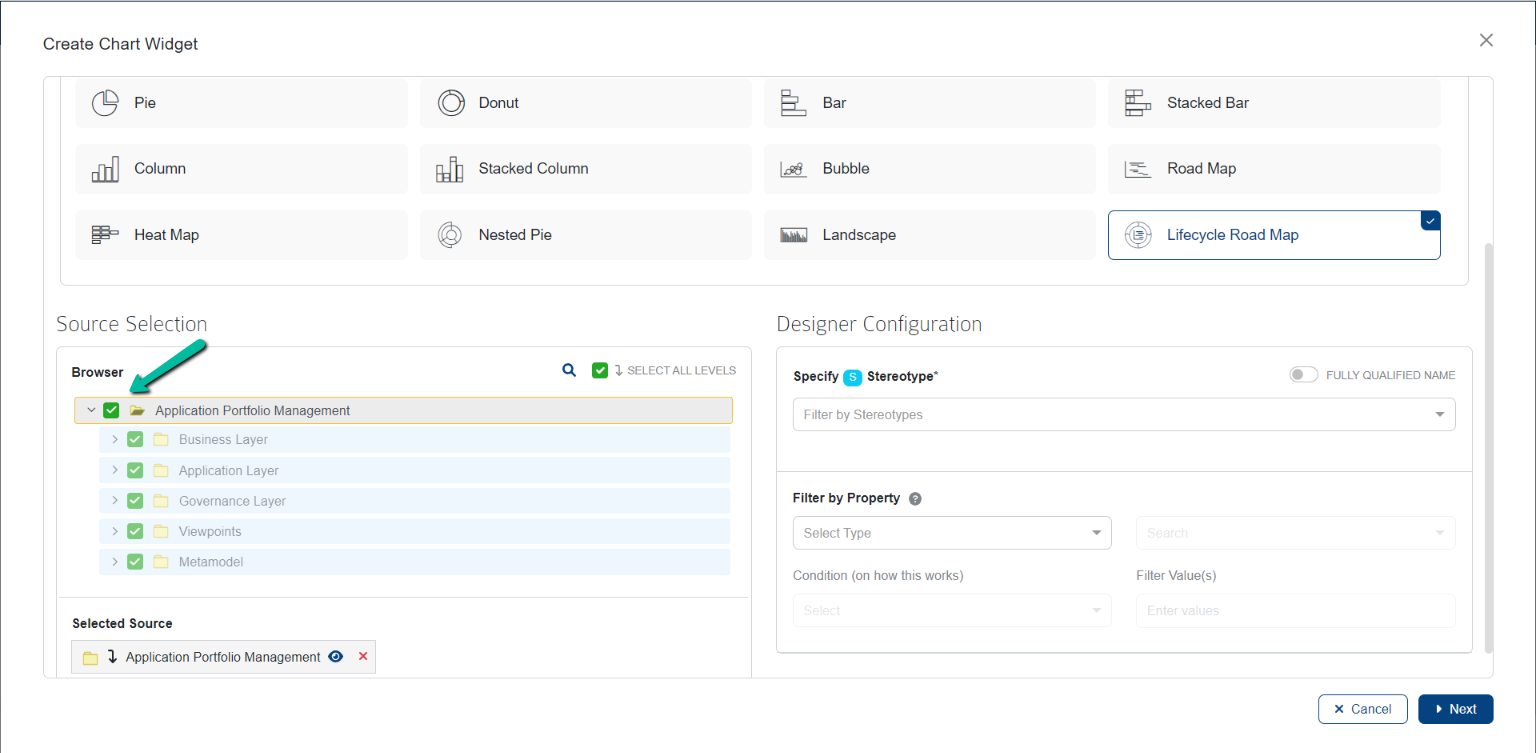
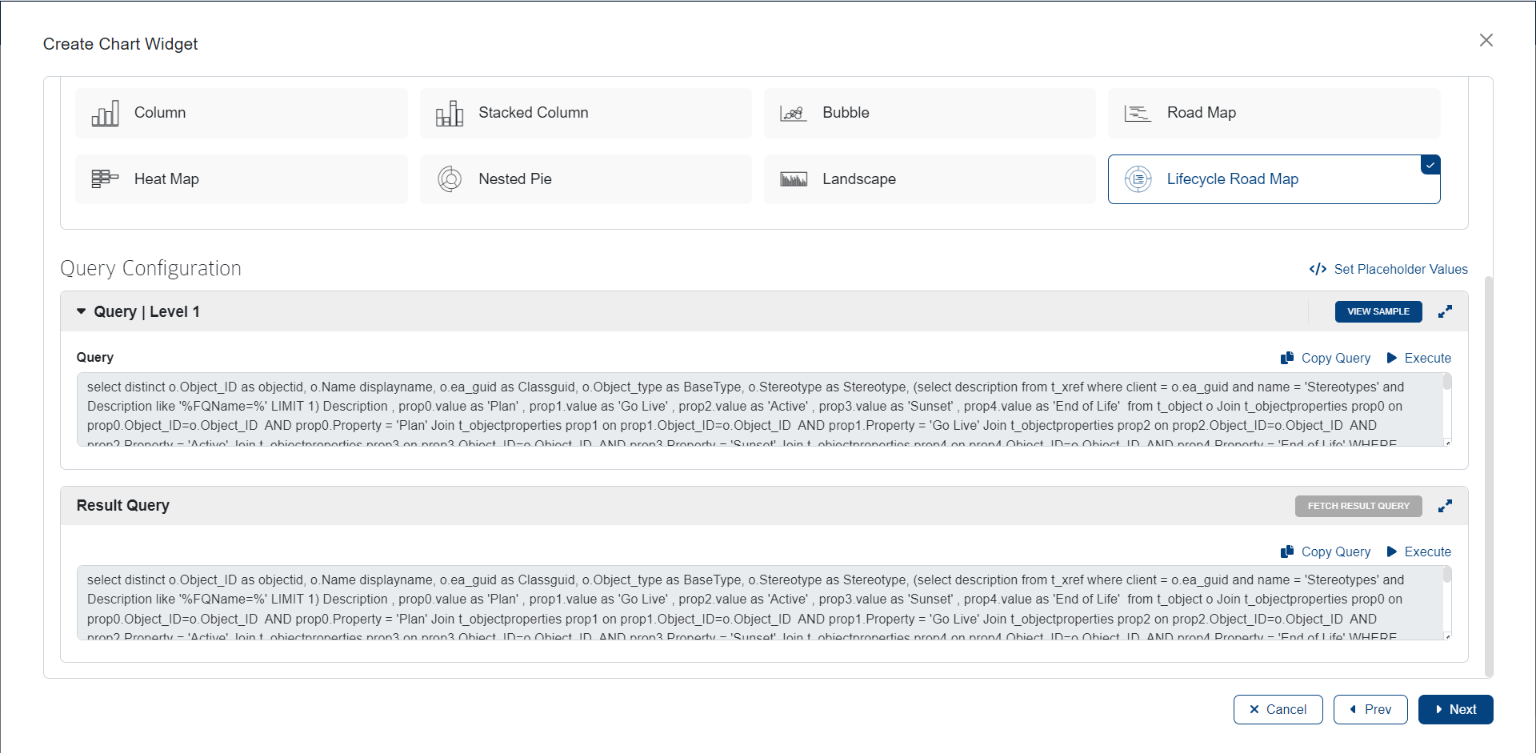
Enter a suitable name for the chart and choose the chart type as Lifecycle Road Map. Enable Cache Data to improve the performance of the chart by loading data from cache. Click here to know more.
Source Selection
Select the packages from which the chart is to be created.
| Field | Description |
|---|---|
| Browser | It displays the list of packages that the user has access to in the repository. |
| Search Repository | It facilitates the search for packages and elements. Clicking on the Search icon opens the repository search page, where users can search for elements by name or alias. Users can also select object type, type, and stereotype from the dropdown menu to further filter the search. |
| Select All Levels | When the Select All Levels option is enabled, it automatically selects sub-packages and elements within a chosen package. |
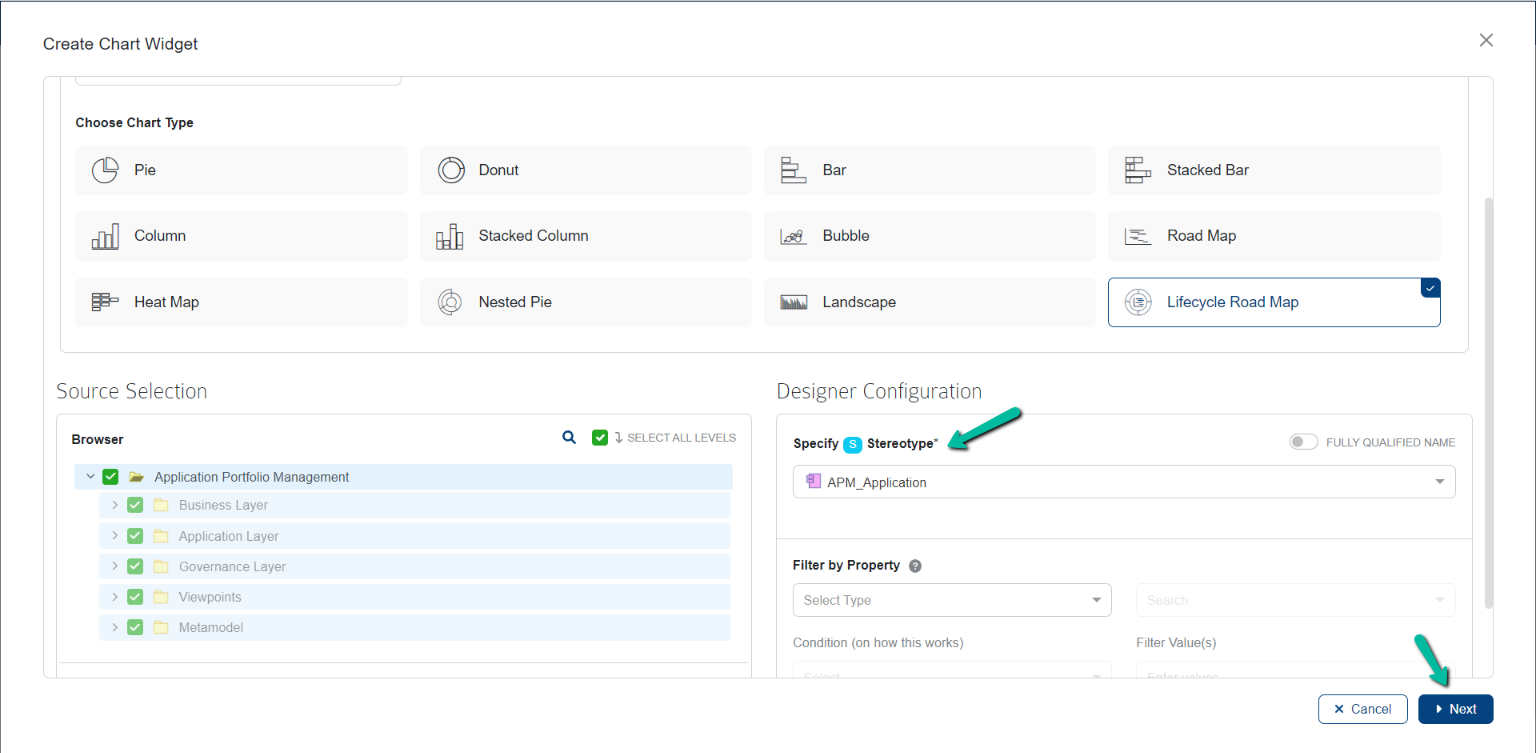
Designer Configuration
Upon selecting the package, the Specify Stereotype dropdown lists all the stereotypes which have Lifecycle Configuration that is already defined. Select the required stereotype and click Next. In case no lifecycle configuration is added, the user will notice empty result in the dropdown. Click here to know how to define a lifecycle configuration.
Users can preview the result by clicking the Execute button in the query configuration page. Click Next to go the chart customization window where users can configure the style and aesthetics of the chart. Click here to know more about Roadmap Style Configuration.
Click the Save button to save the widget and then click save again to save the dashboard.
Users can define conditions to filter the data listed in the Roadmap. Click here to know more
Lifecycle Configuration (A Pre-requisite to build a lifecycle Roadmap)
To create Lifecycle Roadmap, user must create Lifecycle Configuration for a stereotype from which the chart is configured.
Prerequisites to create Lifecycle Configuration
- Prolaborate version should be 5.0 and above.
- The user must have access to the EA repository in Prolaborate.
- To create Lifecycle Configuration, the user must be part of a user group which has administrative access to modeling language provided by admin.
- The required modeling language must be uploaded in Prolaborate.
- Pre-defined date type tagged values must be included for the required stereotype when defining the modeling language.
How to Create Lifecycle Configuration?
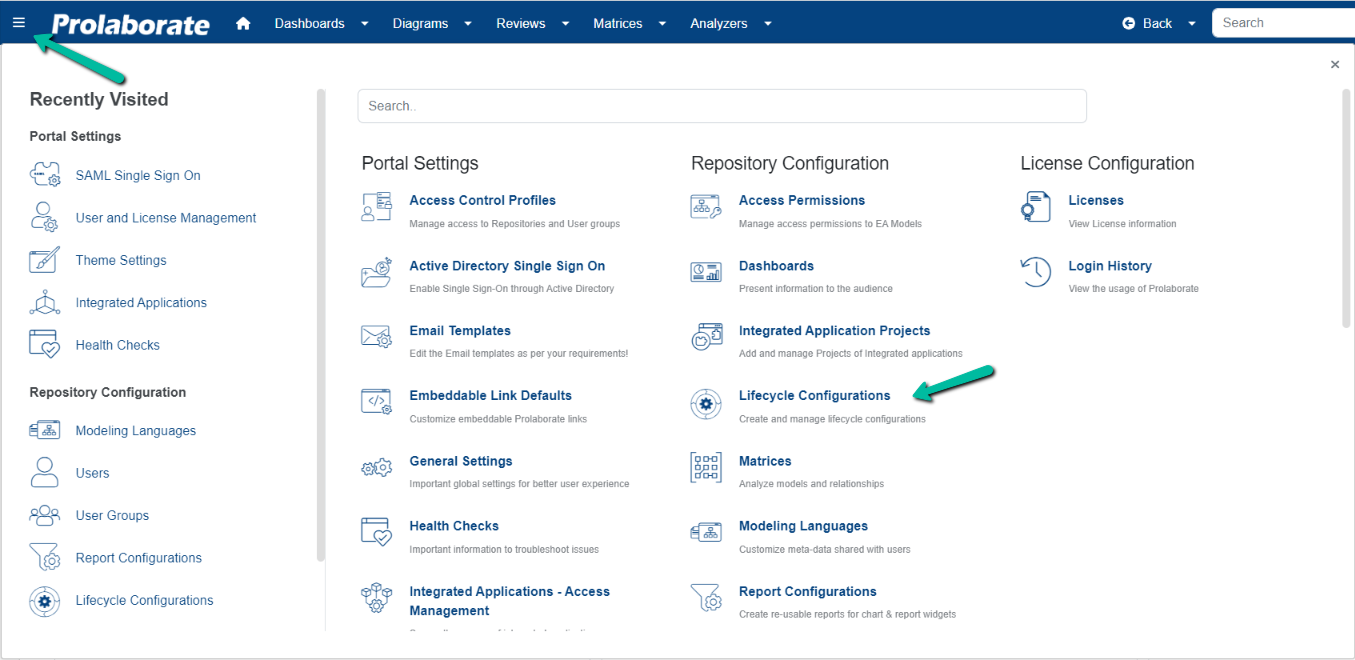
To create a Lifecycle Configuration, click on Menu > Lifecycle Configuration under Repository Configuration.
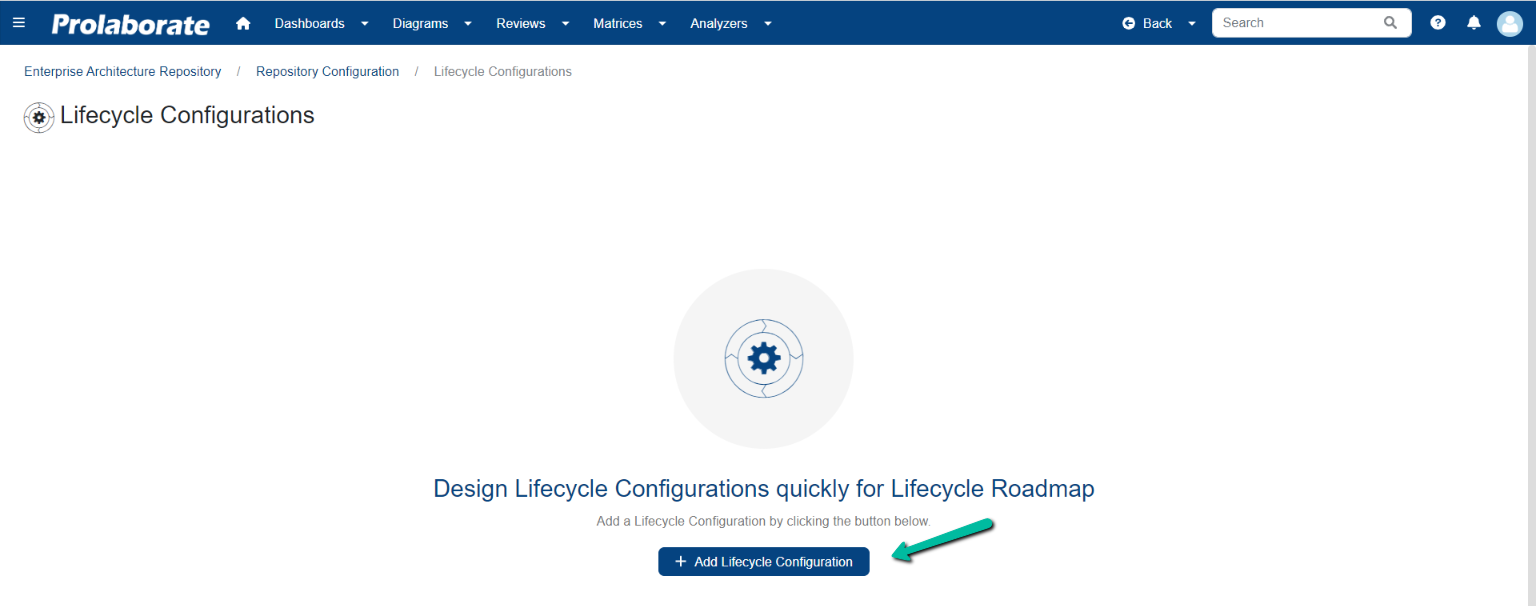
Click Add Lifecycle Configuration.
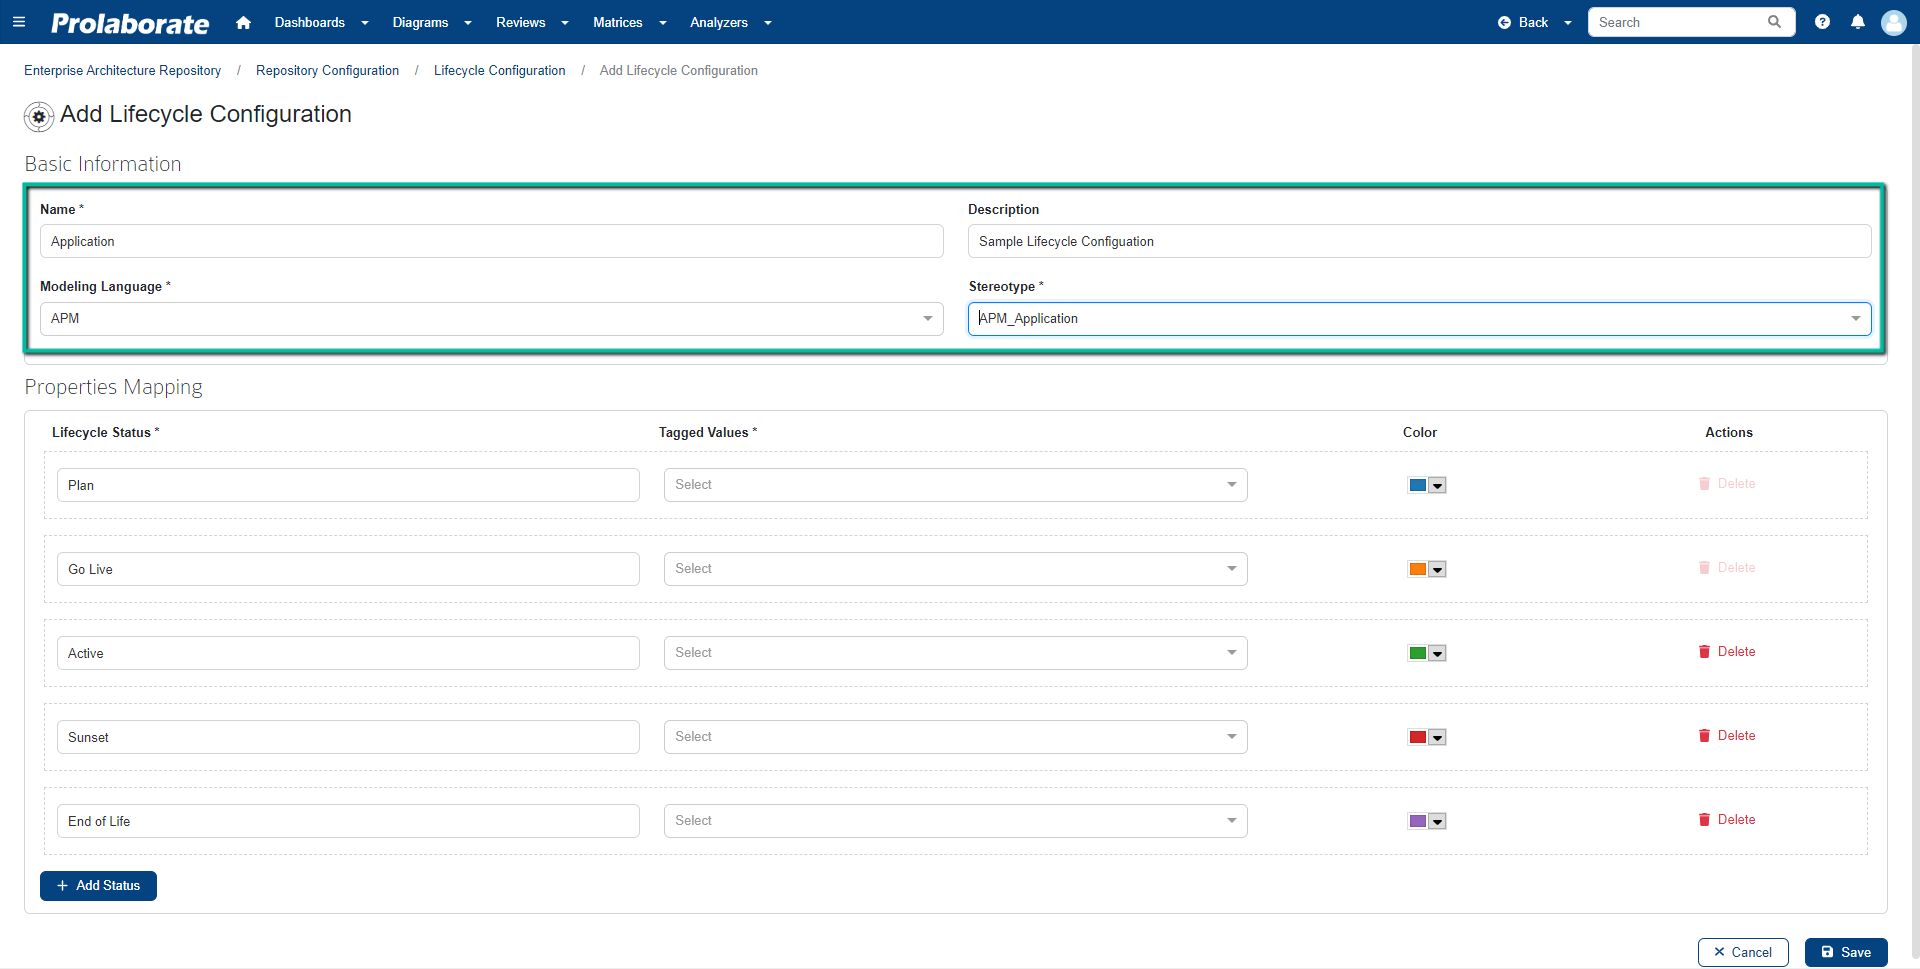
In Add Lifecycle Configuration page, do the following
Basic Information
| Field | Description |
|---|---|
| Name | Enter a suitable name for the configuration |
| Description | Enter a short description about the configuration |
| Modeling Language | Choose a Modeling Language uploaded in Prolaborate from the dropdown |
| Stereotype | Upon choosing a Modeling Language, a list of stereotypes available will be displayed when clicking the dropdown. Choose the required stereotype for which the lifecycle configuration is created. |
Properties Mapping
| Field | Description |
|---|---|
| Lifecycle Status | Enter a suitable label name for the tagged value. By default, label names are pre-filled, and it can be changed if required. Note that the same label name cannot be given for two status mappings |
| Tagged Values | Choose the required tagged value. Note that only the date type tagged values defined for the stereotype during the creation of MDG will be listed upon clicking the dropdown |
| Color | Users can pick or choose the required color to match the status using the color picker. Upon creation, colors from the default palette are applied for each status as default. |
| Actions | Users can delete a status if required. Note that the first two status cannot be deleted because mapping of at least two properties is required for Lifecycle Roadmap |
| Add Status | Click on Add Status to add a new row to map additional properties |
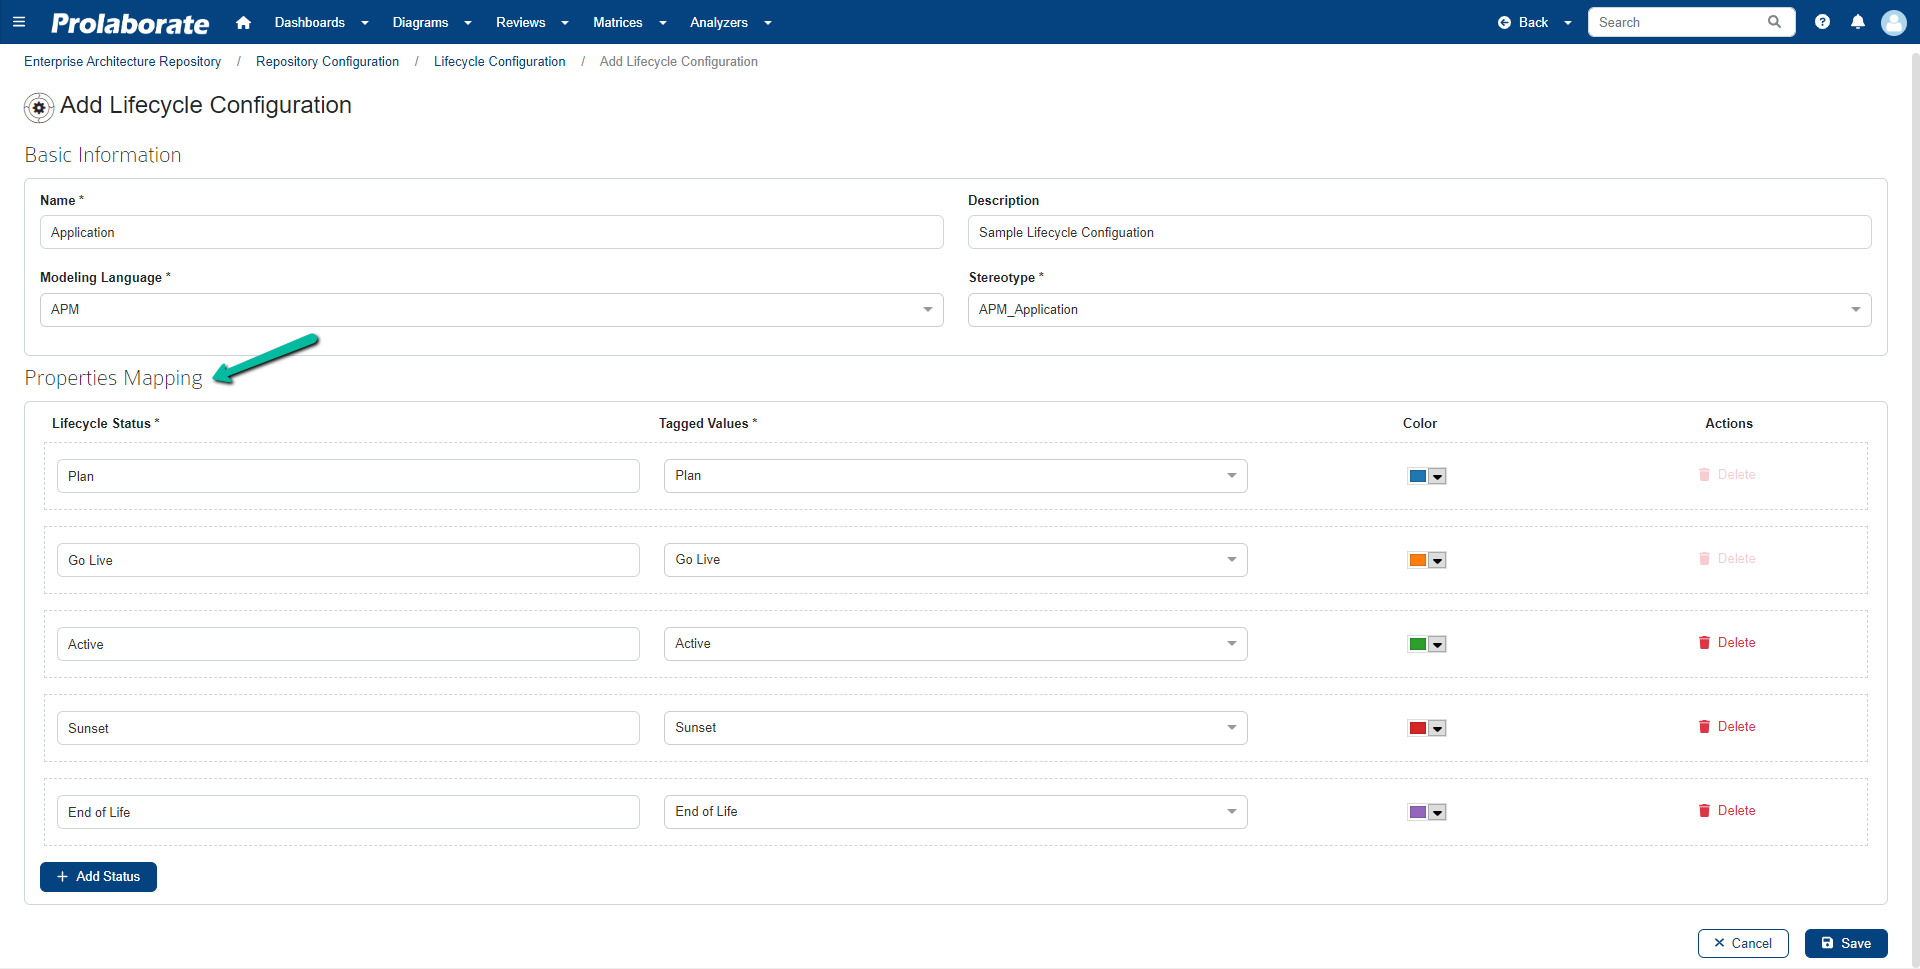
Click Save to save the lifecycle configuration.
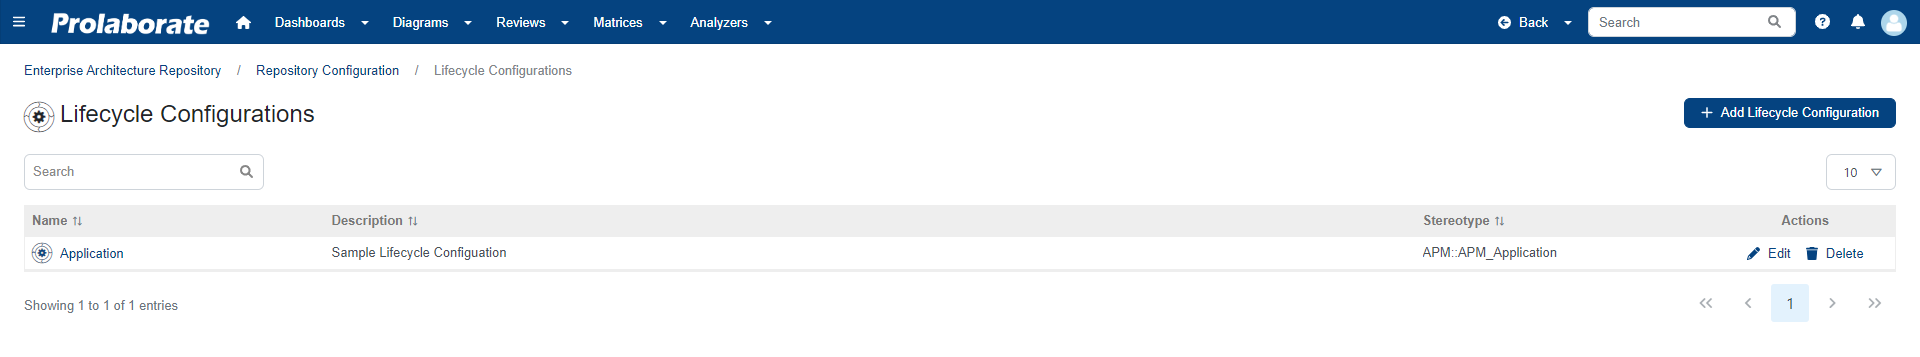
Once saved, the created lifecycle configuration will be listed with its name, description and the stereotype in fully qualified name.
Users can search for a configuration and edit and delete the existing configurations if required.
Note:
- If the existing lifecycle configuration is modified after creating a lifecycle roadmap, then the user must manually edit and save the chart to reflect the changes.
How to delete Lifecycle Configuration?
To delete a lifecycle configuration, navigate to Lifecycle Configuration listing page.
Click Delete under Actions.
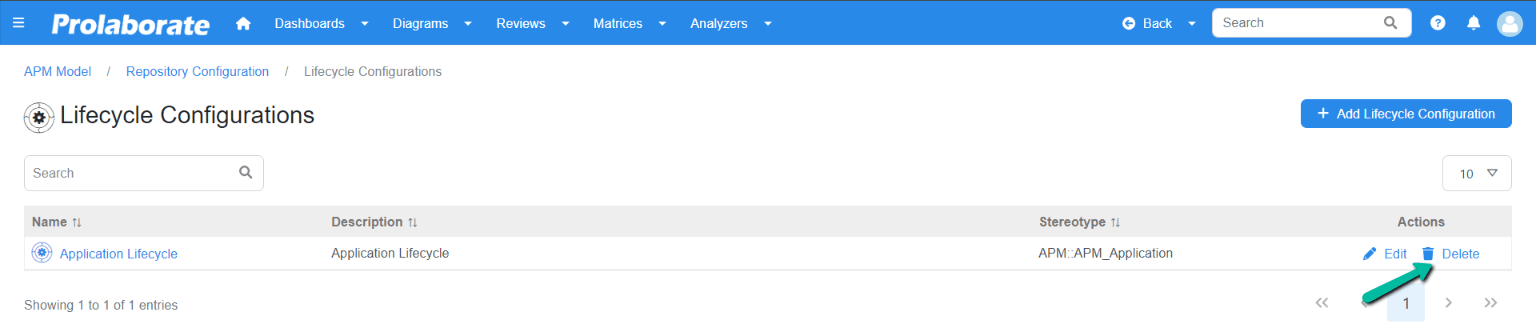
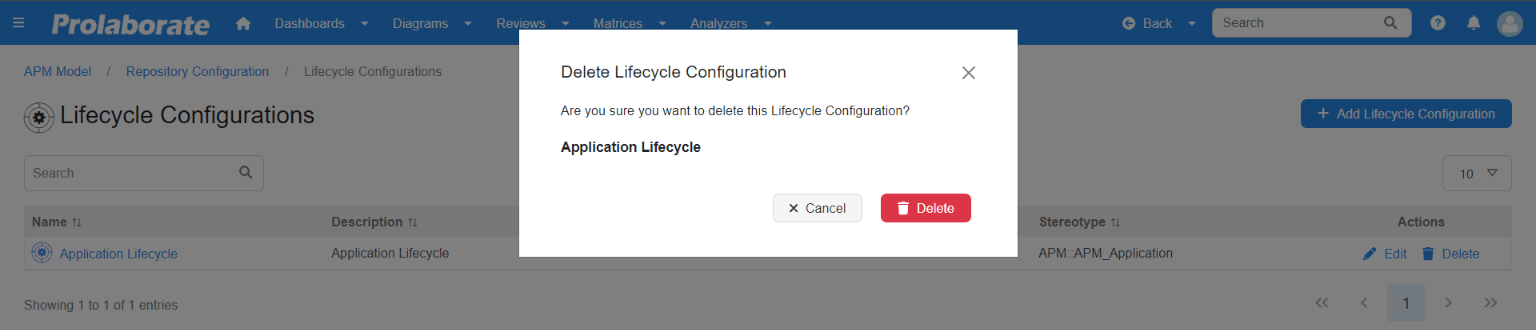
A popup window will appear to confirm the deletion. Click Delete to delete the lifecycle configuration.
Note:
- If a lifecycle configuration is referred to a lifecycle roadmap chart, then that configuration cannot be deleted.
Modify dates of lifecycle states using Property Window
Once the lifecycle configuration is created for a stereotype, users can view and modify the dates of lifecycle states via the properties window of the stereotype.
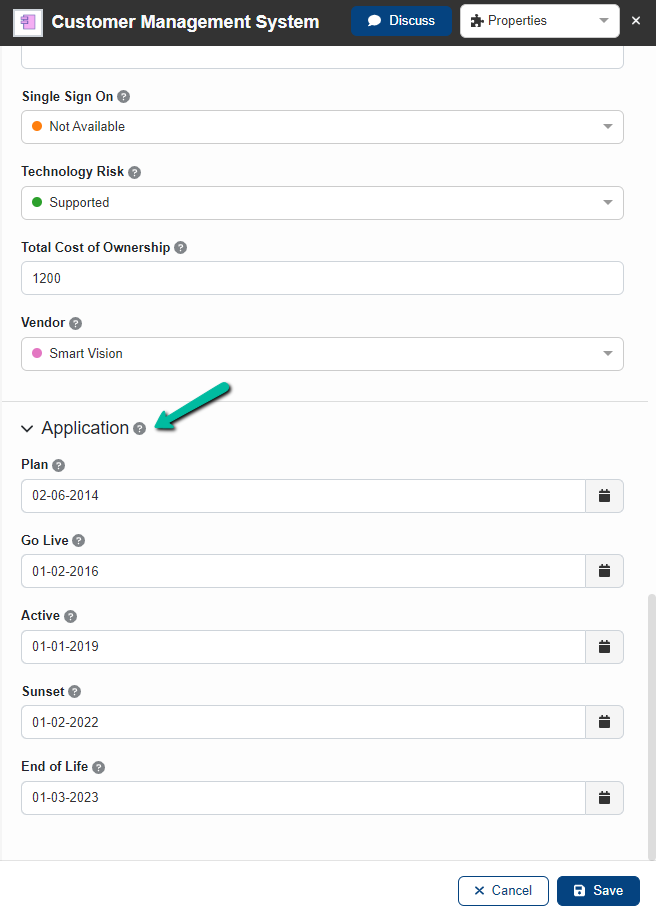
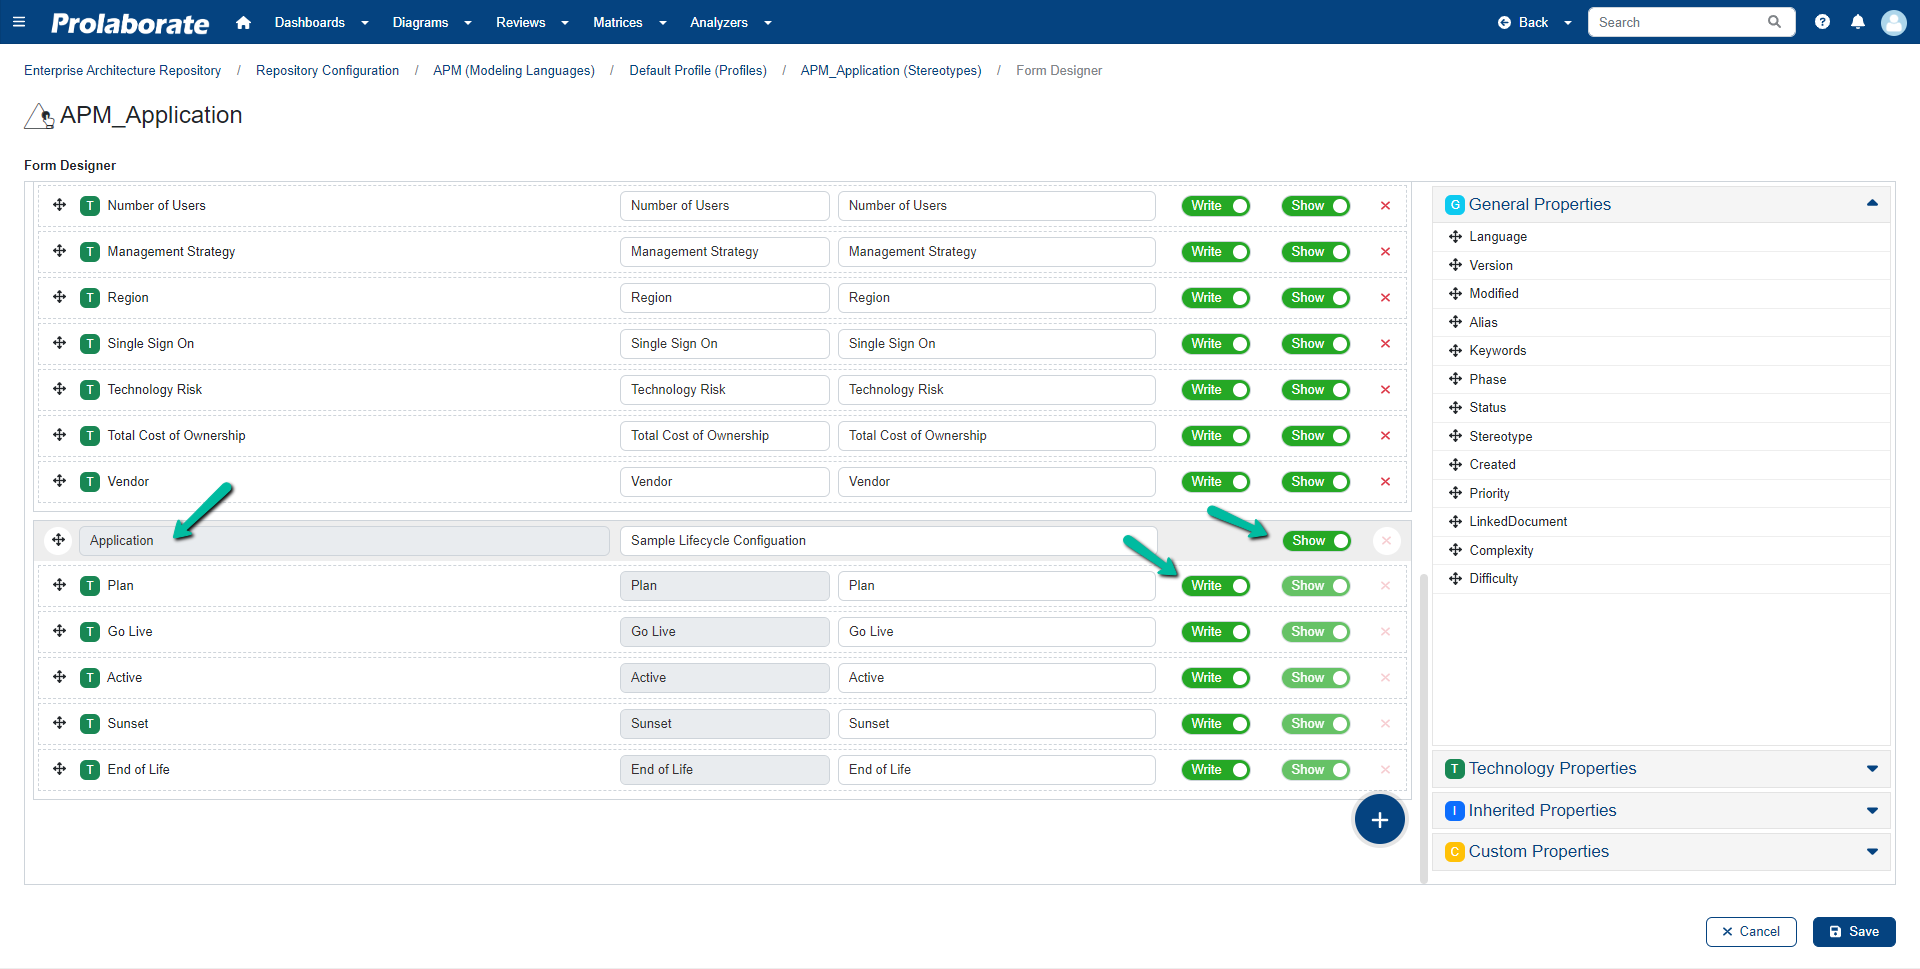
Users can Show/Hide the group and set Read/Write permissions for the individual state if required.
Note:
- Upon creating a lifecycle configuration, the properties group is applied to all the existing profiles present in the Modeling Language
- The properties group is automatically added upon creating a new Modeling Language profile
- The properties group and its properties cannot be removed from the Form Designer
- Individual Show/Hide option is disabled
Define Conditions to filter data in Roadmap
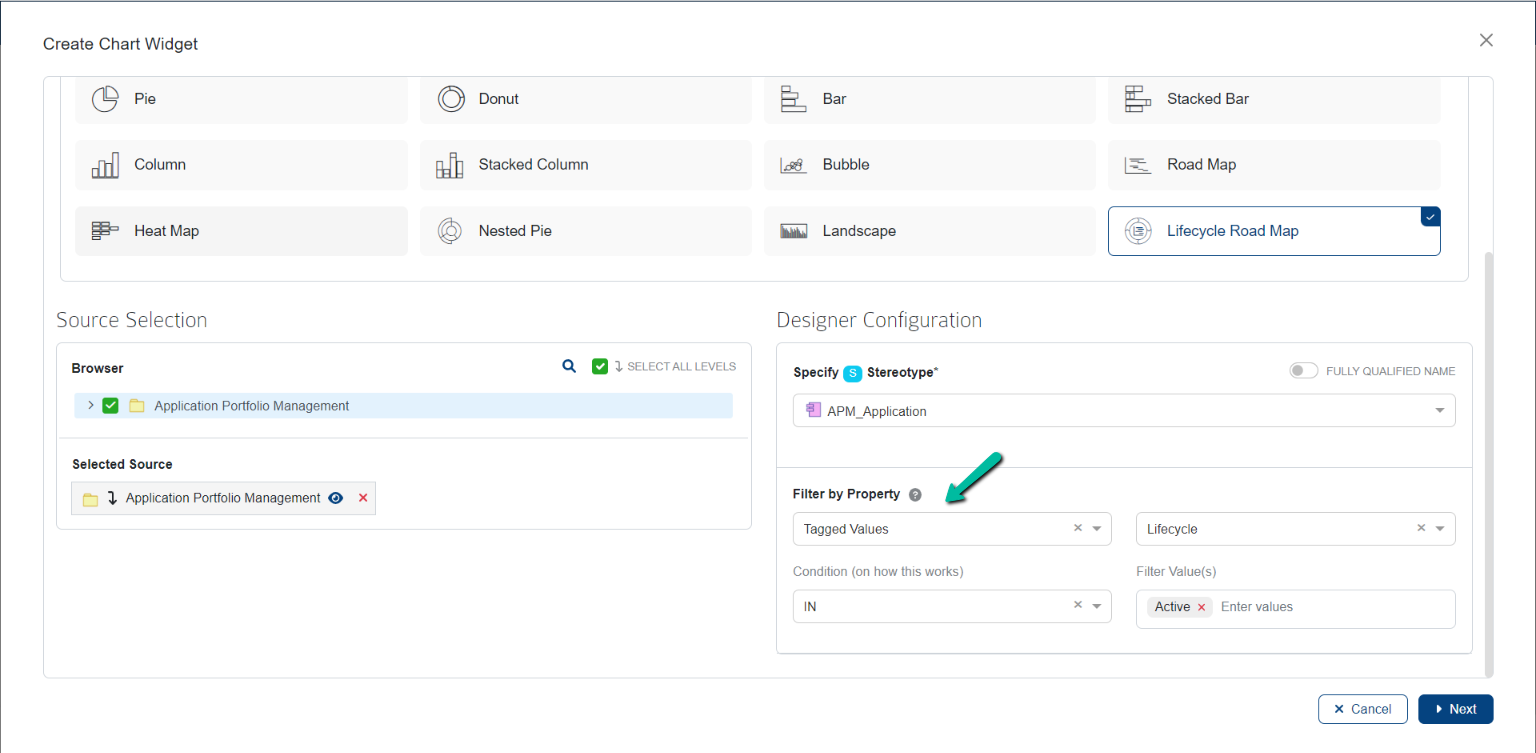
Users can further filter the information displayed in the lifecycle configuration based on tagged values or basic properties by Filter By Property in designer configuration (source selection page).
Condition (on how this works):
User can filter based on the conditions like IN, NOT IN from the tagged value and Basic Properties
Filter values:
Based on the above Tagged value or Basic Property, user can filter in detail by using the values from the Tagged value or basic property
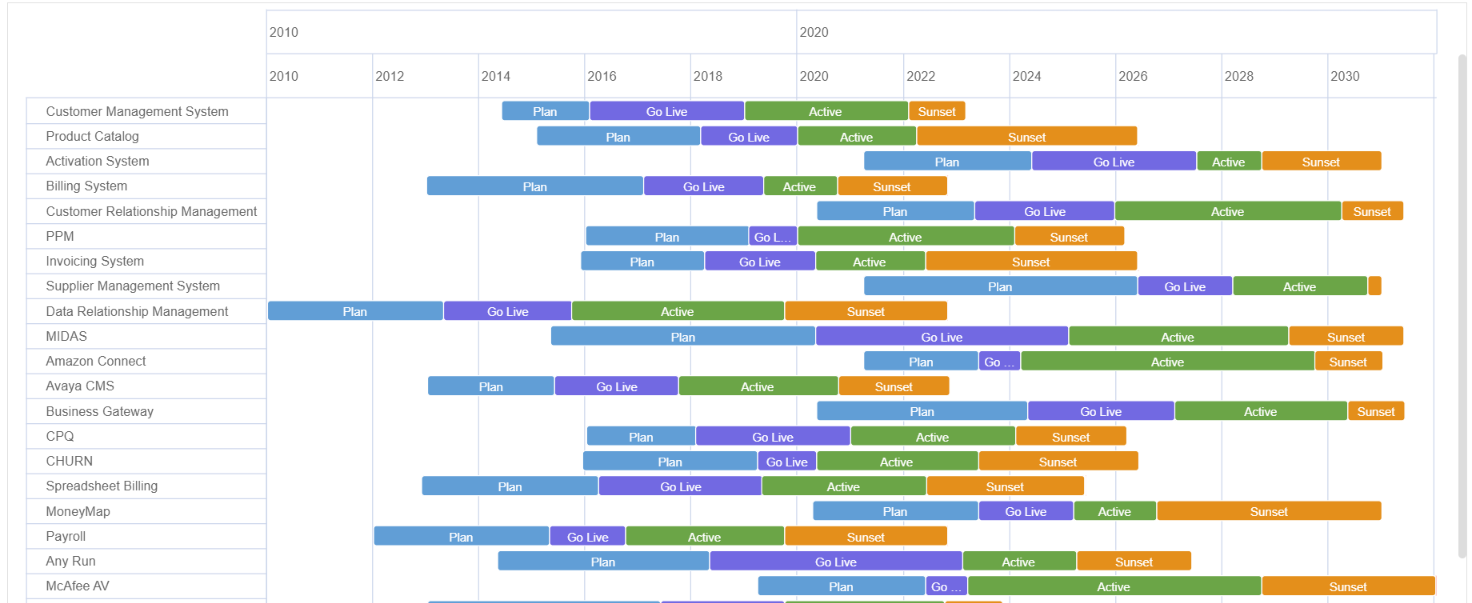
After configuring and saving the chart, the final output of the chart will display only the filtered elements as shown in the image below.
Customize Lifecycle Roadmap Chart
Users can change or configure the style and aesthetics of the chart and preview it on the ‘Customize Chart’ page.
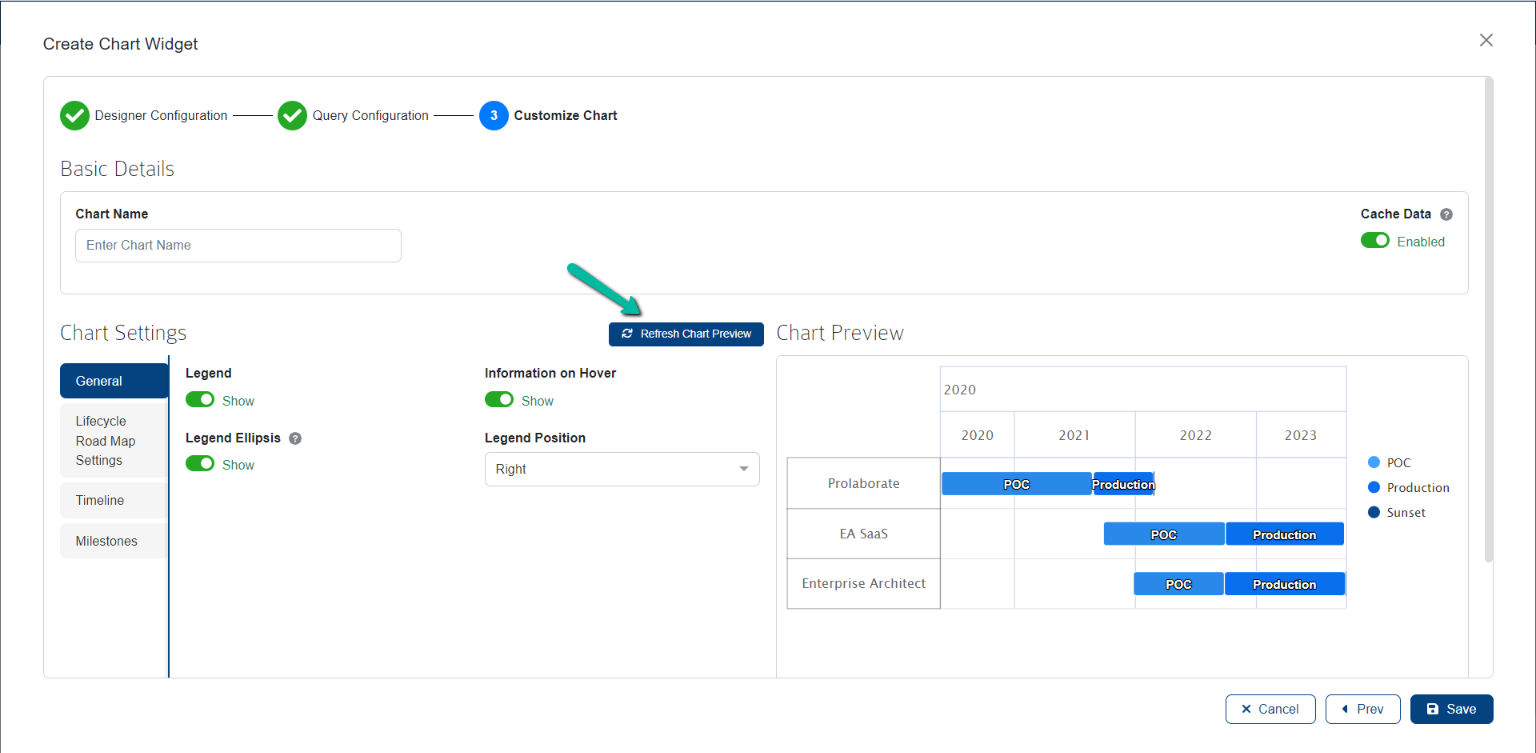
Chart Preview: This section will show a preview of the chart after the changes have been applied to it.
Refresh Chart Preview: This feature allows you to see a preview of the changes made in the chart settings on the current page.
General Settings
Modify the options related to the legend in this section.
| Field | Description |
|---|---|
| Legend | Toggling this option will allow the users to show or hide the legend in the chart |
| Legend Ellipsis | Long Legend will be displayed only to the extent permitted. Enabling this feature allows the user to see the entire legend when one hovers over it |
| Legend Position | Allows users to position the legends on right top or bottom |
| Information on Hover | Enabling this option will display the information when hovering over the artifact |

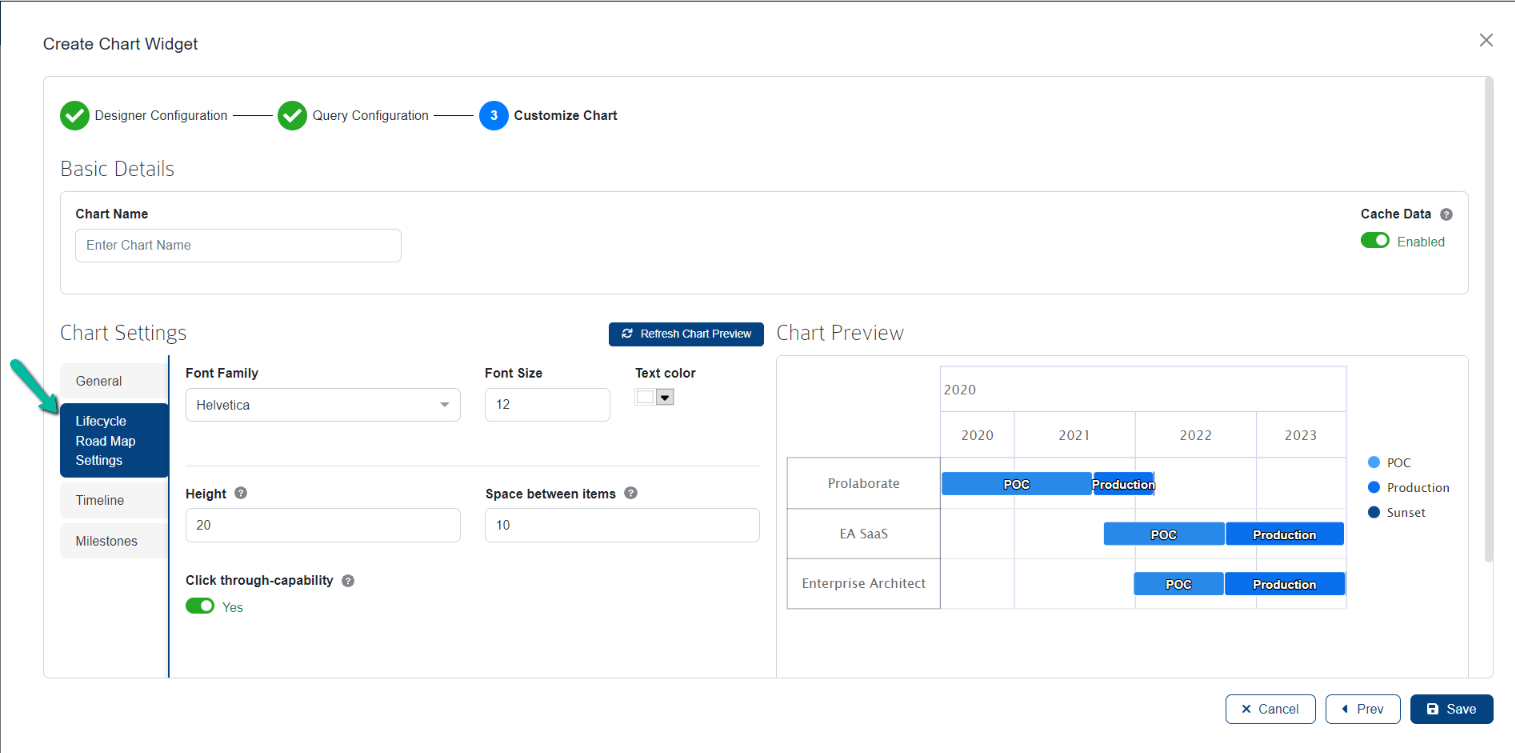
Lifecycle Roadmap Settings
Lifecycle Roadmap settings allow you to change the height, space between items, font type, font size, font color etc. Under Chart Settings, you can select Lifecycle Roadmap Settings
| Field | Description |
|---|---|
| Font Family | Select the font to be applied for the chart’s text and numbers. Select the desired font for the text and numbers by clicking the dropdown |
| Font Size | Specify the font size that will be used for the chart’s text and numbers. Select the desired font size for the text and numbers by clicking the dropdown. |
| Text Color | Select the font color that will be used for the chart’s text and numbers. Click the dropdown and select a color from the color palette to apply to the text and numbers. |
| Height | By changing the value in this field, users can customize the Height of the bar |
| Space between Items | By changing the value in this field users can adjust the space between two items |
| Click through-capability | If enabled, clicking on a roadmap item opens the properties window |
Define Timeline
Timeline lets you manage start date and end date, and their date formats, position etc.
| Field | Description |
|---|---|
| Timeline | Toggle this option to show/hide the dates in the chart |
| Start date | Choose required start date to show case your items in roadmap |
| End date | Choose required end date to show case your items in roadmap |
| Display Date format | Choose required date format to be displayed in the chart |
| Position | Specify the position of the date in the chart |
| Seperators | Toggle this option to show/hide separators in the chart |
| Width | By changing the value from this field, users can increase the thickness of the separator line |
| Color | Specify the color to be applied to the separator line |

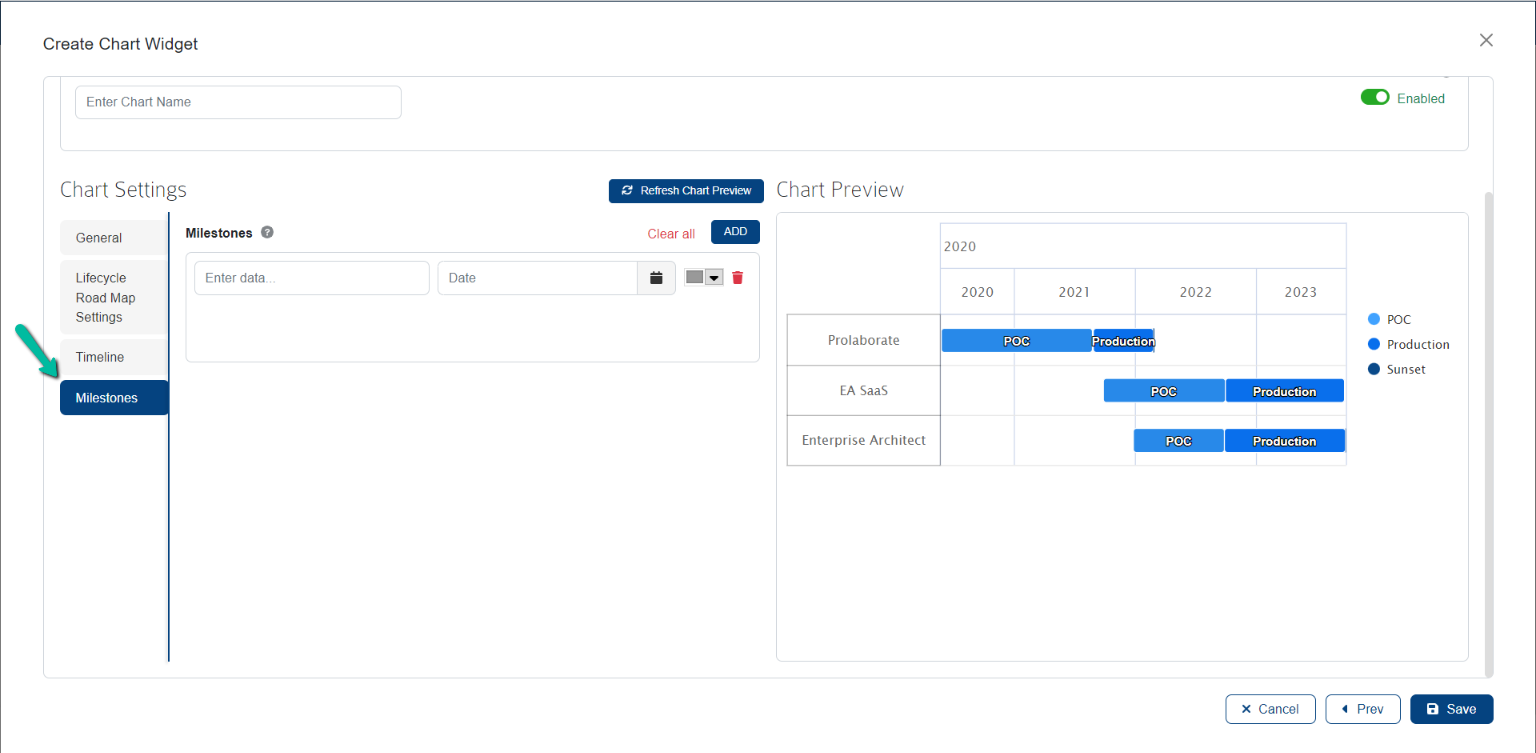
Add Milestone
Milestone lets you highlight a specific event. Under this section, create milestones, for the Roadmap with Label and specific date and color. Click Save to save all the configurations.