
Dynamic Charts – One Chart Multiple Reports
Dynamic Charts
Over the years, we have observed that our customers rely heavily on charts to visualize data. Furthermore, we have noticed that many users create multiple charts for the same object and each chart displays different data points.
Dynamic Charts will reduce such redundant efforts and will offer more intuitive reports for users to analyze information based on various attributes. Users can pick the data they would like to see on the go. This enhancement allows for greater flexibility and efficiency in data representation.
Dynamic Charts can be enabled in the following chart types:
- Pie
- Donut
- Bar (Regular and Stacked)
- Column (Regular and Stacked)
- Landscape charts representing multi-level hierarchical information
Prerequisites for a dynamic chart
- Prolaborate version should be 5.0 and above.
- The user must have access to the EA repository in Prolaborate.
- To create charts, the user must be part of a user group which has administrative access to dashboard provided by the admin.
- Make sure the chart is configured using designer and not more than one stereotype is selected in ‘Specify Stereotype’ field.
- Modeling Language should be uploaded in Prolaborate.
Add a dynamic chart to dashboard
To create a dynamic chart in a dashboard, follow the below steps
Step 1: Create a Dashboard
The first step is to create a dashboard which incorporates the charts as a widget. A new dashboard can be created by choosing Create from the dropdown in the header menu.
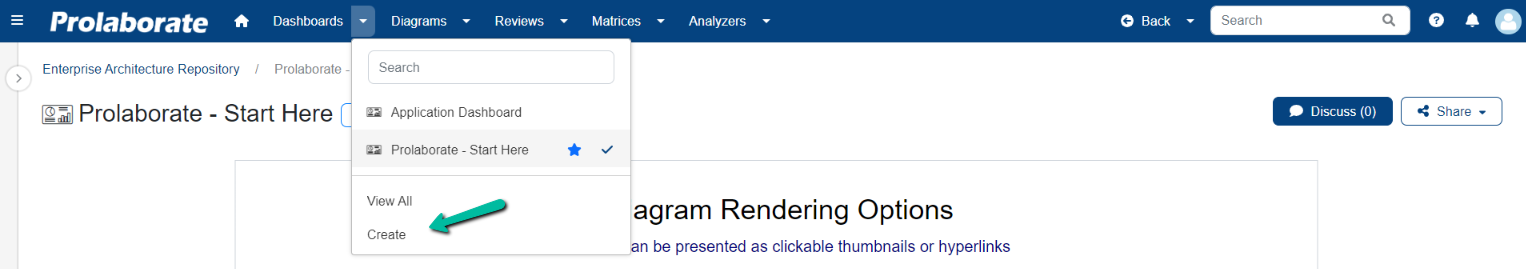


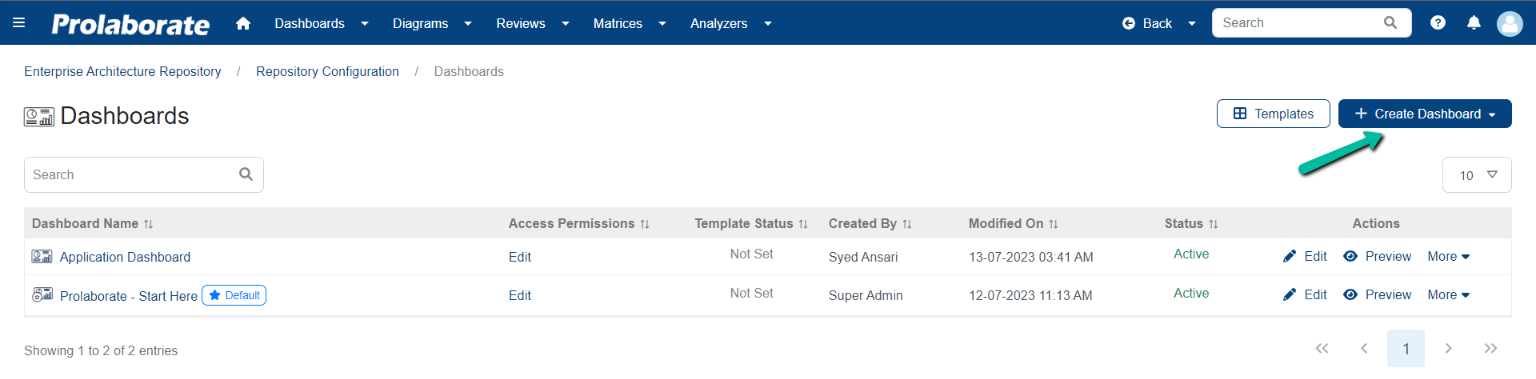
Users can also select View all to navigate to the ‘Dashboards’ page and choose Create Dashboard.
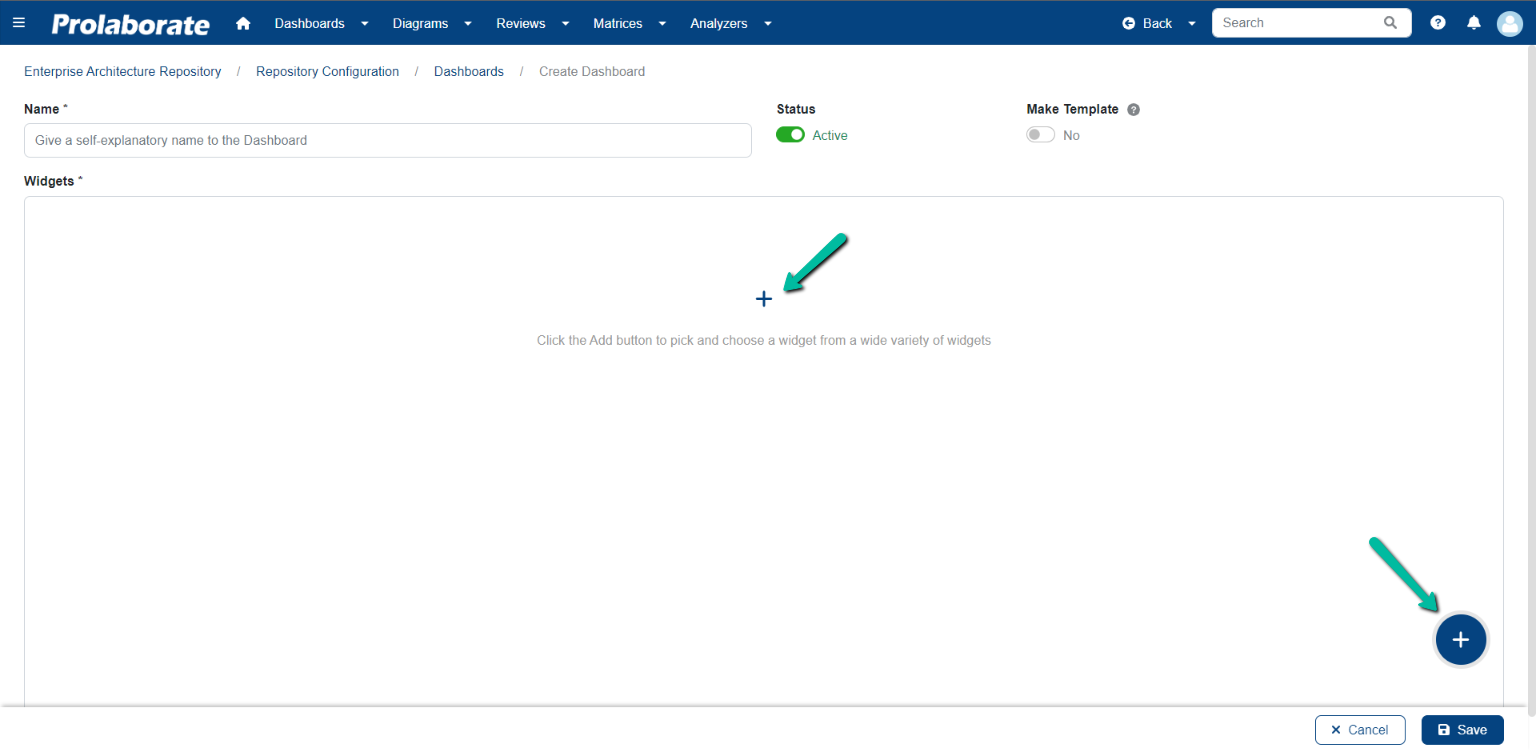
Step 2: Add New Widget
To add a widget, click Add Widget Button > Add New by choosing any one of the options shown below.
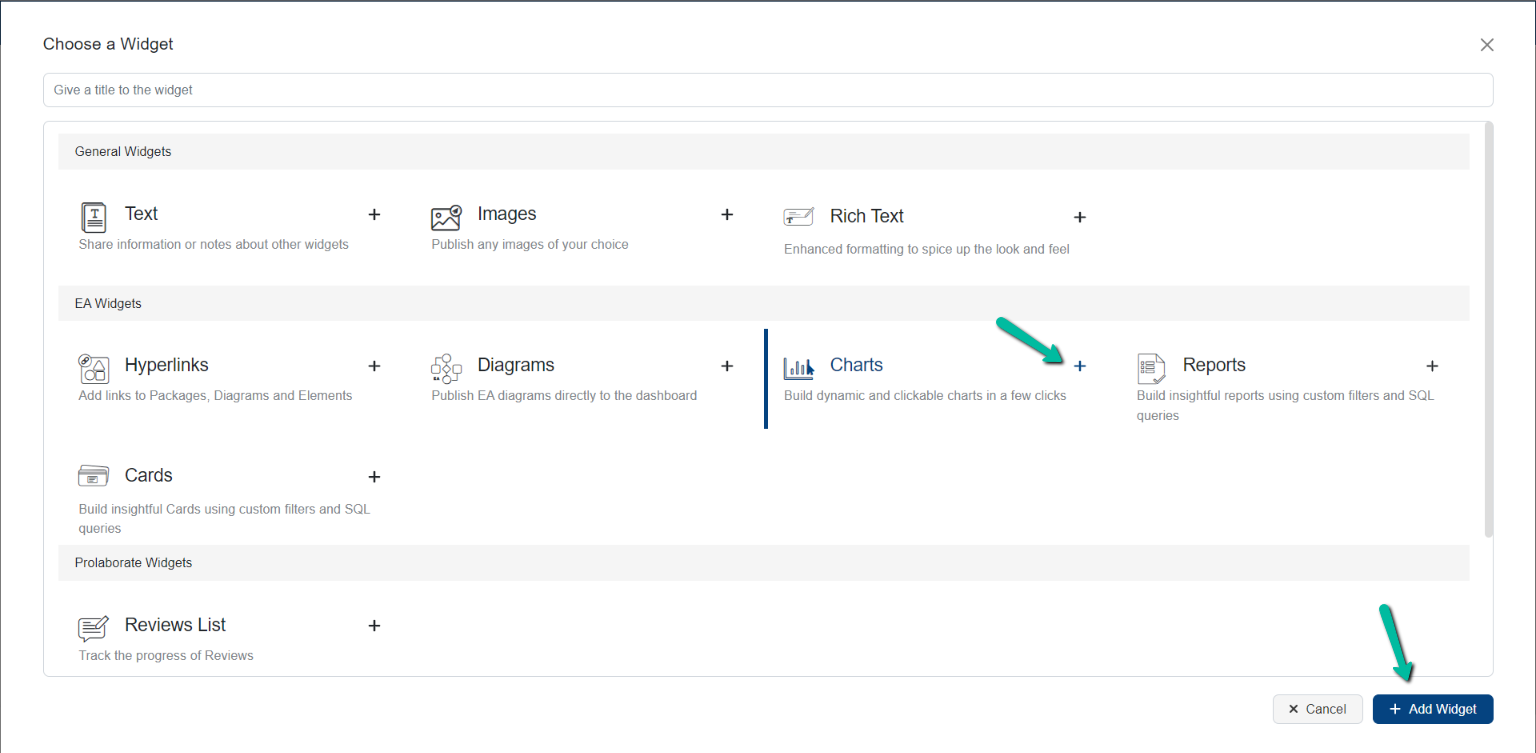
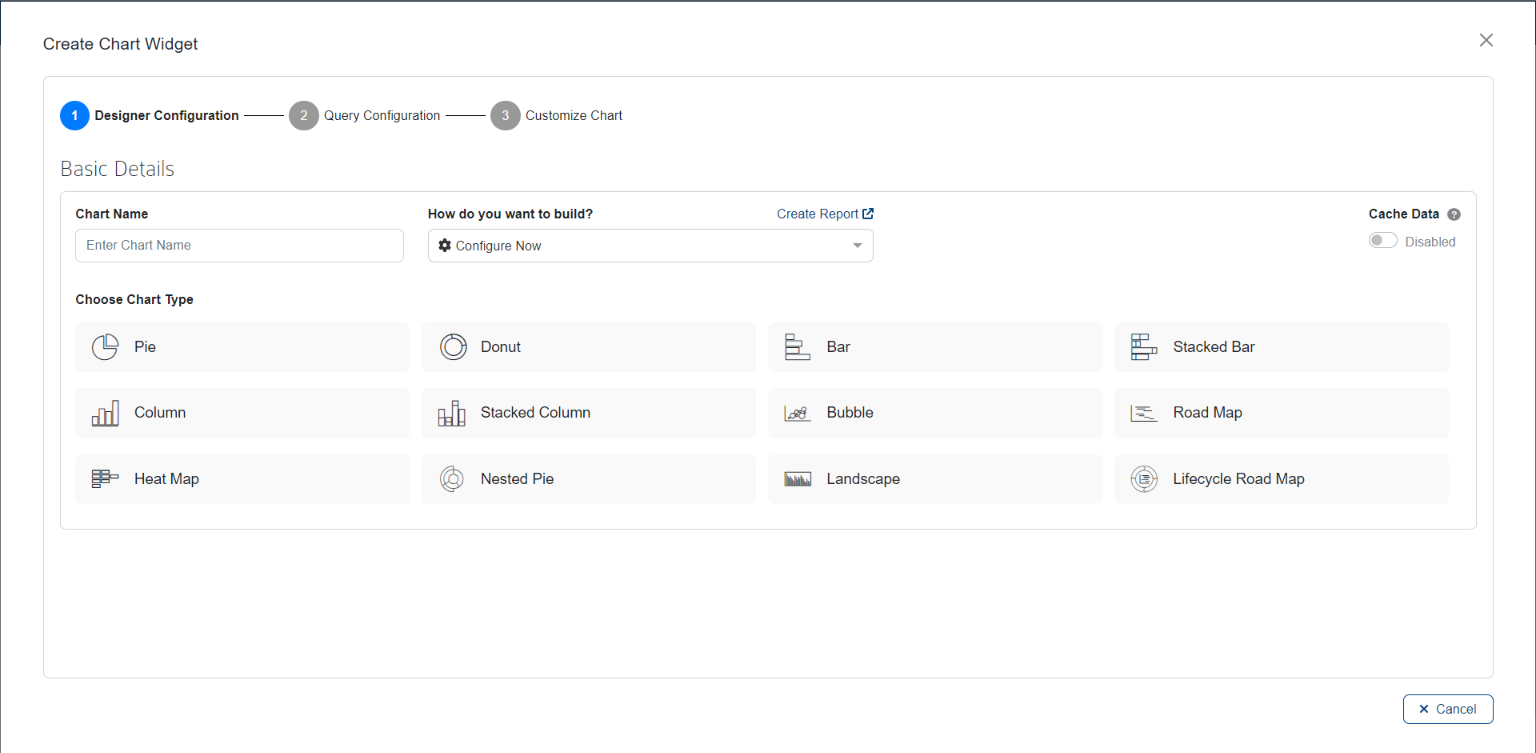
In Choose a Widget page, choose Charts under EA widgets and click Add Widget.
Choose Chart Type
Choose a required chart type and proceed with the configuration.


Hierarchical Charts

Note:
- Dynamic Chart works only for above shown types.
Configure a Dynamic Pie Chart
Note:
- The dynamic chart is enabled based on a specific configuration so please make sure the chart is configured using designer and not more than one stereotype is selected in ‘Specify Stereotype’ field.
Click here to read the complete prerequisite.
Click here to know how to add a chart.
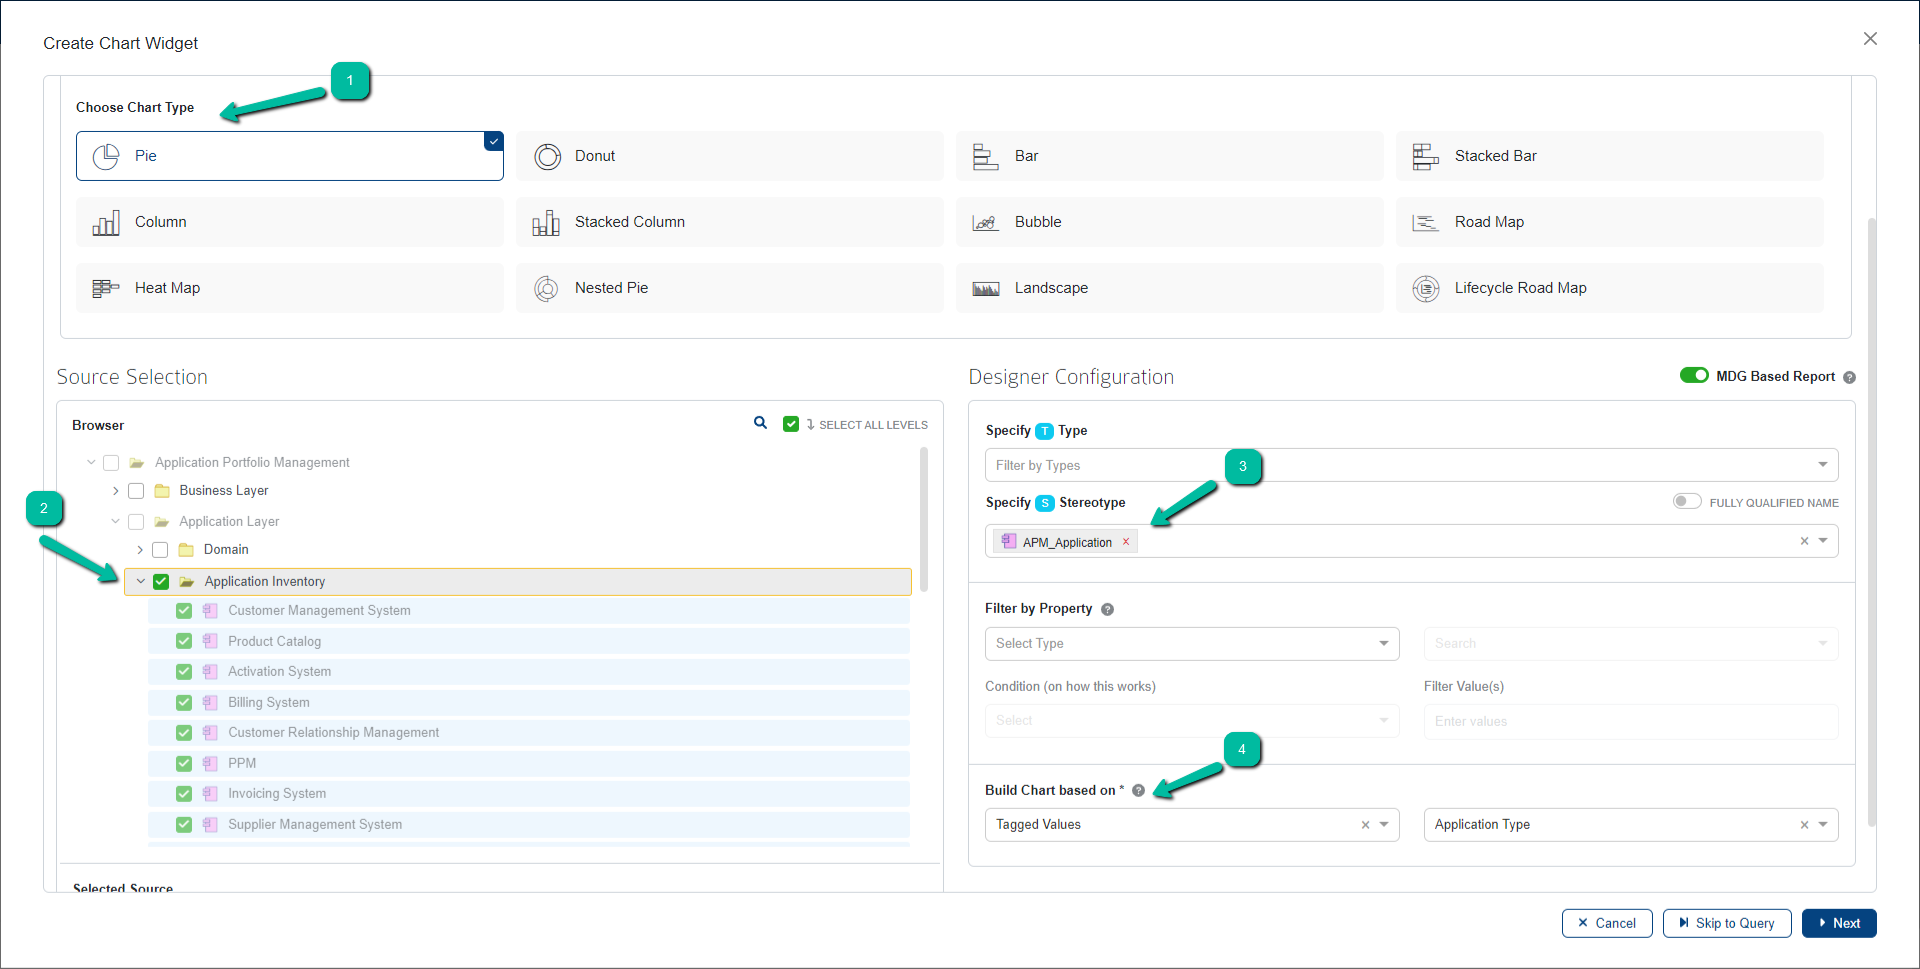
To create a dynamic Pie chart,
- User must select the chart type as Pie
- Select the Source
- Select a Stereotype
- Select a tagged value/property to build the chart
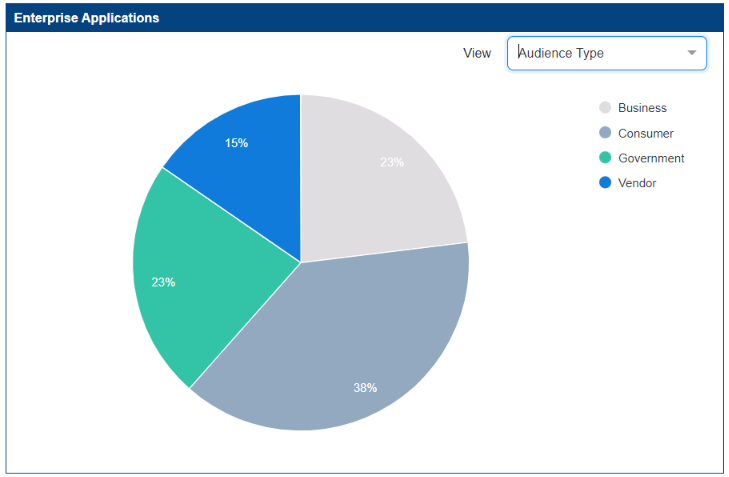
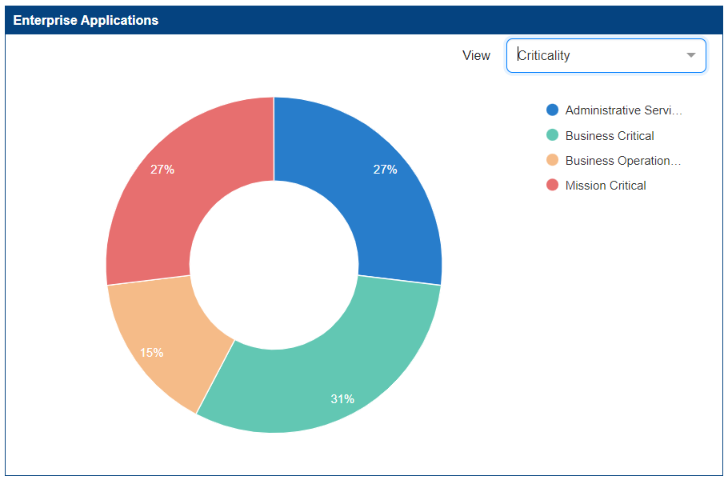
Save the chart and open the dashboard to view it. A dropdown field will be displayed with the property selected in Build Chart Based On when configuring the chart.
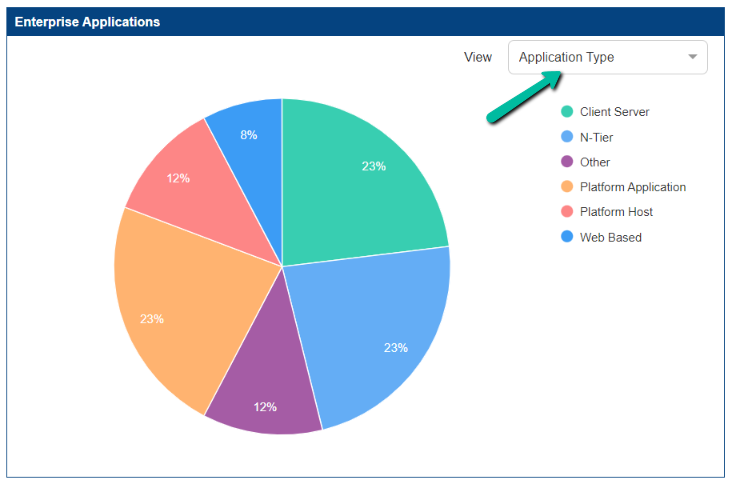
Clicking the dropdown lists all the basic properties (Name, Author, etc.,) and tagged values configured for the stereotype in the Form Designer.
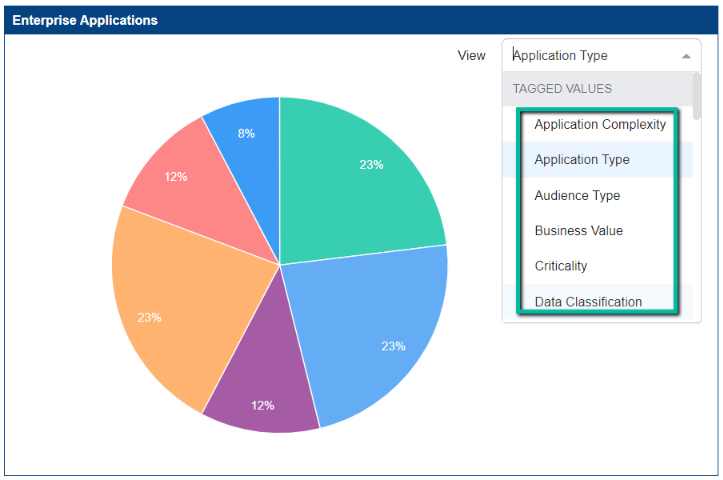
Choose the required property to change the chart output.
To know more on how to create a usual Pie Chart,Click here
Configure a Dynamic Donut Chart
Note:
- The dynamic chart is enabled based on a specific configuration so please make sure the chart is configured using designer and not more than one stereotype is selected in ‘Specify Stereotype’ field.
Click here to read the complete prerequisite.
Click here to know how to add a chart.
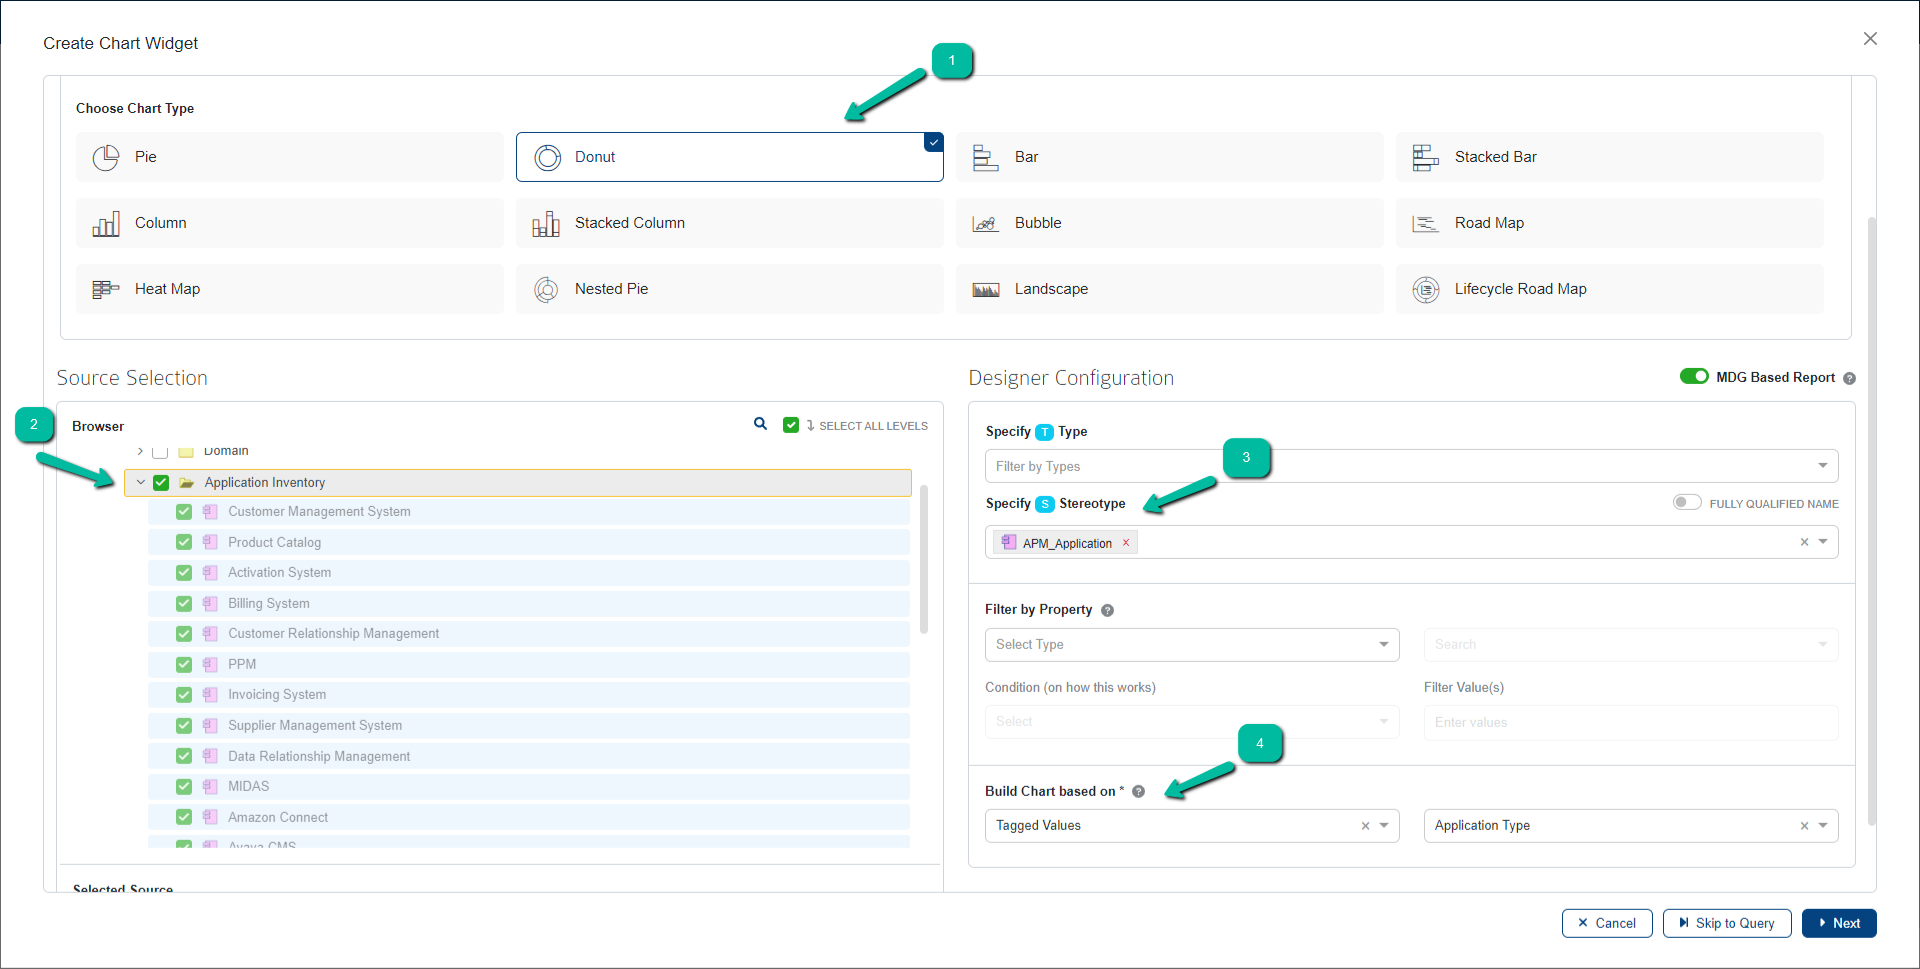
To create a dynamic Donut chart,
- User must select the chart type as Donut
- Select the Source
- Select a Stereotype
- Select a tagged value/property to build the chart
Save the chart and open the dashboard to view it. A dropdown field will be displayed with the property selected in Build Chart Based On when configuring the chart.
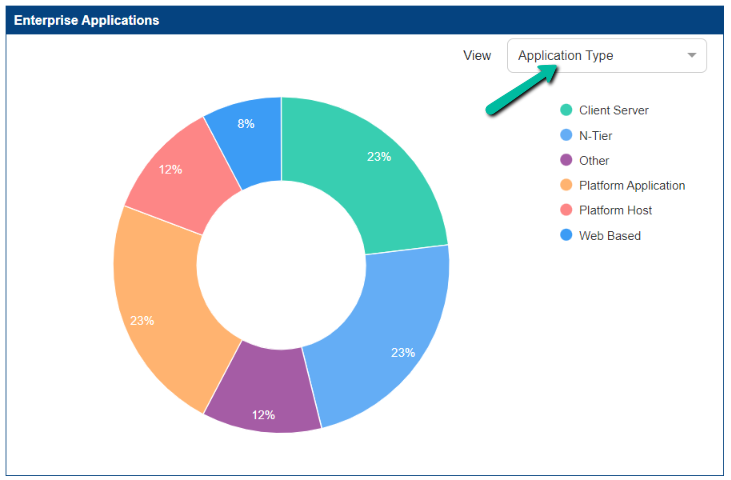
Clicking the dropdown lists all the basic properties (Name, Author, etc.,) and tagged values configured for the stereotype in the Form Designer.
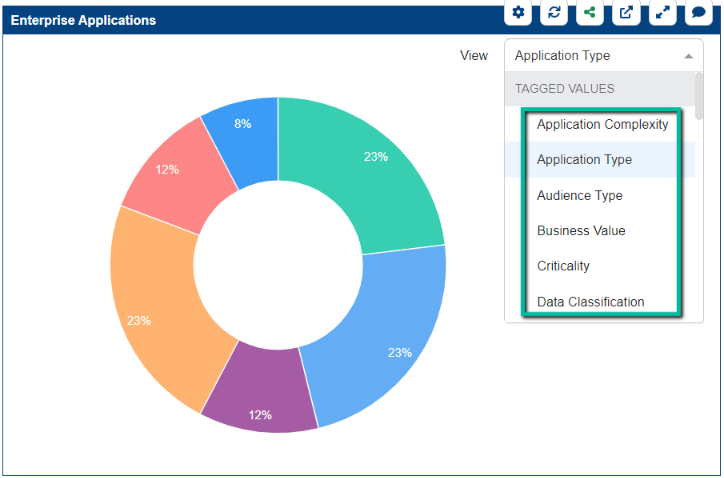
Choose the required property to change the chart output.
To know more on how to create a usual Donut Chart, Click here
Configure a Dynamic Bar Chart
Note:
- The dynamic chart is enabled based on a specific configuration so please make sure the chart is configured using designer and not more than one stereotype is selected in ‘Specify Stereotype’ field.
Click here to read the complete prerequisite.
Click here to know how to add a chart.
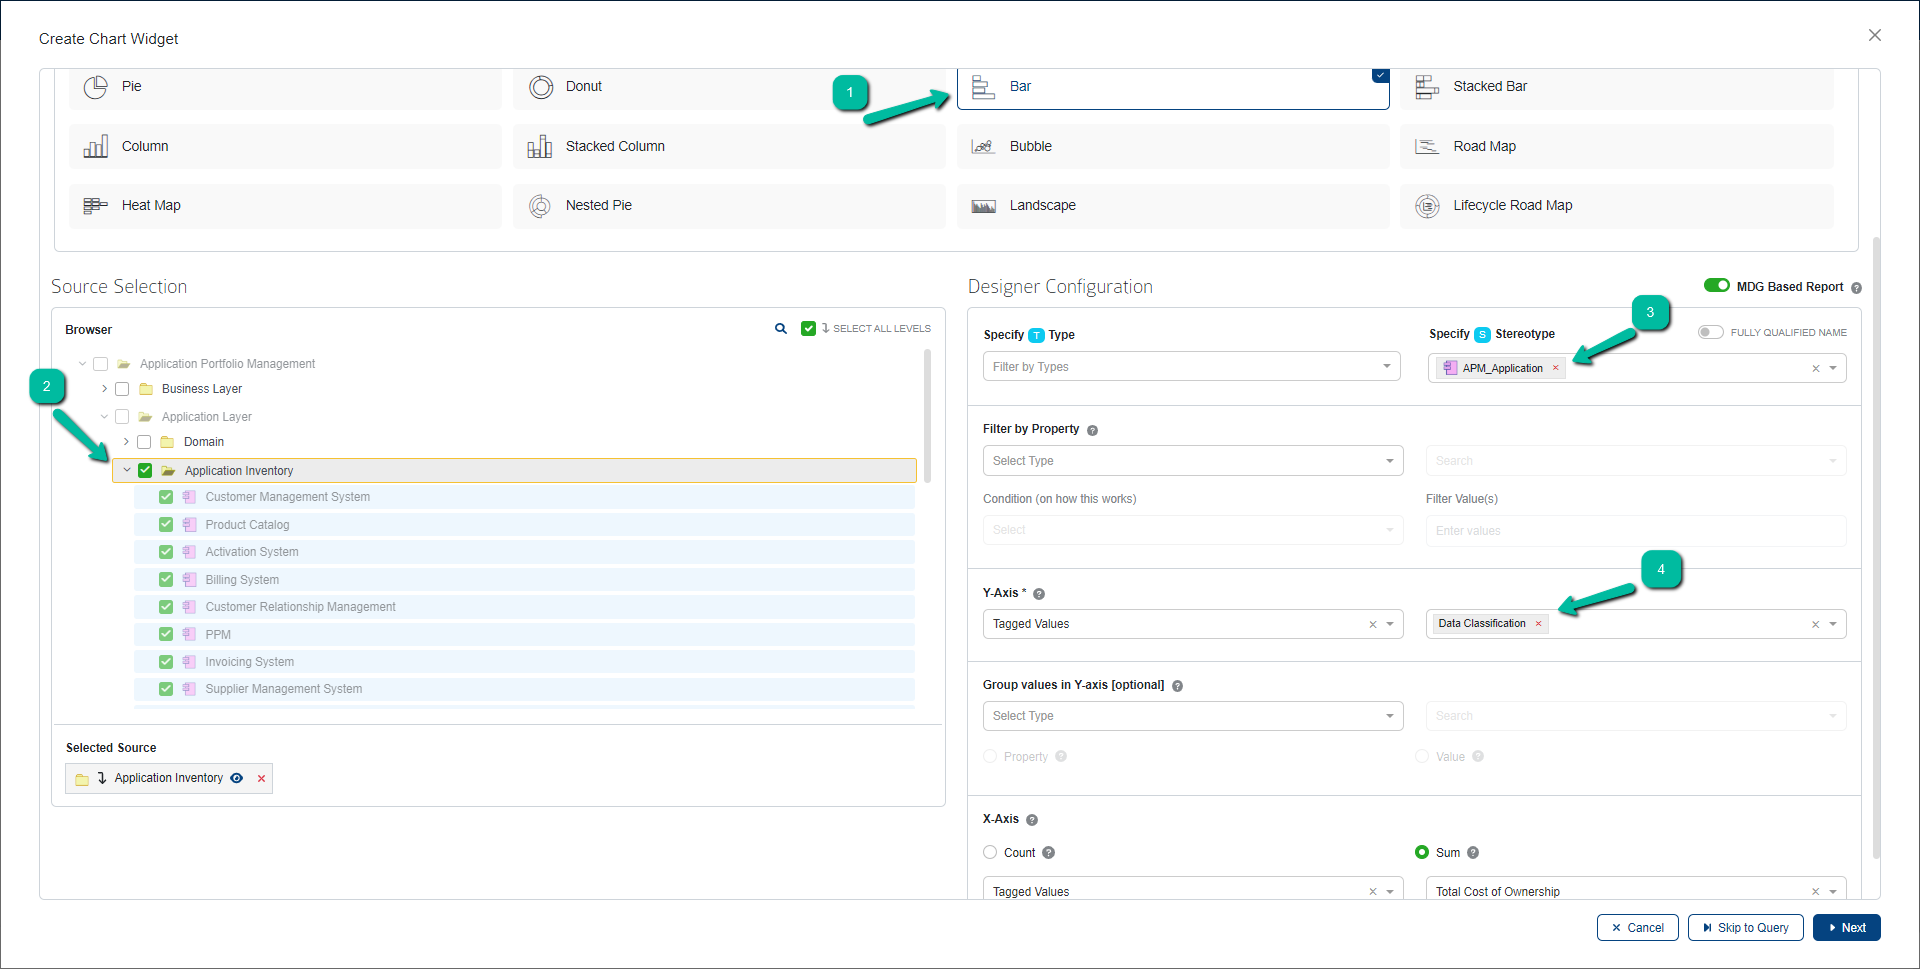
To create a dynamic Bar chart,
- User must select the chart type as Bar
- Select the Source
- Select a Stereotype
- Select a tagged value/property in Y-Axis to build the chart
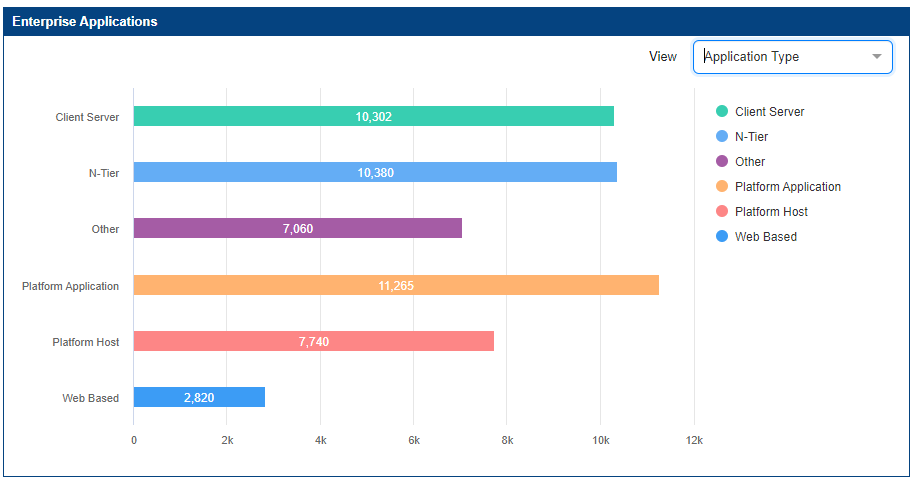
Save the chart and open the dashboard to view it. A dropdown field will be displayed with the property selected in Y-Axis when configuring the chart.
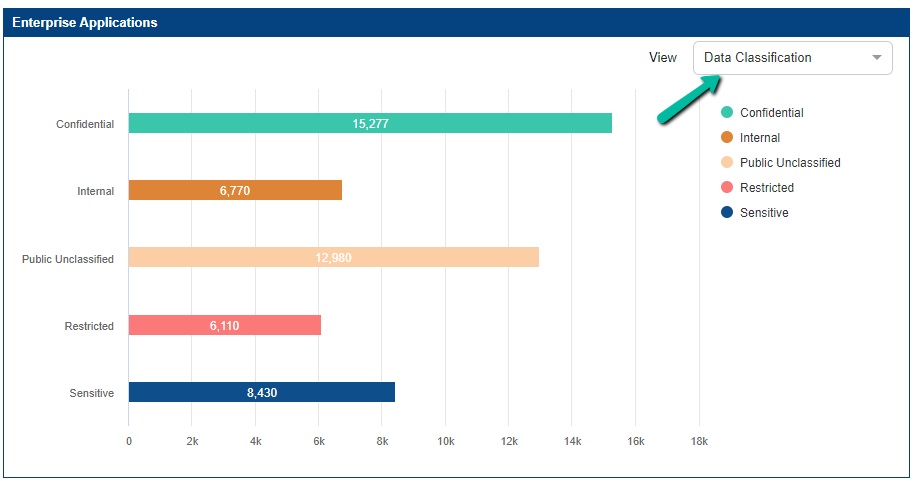
Clicking the dropdown lists all the basic properties (Name, Author, etc.,) and tagged values configured for the stereotype in the Form Designer.
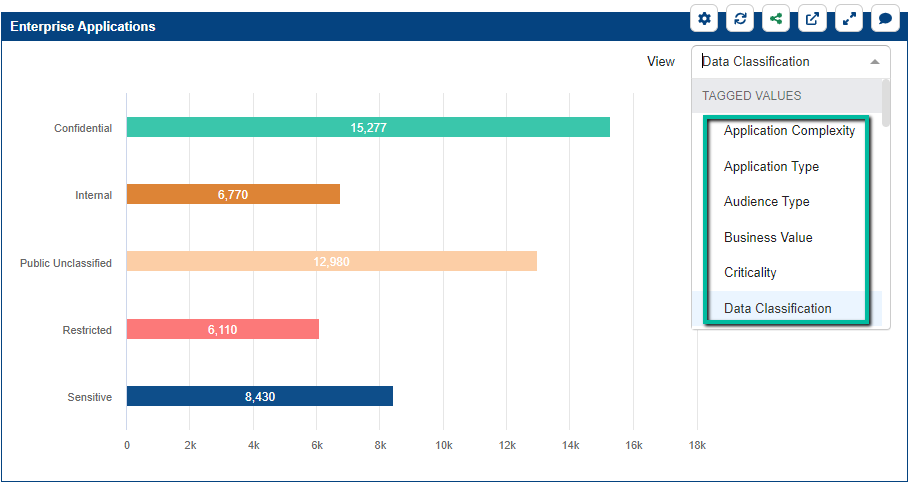
Choose the required property to change the chart output.
To know more on how to create a usual Bar Chart, Click here.
Configure a Dynamic Stacked Bar Chart
Note:
- The dynamic chart is enabled based on a specific configuration so please make sure the chart is configured using designer and not more than one stereotype is selected in ‘Specify Stereotype’ field.
Click here to read the complete prerequisite.
Click here to know how to add a chart.
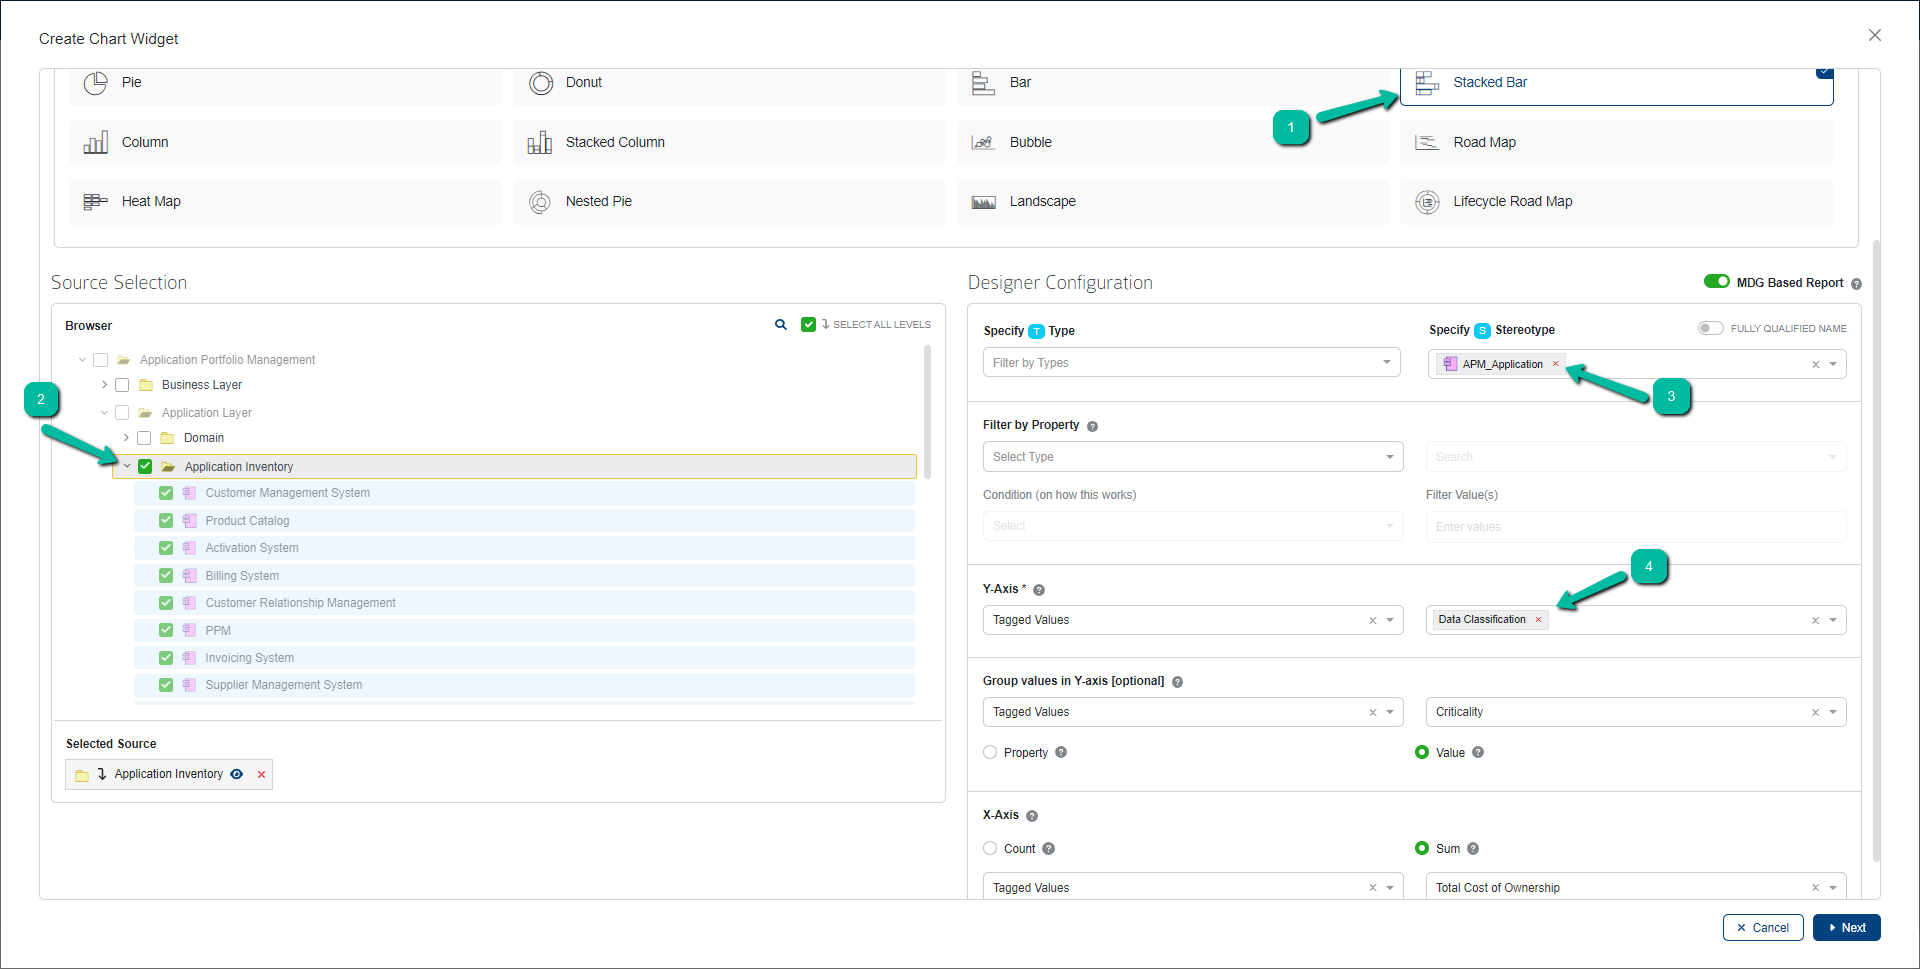
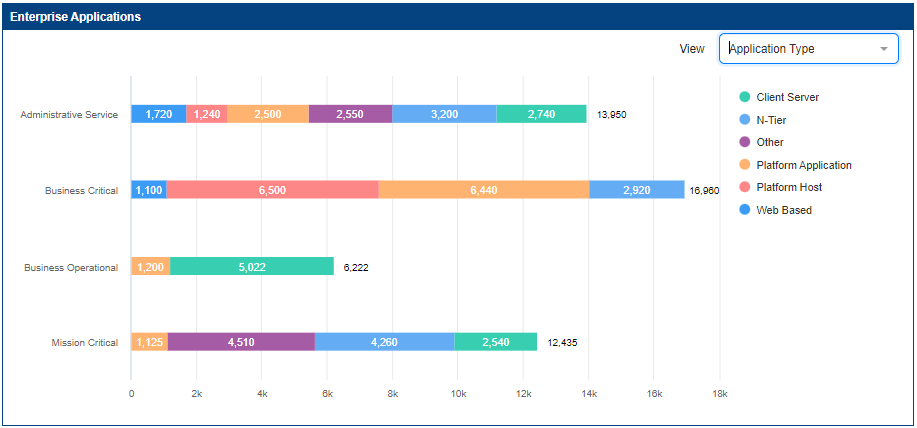
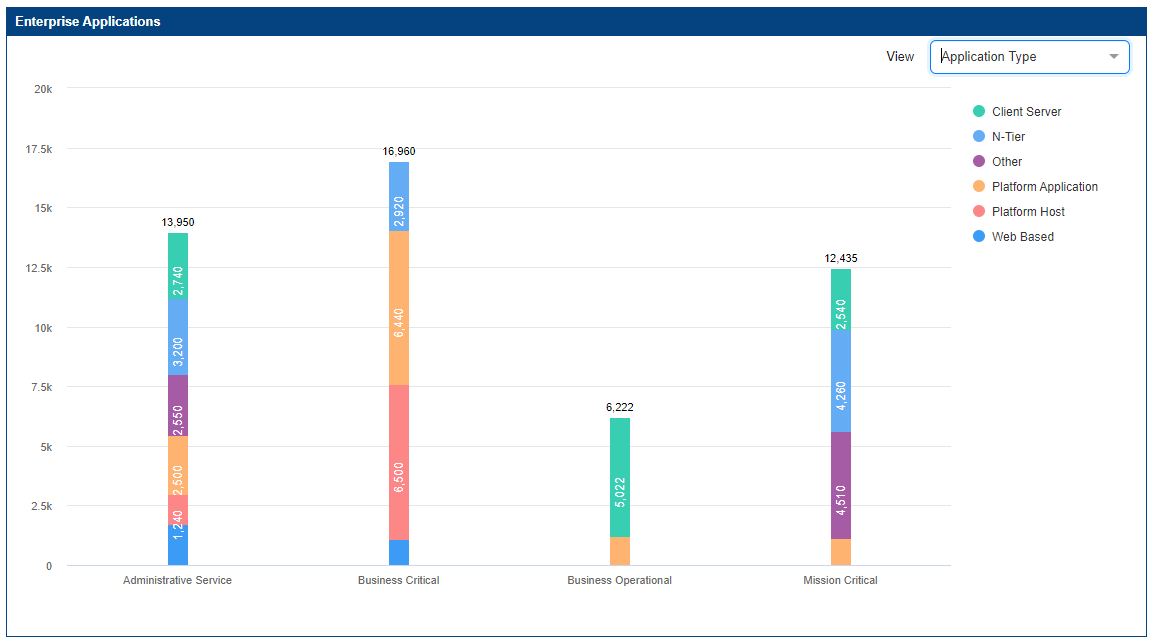
To create a dynamic Stacked Bar chart,
- User must select the chart type as Stacked Bar
- Select the Source
- Select a Stereotype
- Select a tagged value/property in Y-Axis to build the chart
Save the chart and open the dashboard to view it. A dropdown field will be displayed with the property selected in Y-Axis when configuring the chart.
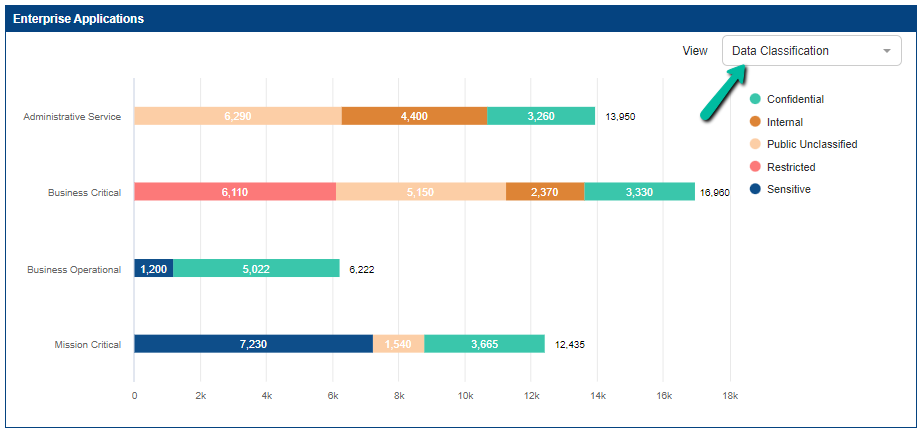
Clicking the dropdown lists all the basic properties (Name, Author, etc.,) and tagged values configured for the stereotype in the Form Designer.
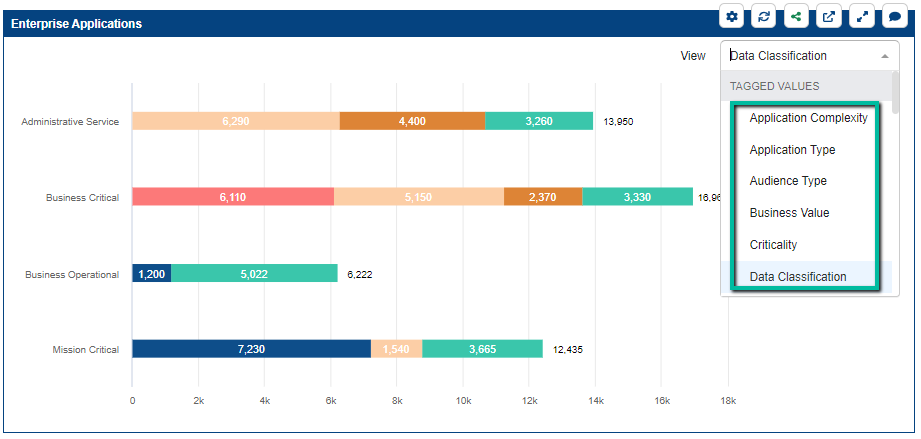
Choose the required property to change the chart output.
To know more on how to create a usual Stacked Bar Chart, Click here.
Configure a Dynamic Column Chart
Note:
- The dynamic chart is enabled based on a specific configuration so please make sure the chart is configured using designer and not more than one stereotype is selected in ‘Specify Stereotype’ field.
Click here to read the complete prerequisite.
Click here to know how to add a chart.
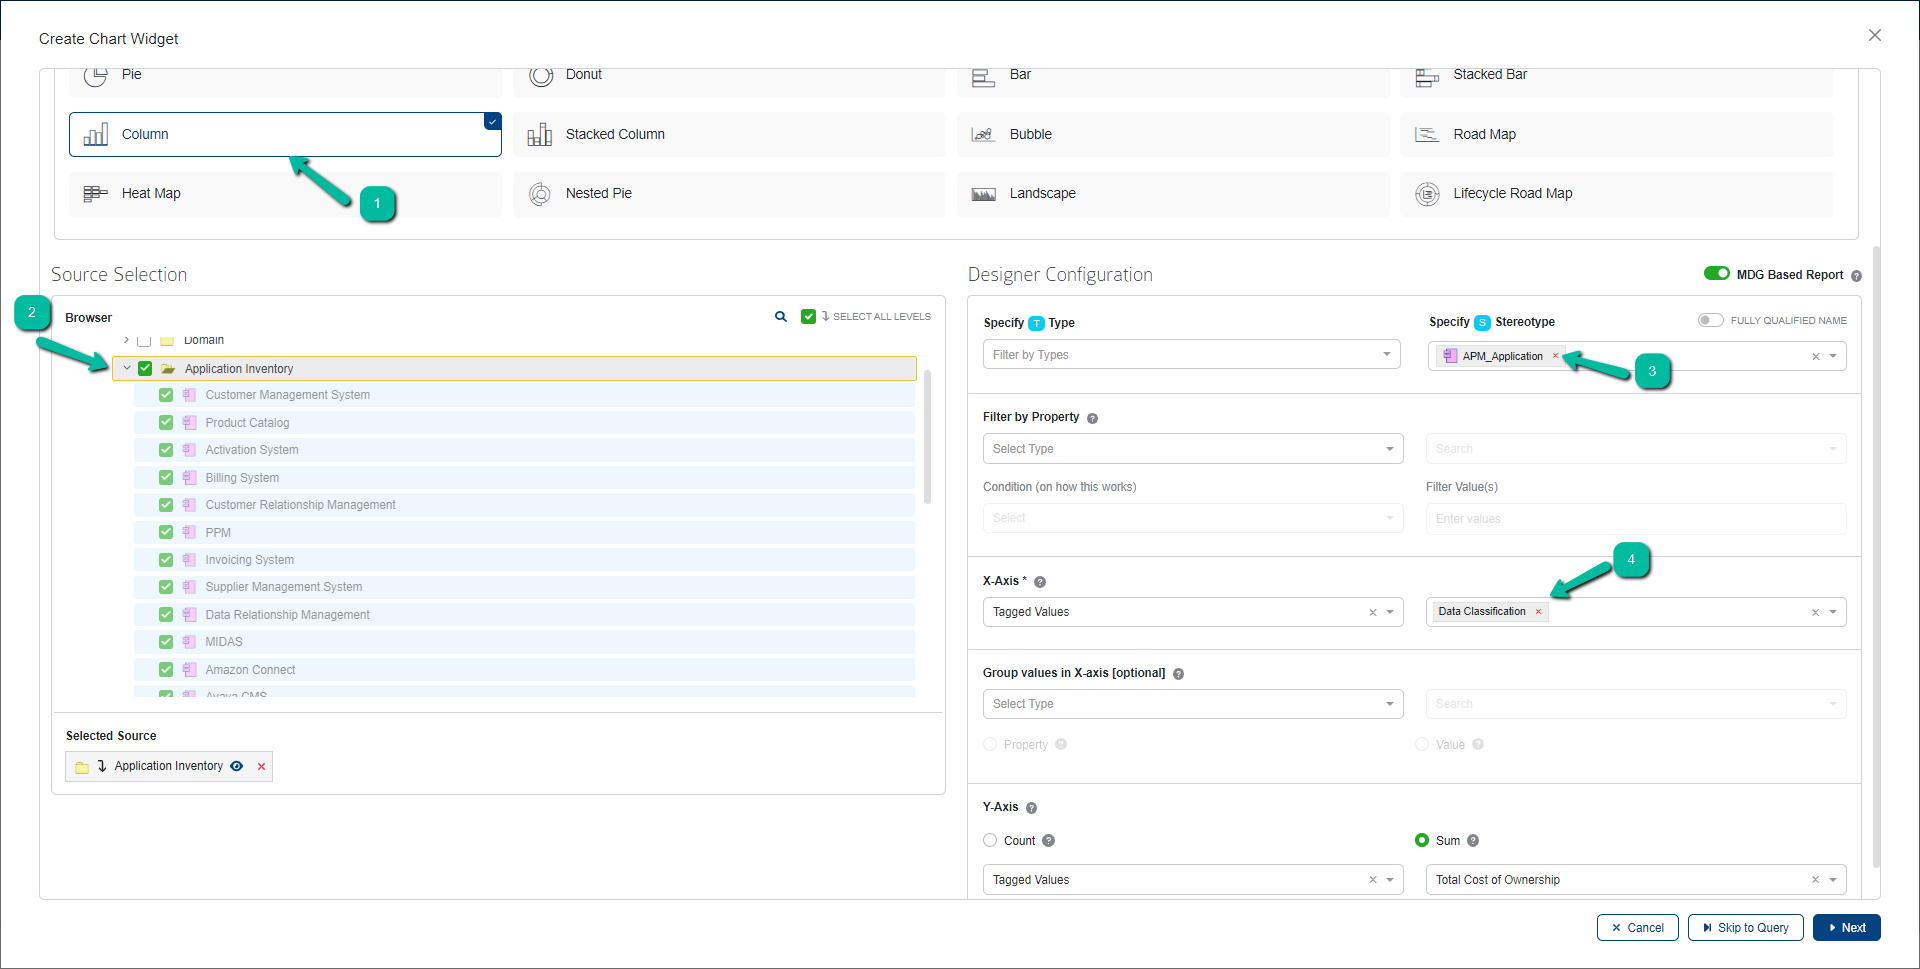
To create a dynamic Column chart,
- User must select the chart type as Column
- Select the Source
- Select a Stereotype
- Select a tagged value/property in X-Axis to build the chart
Save the chart and open the dashboard to view it. A dropdown field will be displayed with the property selected in X-Axis when configuring the chart.
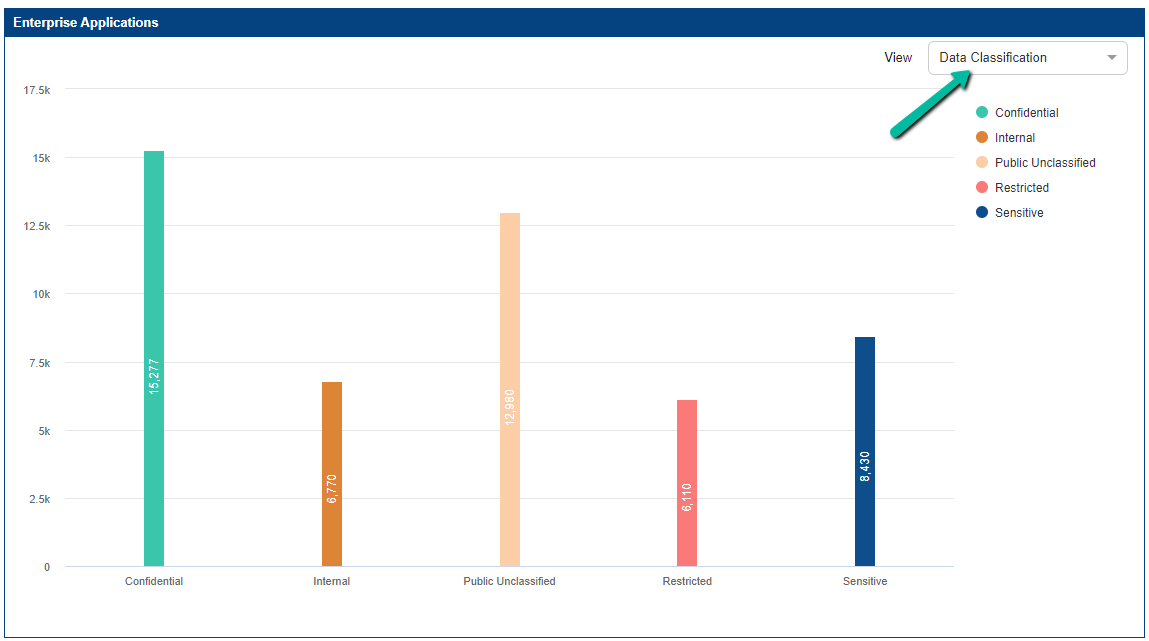
Clicking the dropdown lists all the basic properties (Name, Author, etc.,) and tagged values configured for the stereotype in the Form Designer.
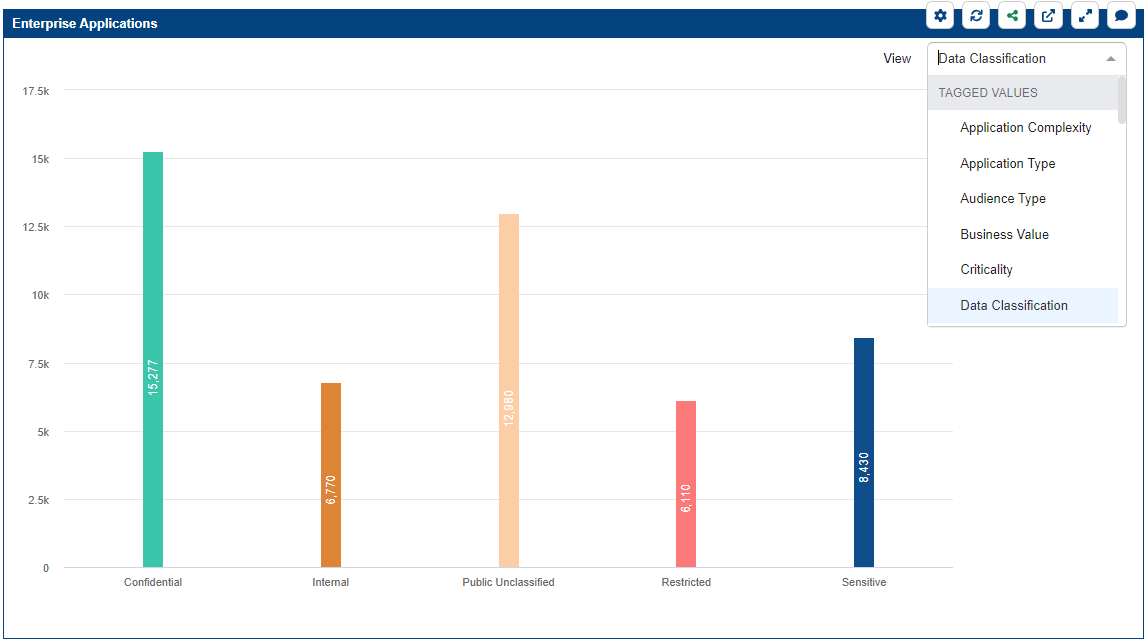
Choose the required property to change the chart output.
To know more on how to create a usual column Chart, Click here.
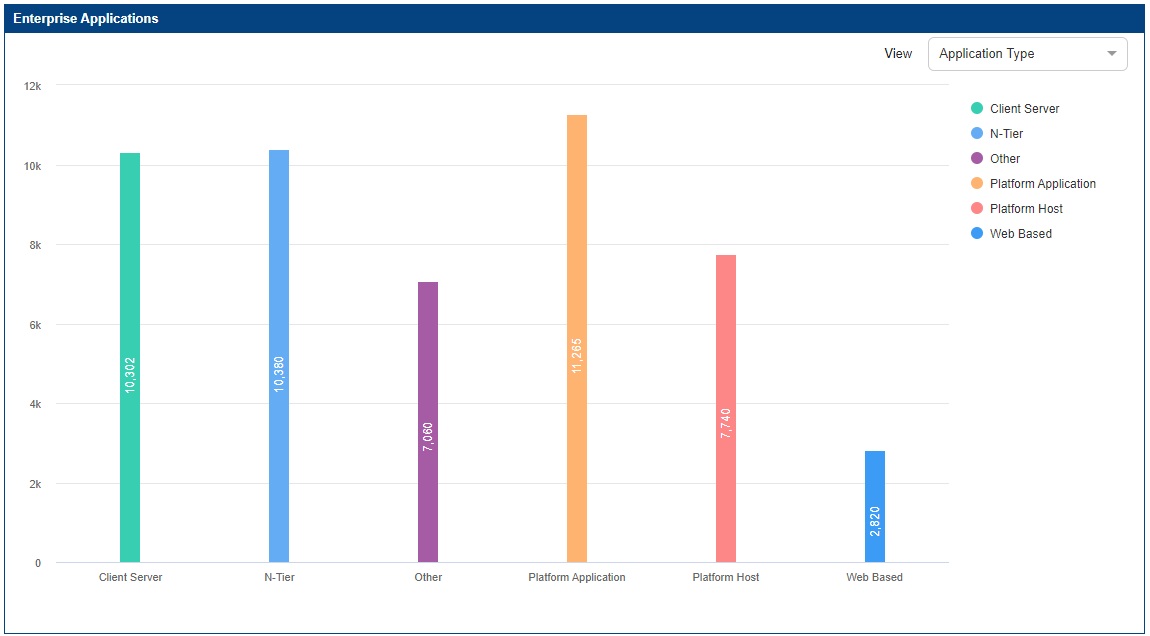
Configure a Dynamic Stacked Column Chart
Note:
- The dynamic chart is enabled based on a specific configuration so please make sure the chart is configured using designer and not more than one stereotype is selected in ‘Specify Stereotype’ field.
Click here to read the complete prerequisite.
Click here to know how to add a chart.
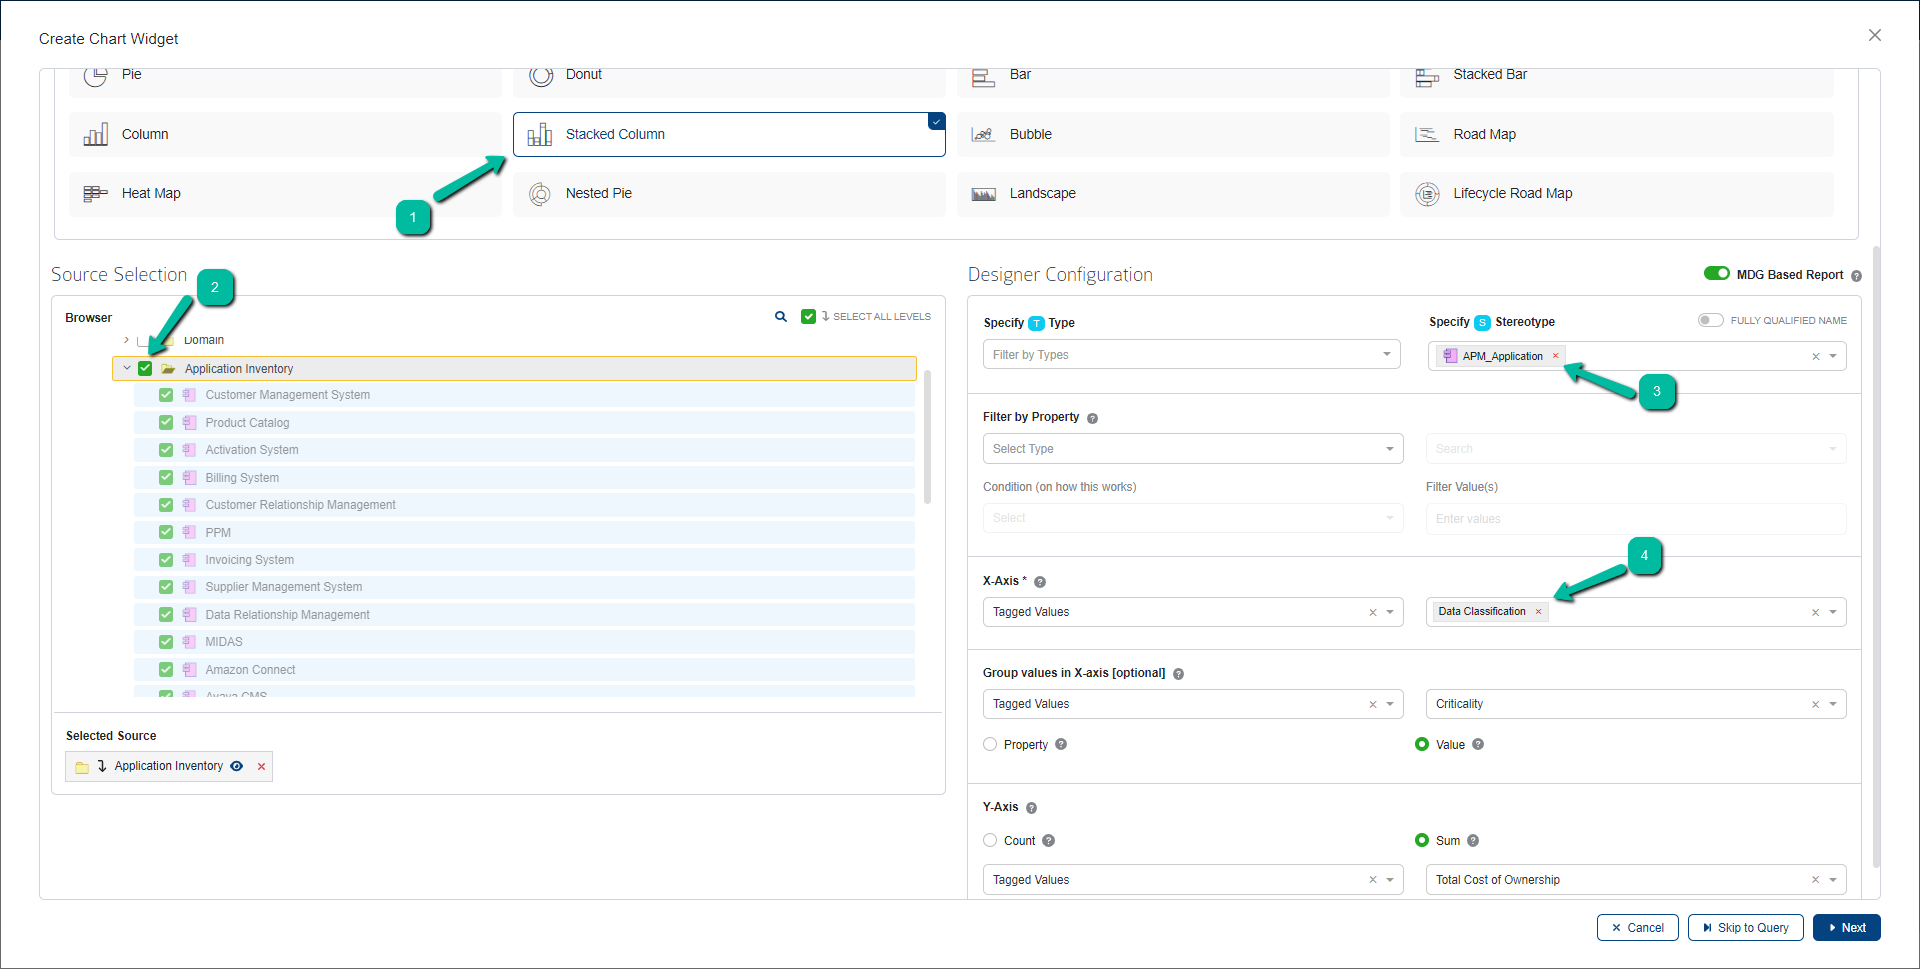
To create a dynamic Stacked Column chart,
- User must select the chart type as Stacked Column
- Select the Source
- Select a Stereotype
- Select a tagged value/property in X-Axis to build the chart
Save the chart and open the dashboard to view it. A dropdown field will be displayed with the property selected in X-Axis when configuring the chart.
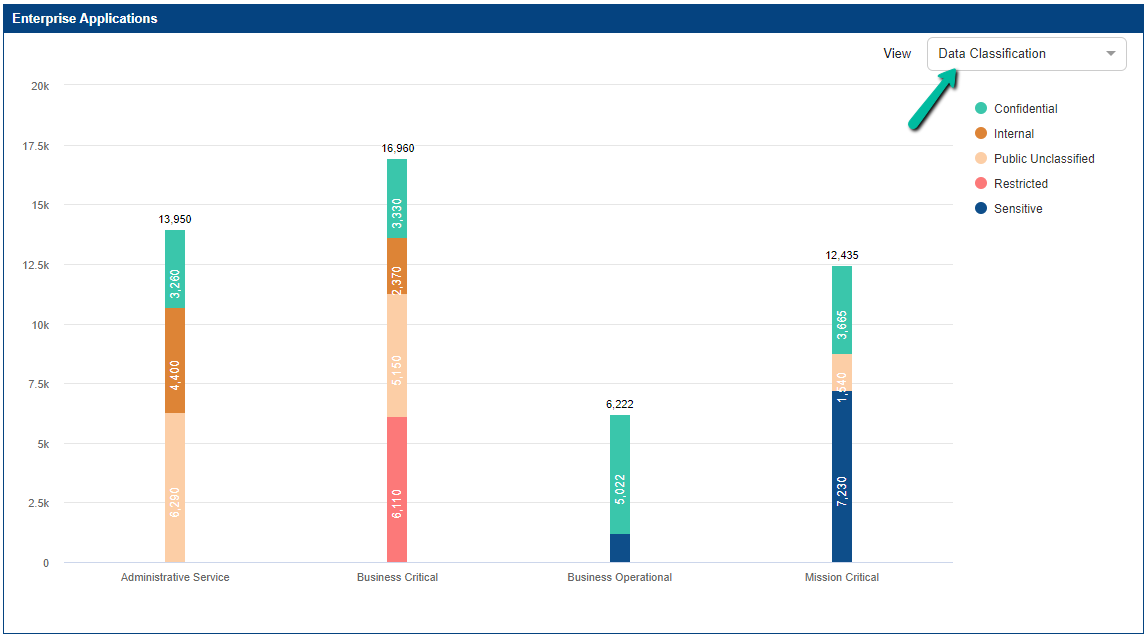
Clicking the dropdown lists all the basic properties (Name, Author, etc.,) and tagged values configured for the stereotype in the Form Designer.
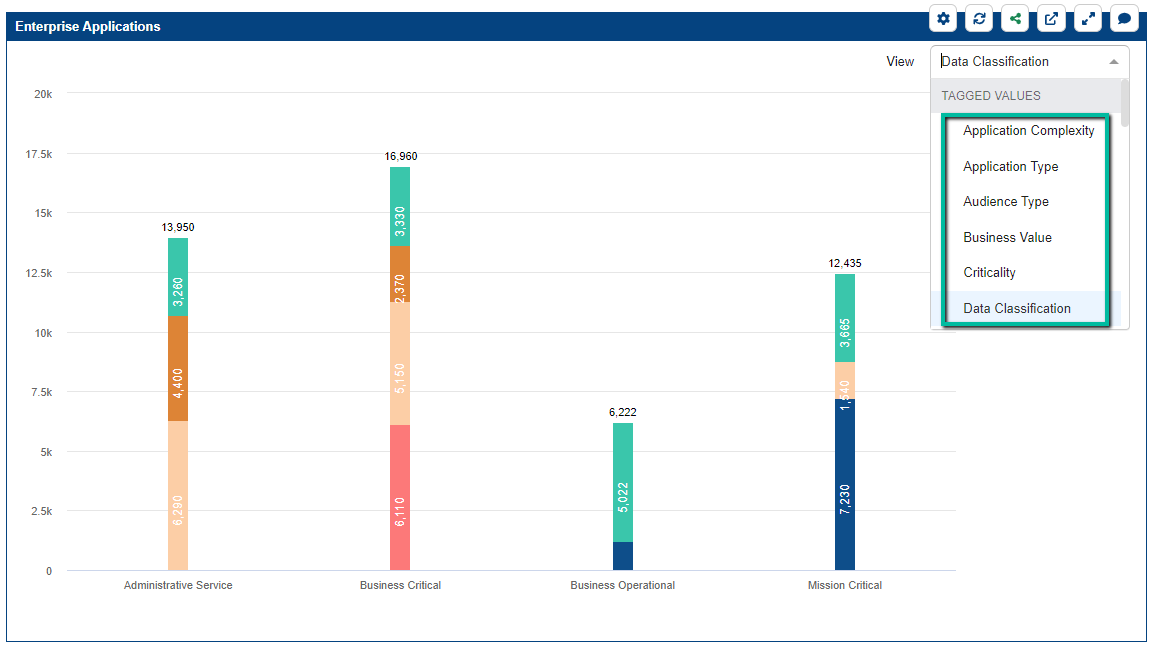
Choose the required property to change the chart output.
To know more on how to create a usual Stacked column Chart, Click here.
Configure a Dynamic Landscape Chart
Note:
- The dynamic chart is enabled based on a specific configuration so please make sure the chart is configured using designer and not more than one stereotype is selected in ‘Specify Stereotype’ field.
Click here to read the complete prerequisite.
Click here to know how to add a chart.
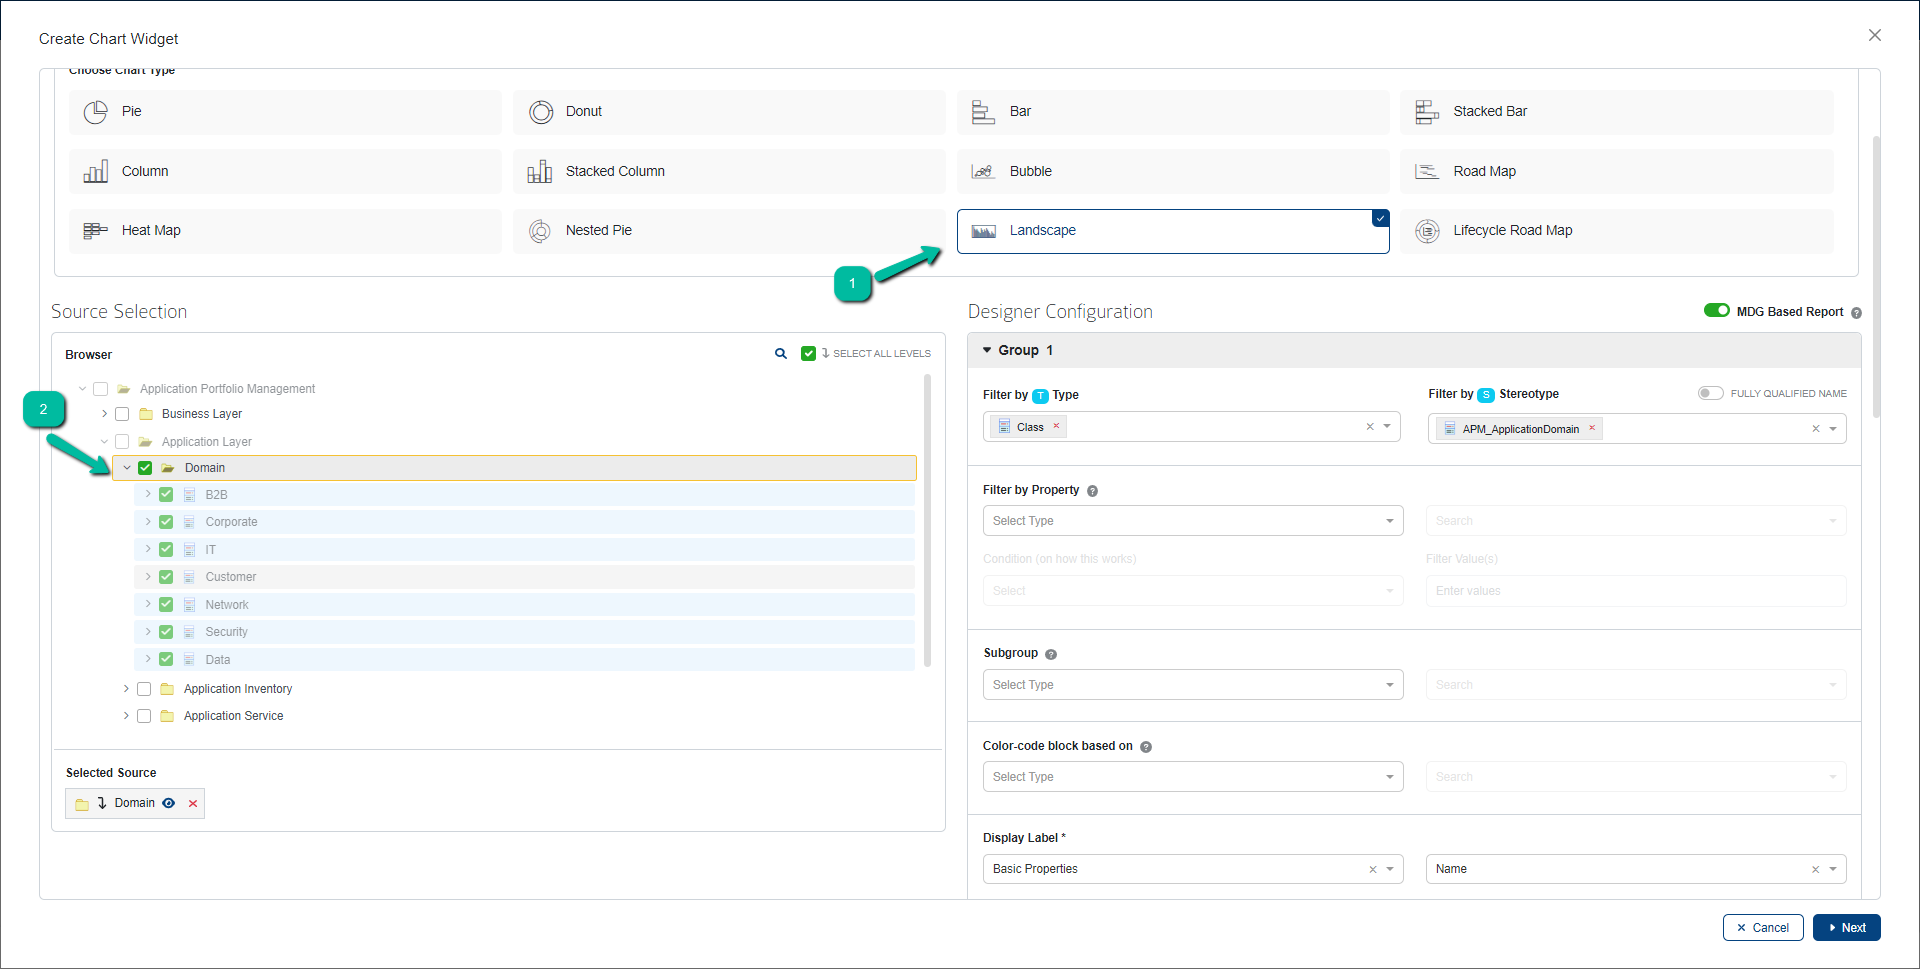
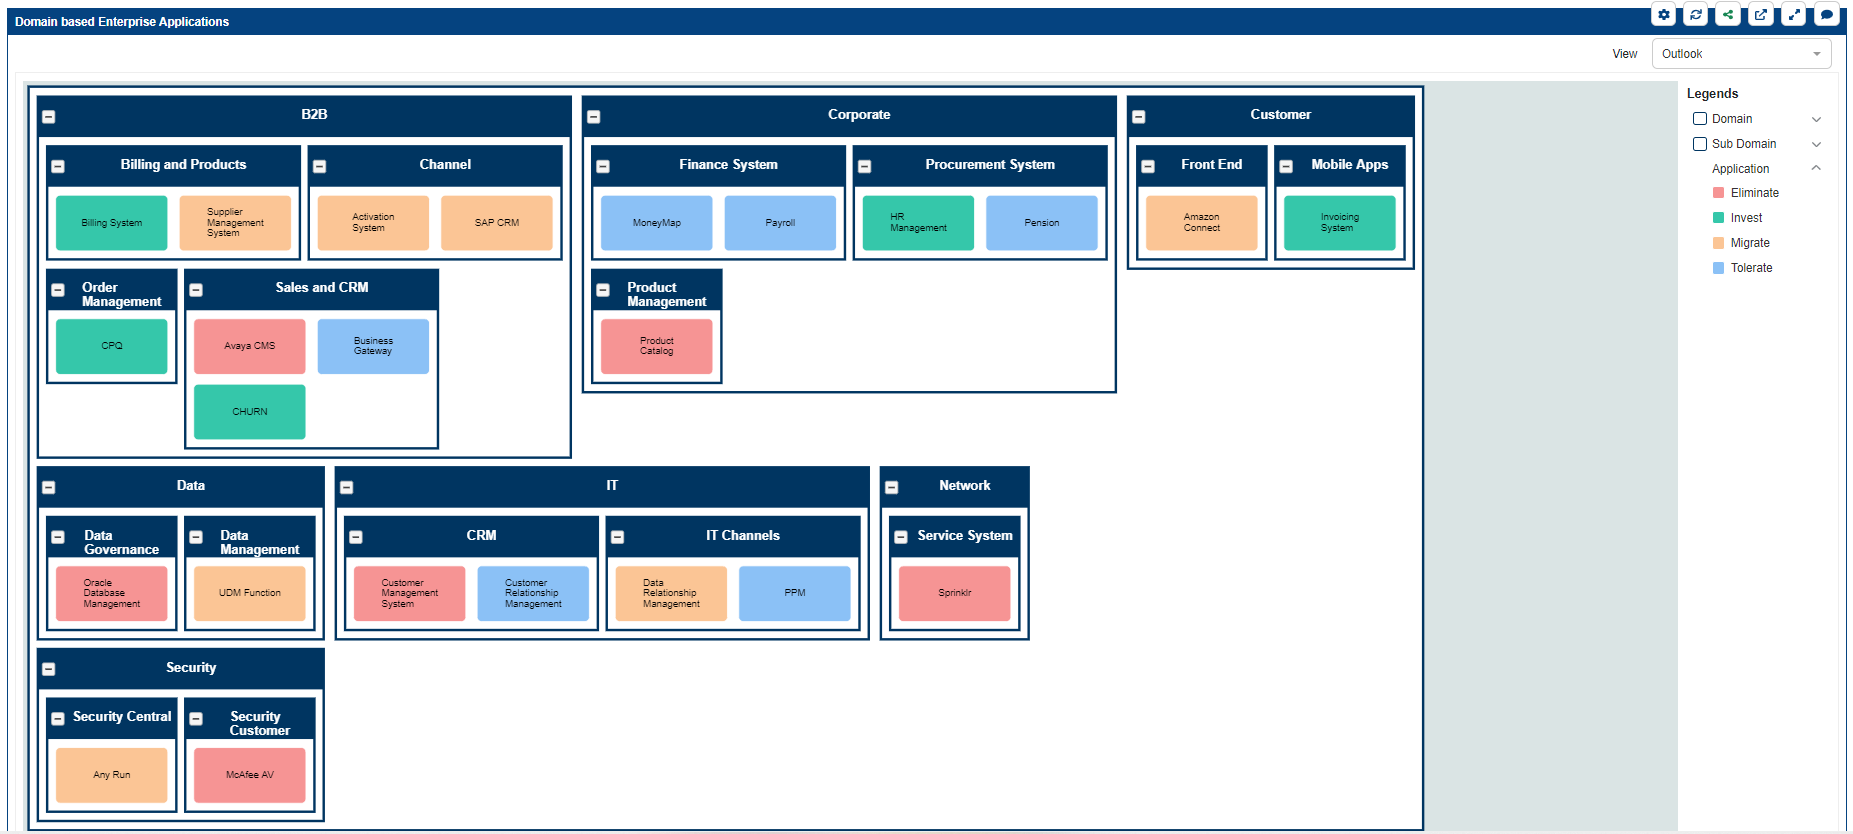
To create a dynamic Landscape chart,
- User must select the chart type as Landscape
- Select the Source
- Select a Stereotype (not more than one)
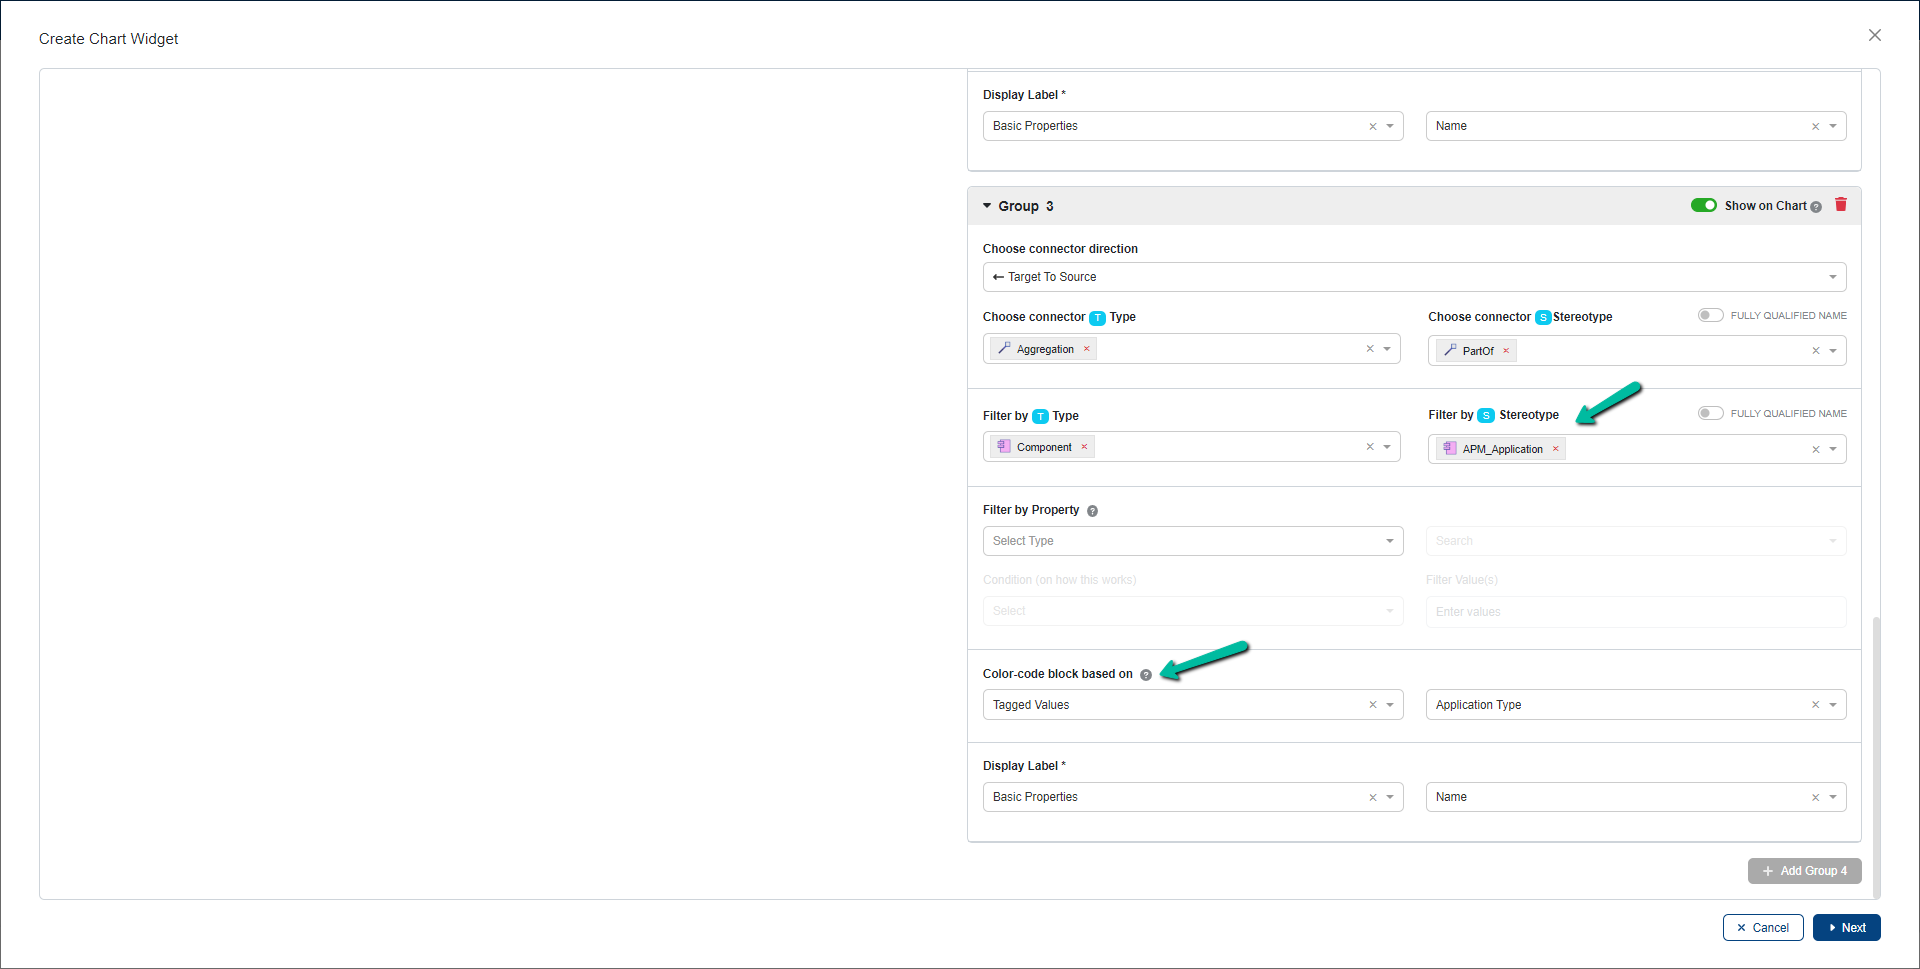
- Select a tagged value/property in color-code blocks based on to build the chart
Note:
- In the dynamic landscape chart, the colors of the last level change based on the selected tagged value. The landscape chart supports up to 3 levels, where the third level is considered the last when three levels are configured, the second level is considered the last when two levels are configured, and the first level is considered the last when one level is configured.
Save the chart and open the dashboard to view it. A dropdown field will be displayed with the property selected in Color-code block based on when configuring the chart.
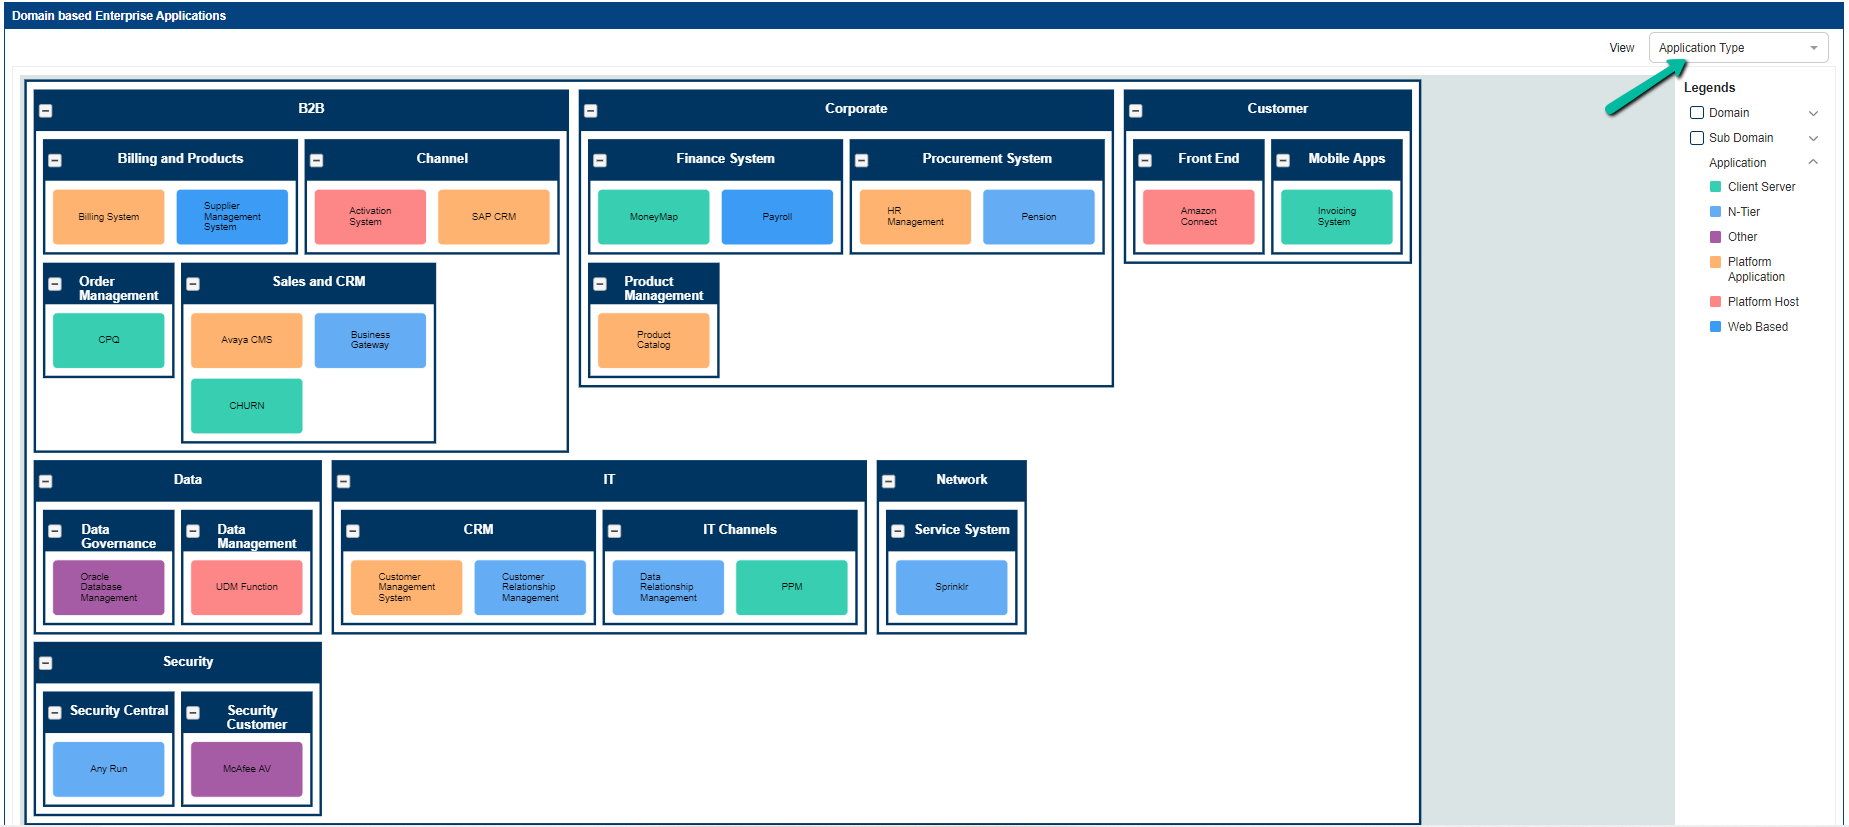
Clicking the dropdown lists all the basic properties (Name, Author, etc.,) and tagged values configured for the stereotype in the Form Designer.
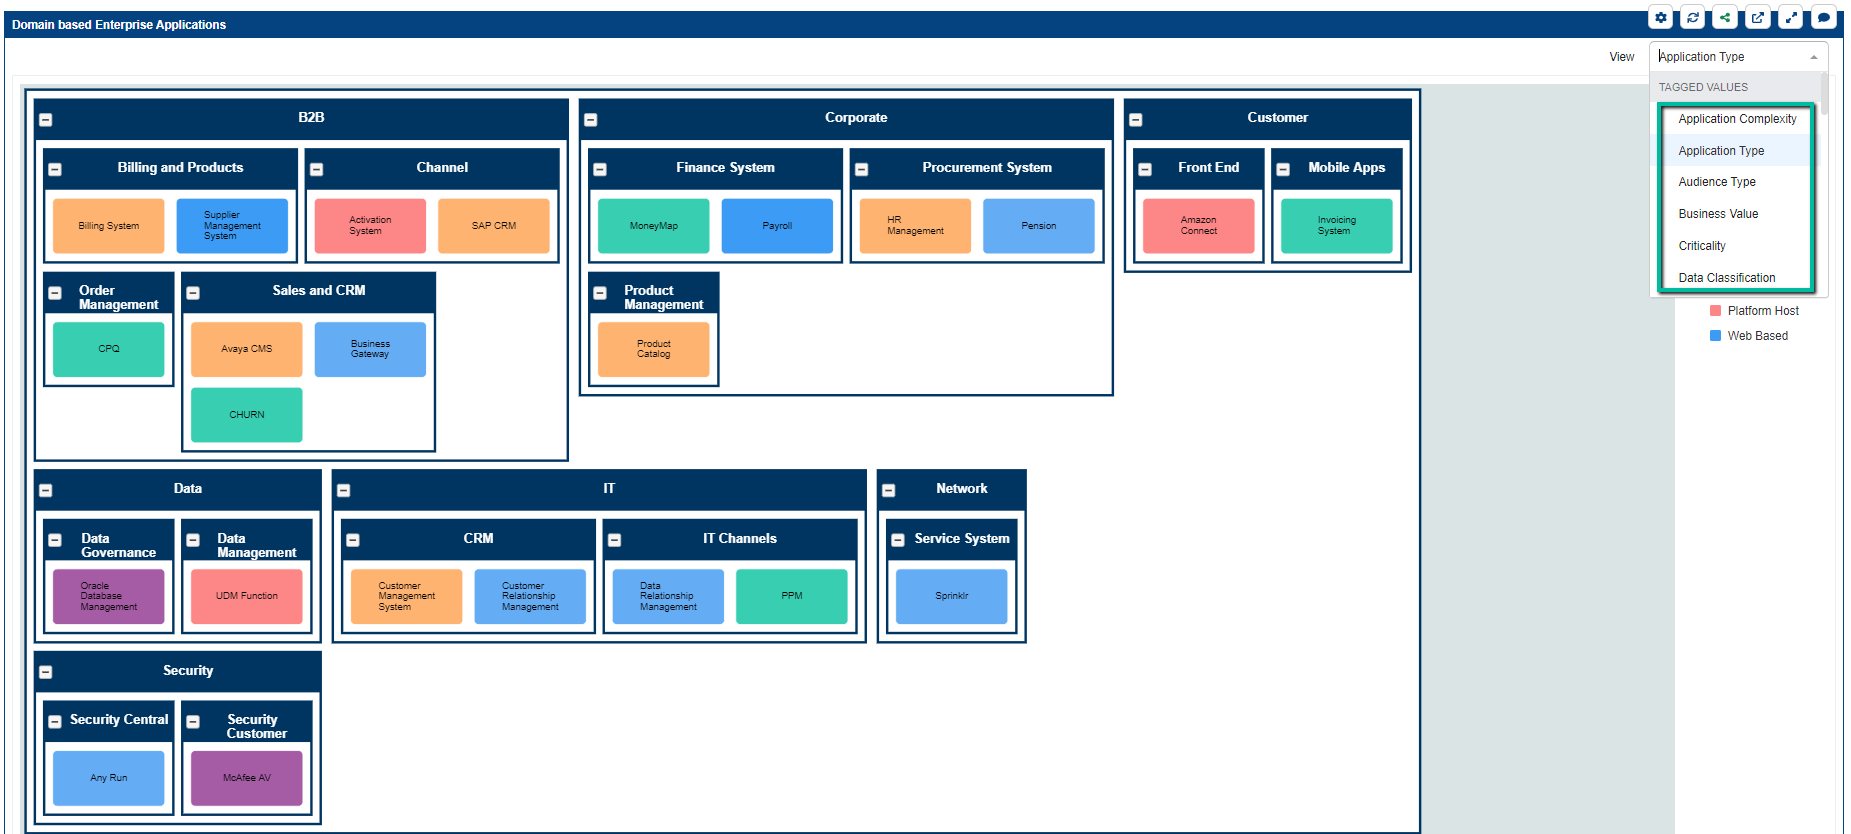
Choose the required property to change the chart output
To know more on how to create a usual Landscape Chart, Click here.
Show Properties based on MDG Profile
The dynamic chart was originally introduced in Prolaborate 5.0. The filter on the dynamic chart was further enhanced in version 5.1 to display only the properties relevant to the users as defined in the MDG Profile, which is set as the default for the user group. Again, we have made some enhancements in version 5.2; the new changes are mentioned below.
Note:
- From Prolaborate V5.2.0, only properties of type Enum and Boolean from MDG and custom properties are displayed in the dropdown.
- Basic properties are not displayed in the dynamic chart filter.
- If the chart is built based on a basic property, then that property is displayed in the dropdown filter.
Let’s look at this in detail on how the dynamic chart dropdown shows the properties based on MDG Profile for different users
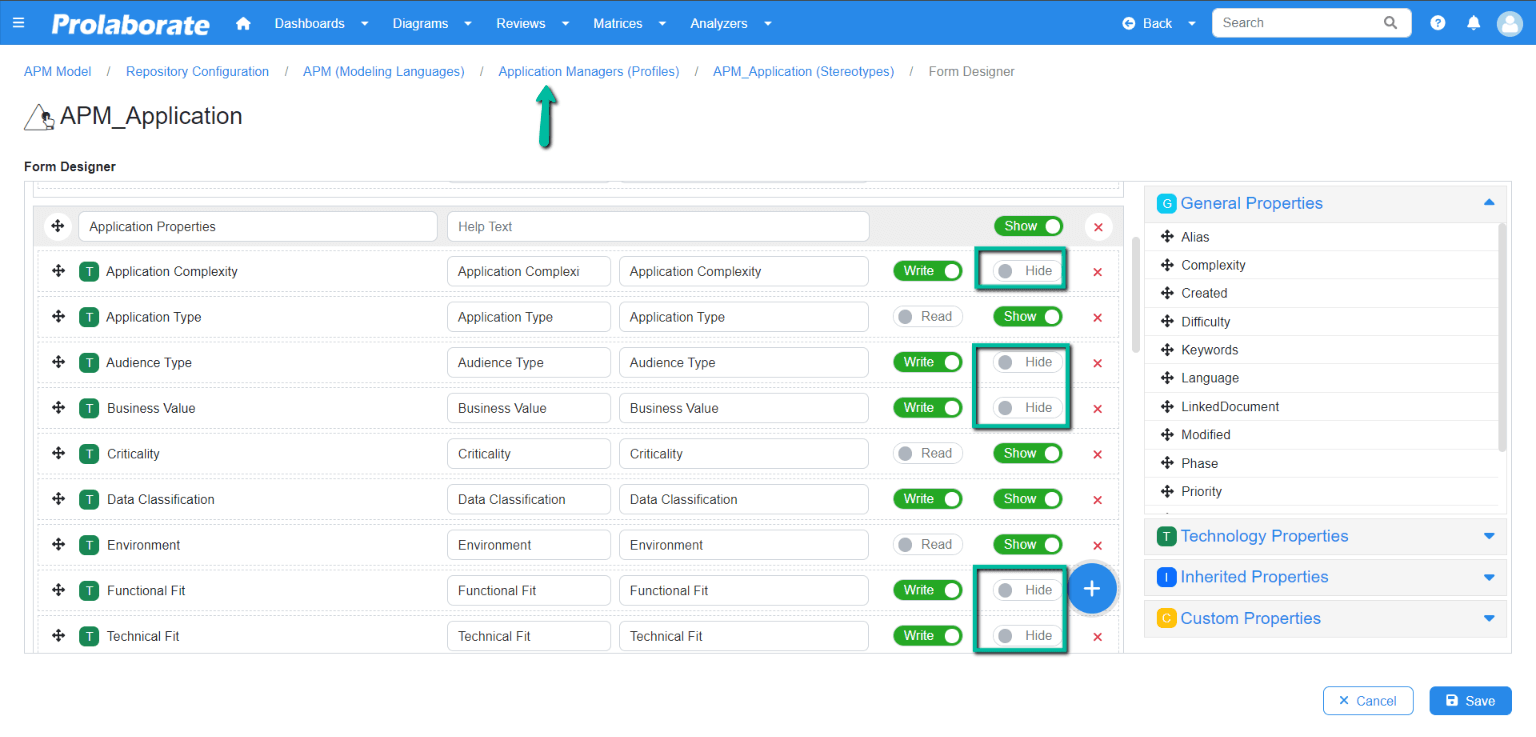
Here we have created two MDG profiles ‘Application Managers Profile’ and ‘Default Profile’. Map a user group to the profiles and configure the forms for the stereotypes present in the profiles.
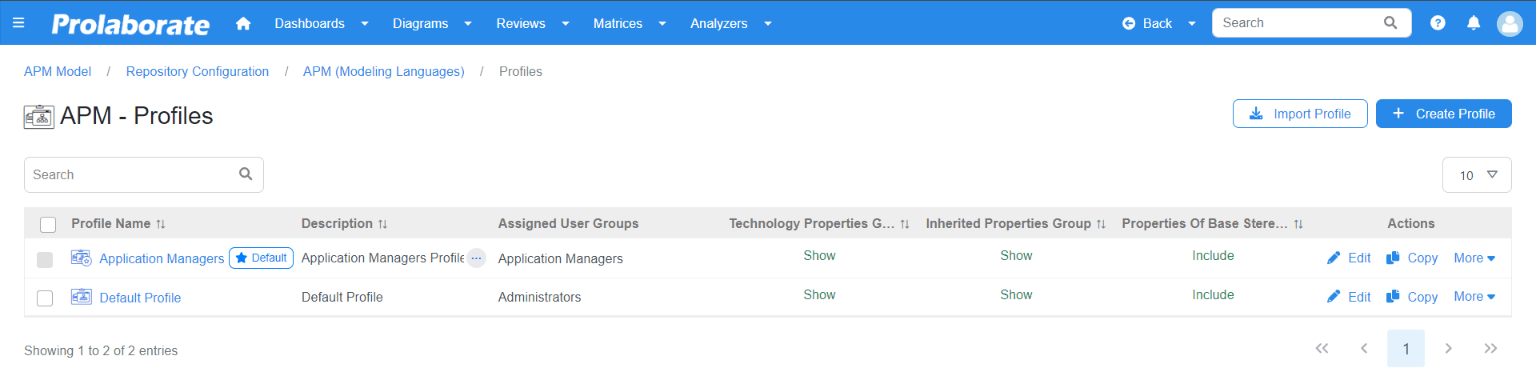
In ‘Default profile’, all the properties are marked as ‘Show’ for the Stereotype ‘Application’
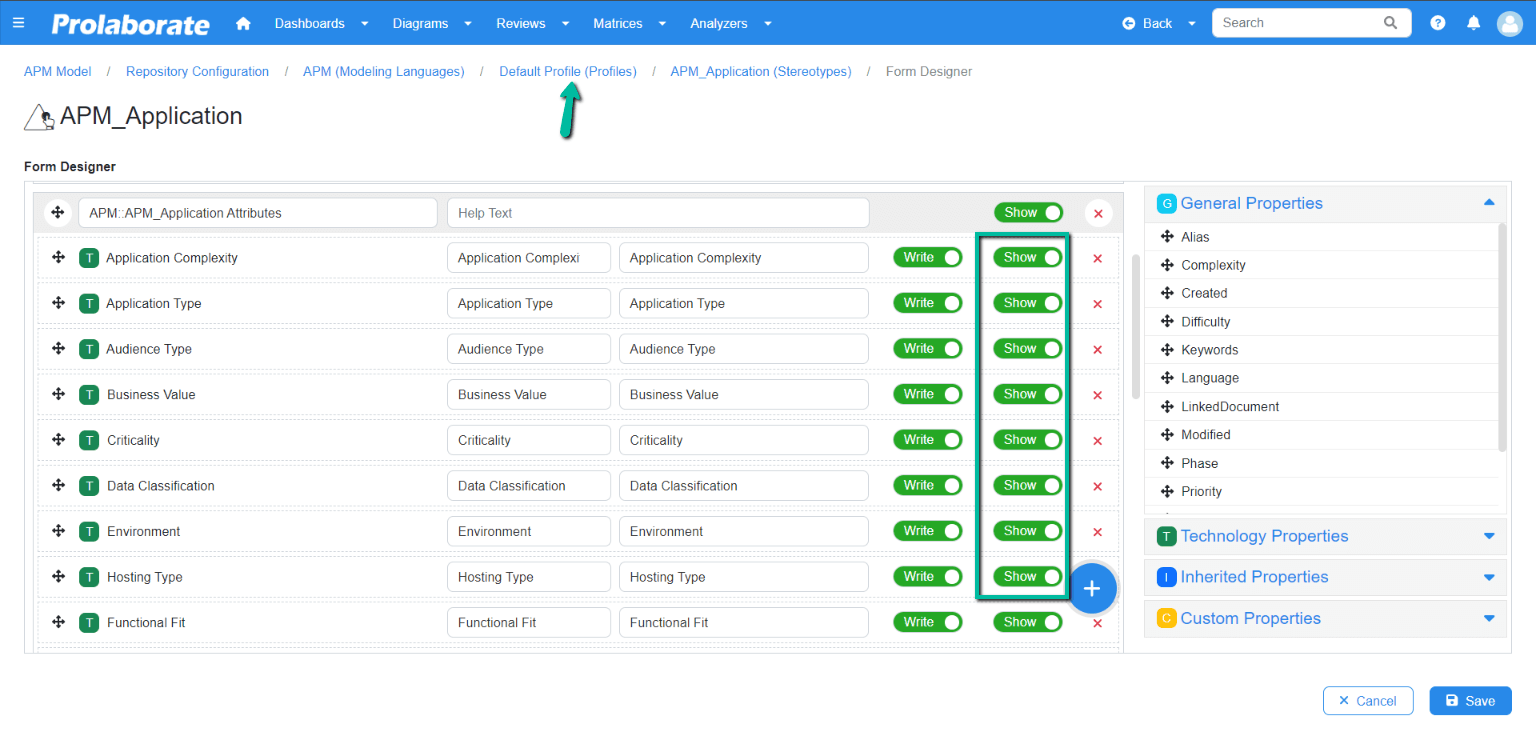
Whereas in the custom ‘Application Managers’ Profile some of the properties are marked as ‘Hide’ for the Stereotype ‘Application’
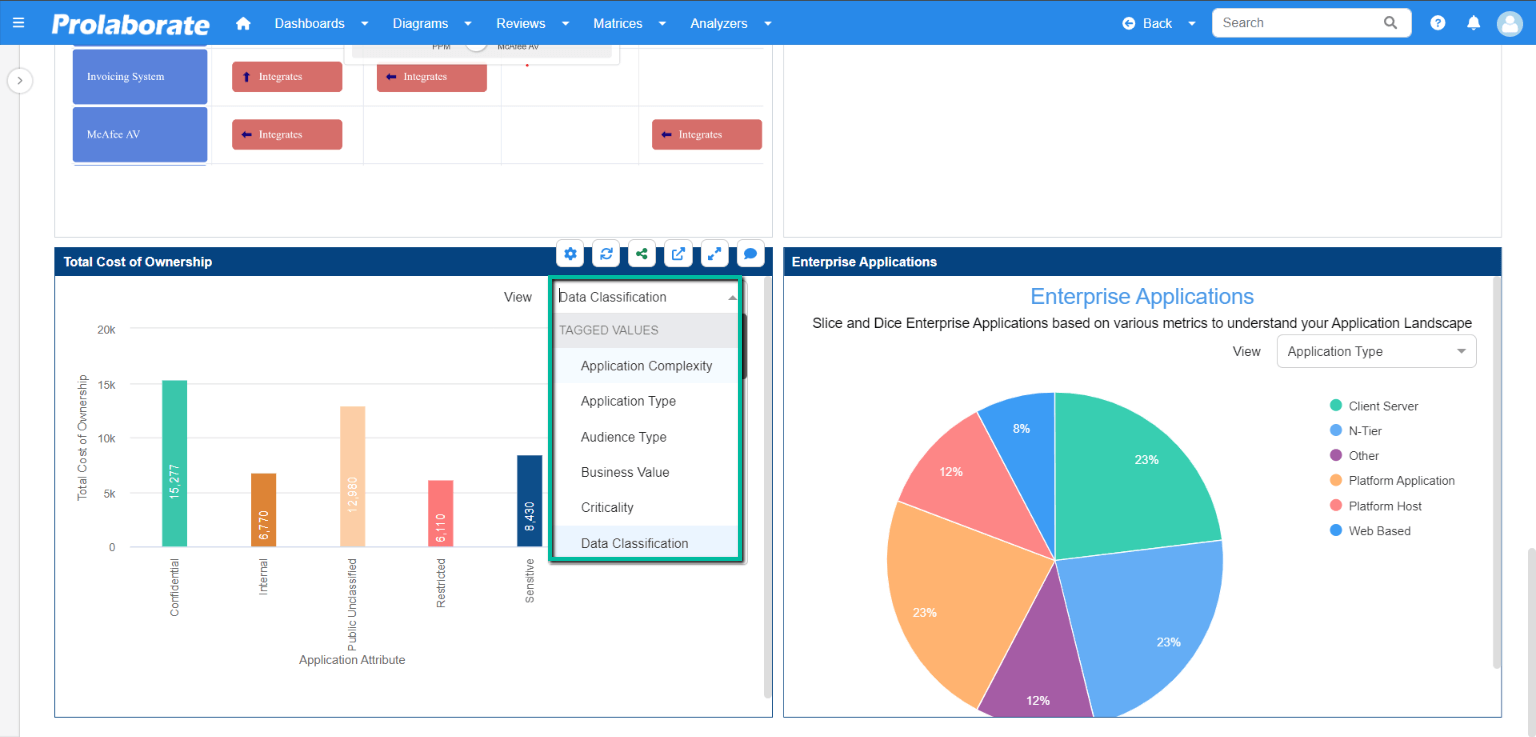
Login to the application (In the example, Andi A has logged in) for whom ‘Default Profile’ is set as default. Hence the dynamic chart dropdown shows all the properties.
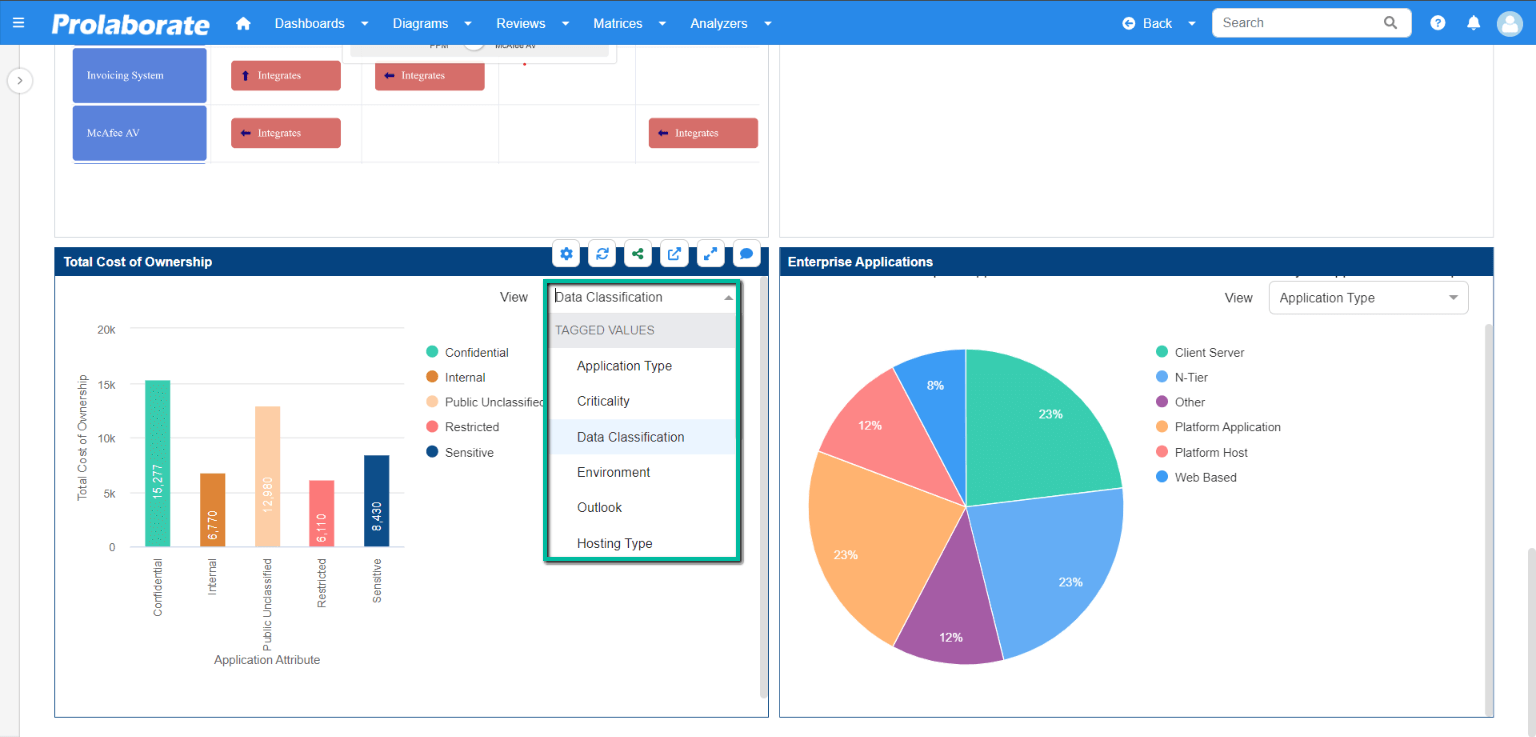
On the other hand, when Beth B login to the application for whom ‘Application Manager Profile’ is set as default. The dynamic chart dropdown shows only the properties that are set as ’Show’ in the form designer.
To know more on how to create a usual Landscape Chart, Click here.