
Reports Configuration
Reports Configuration
Reports Configuration allows the user to quickly create reports and reuse them in Chart and Report widgets in Prolaborate. It allows the user to save time without configuring the widgets from scratch. Configuration from existing charts and reports widgets can be saved as a report for reuse.
Note:
From Prolaborate V5.3 onwards, Reports Configuration is placed under Resources Manager.
Users can build two types of ‘Reports’
- Designer-based Reports can be applied only in the Report widget and Connector property.
- Query-based Reports can be applied to the Report widget, Chart widget (single level), Chart widget (multi-level), Connector property, and Query property.
| Term | Definition |
|---|---|
| Report | Reports are configurable and reusable while creating chart and report widget |
| Report Widget | Report Widget, has the results shown in a table list format. It allows users to reuse a report. |
| Chart Widget | Chart Widget showcases results shown in a graphic/chart format. It allows users to reuse a report. |
| Designer Configuration | Designer Configuration generates queries based on user selection rather than DB queries and is limited to report widgets and connector property. |
| Query Configuration | Query Configuration allows users to build complex report & chart widgets by writing queries. |
Design Reusable Reports for Chart & Report Widget
Click Menu > Resources Manager under repository configuration.
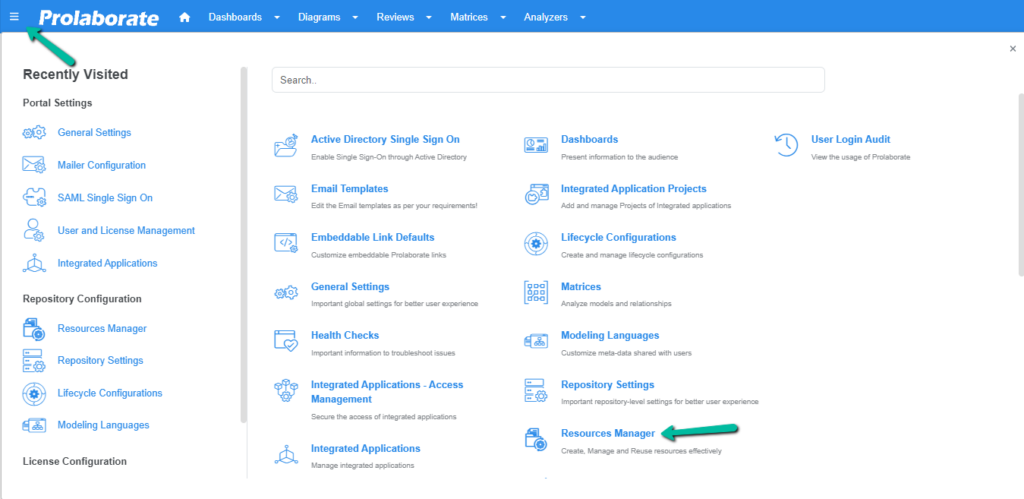


Choose Reports Configuration from the left side panel.
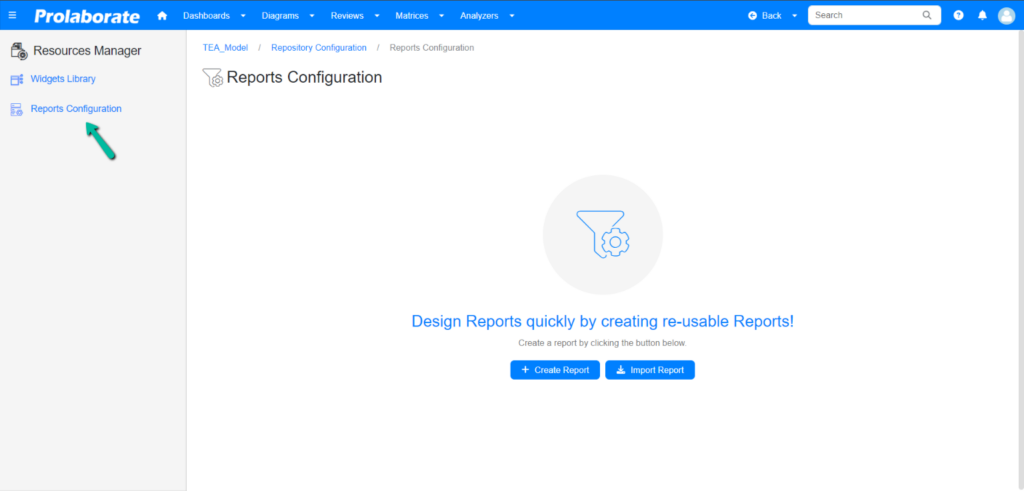
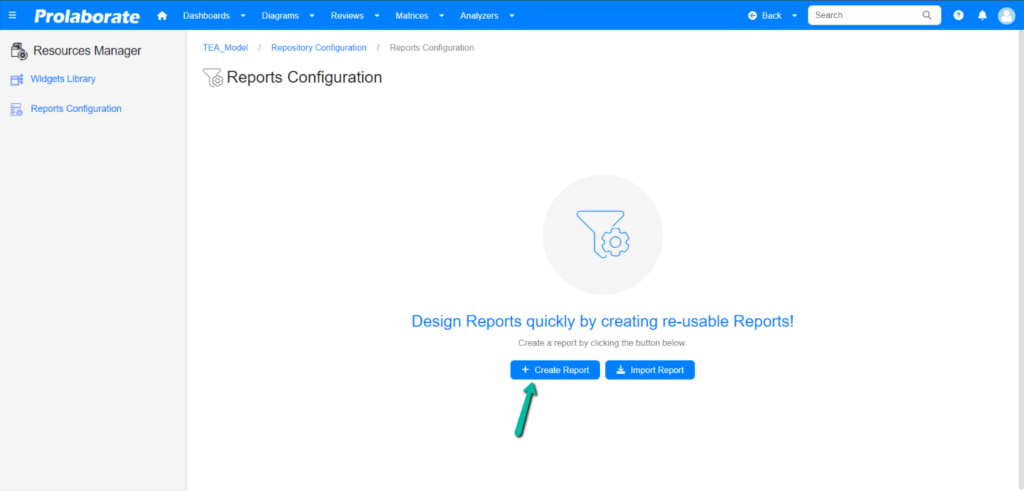
Click Create Report to create a new report.
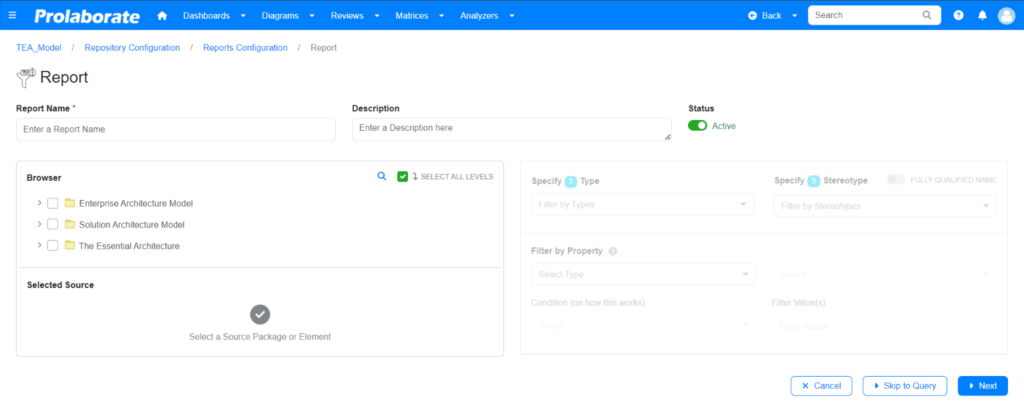
On launch, ‘reports’ will land user on the designer configuration page. Enter a name and description for the report in the given fields. Toggle the status to mark the report as Active/Inactive.
Build Reports for Report Widget
There are two ways one can create a report for a report widget. The first option is for users who are unfamiliar with SQL queries but still prefer to create report. The second option is for users who prefer to build complex reports by writing queries.
Option 1: Designer Configuration for Report Widget
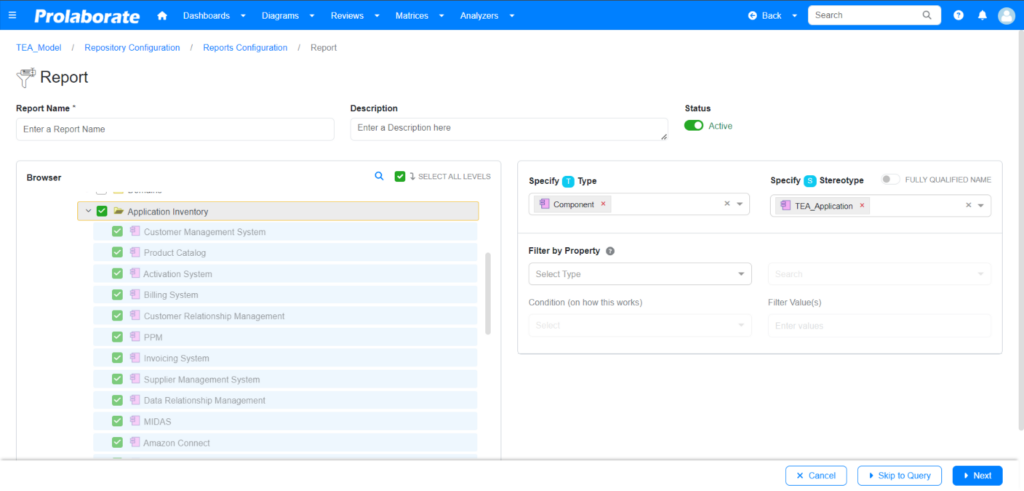
This section allows the user to select the configuration needed to create a report.
Browser: Lists all the packages in the selected repository.
Search Repository: Aids in the search for packages and elements. Click on the Search icon to open the repository search page. Here, the user can search for elements by name or the user can choose object type and stereotype from the dropdown menu.
Select All Levels: Select All Levels, is a recursive selection. Once user selects a package, all the sub packages and elements within the package get selected automatically.
Specify Type: From the dropdown list, choose the Object types from the package.
Specify Stereotype: Choose the stereotypes from the dropdown.
Fully Qualified Name: Enabling this option allows the user to see the complete name of a Stereotype, combining technology name with stereotype name. If not, the user will only be able to see the name of the Stereotype.
Filter By Property: Users can filter the elements based on the basic properties such as Name, Stereotype, Status, Notes, etc, and also tagged values.
After choosing all the filters click on Next.
On the query configuration page, the queries generated from selection in designer configuration is shown. The queries will be in read-only mode. Users who wish to edit, must toggle Edit auto-generated query option.
Note:
- Enabling this option will result in loss of traceability between the selected designer configuration from the previous page and the query.
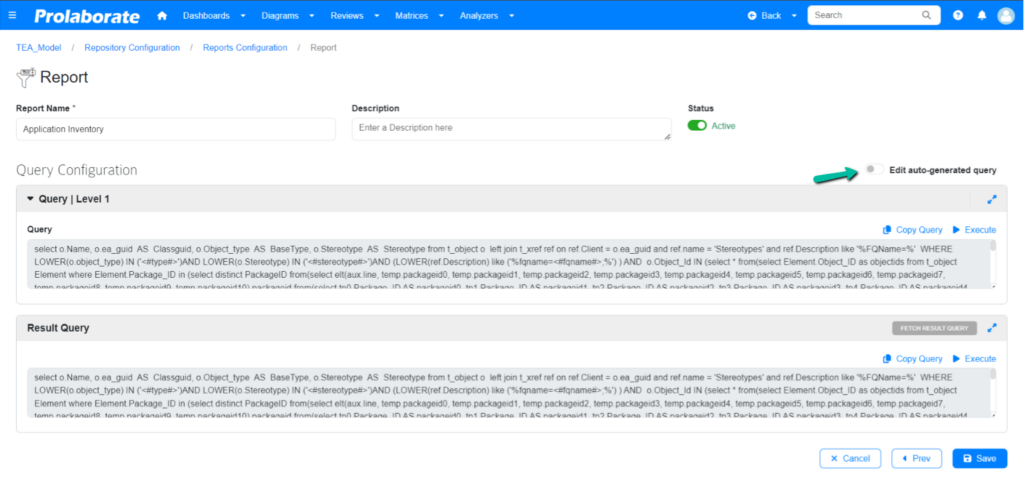
Click Execute to open the Execute Query window and preview the results. Click Save to save the report as a designer type report for EA report widget.
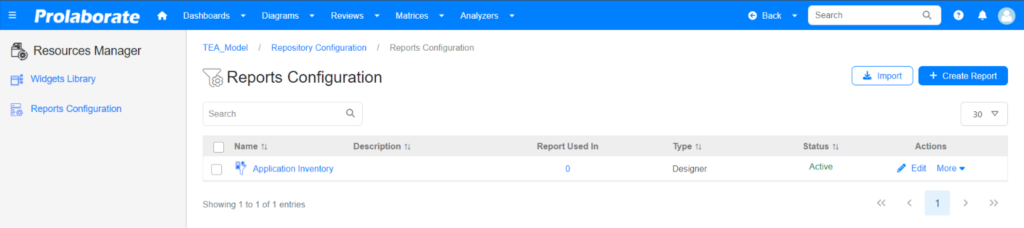
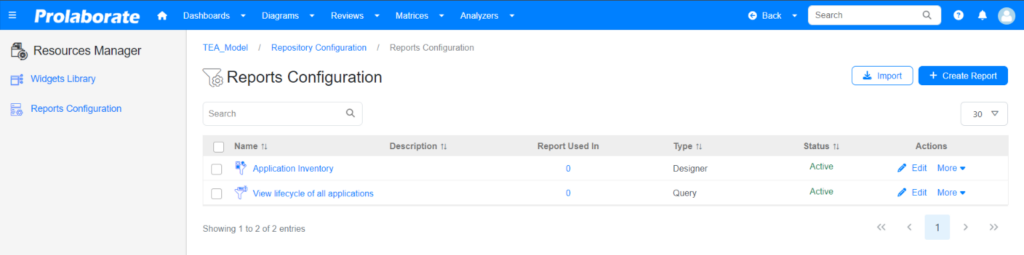
The created report will be listed in the Report Configuration window and its type will be designed as shown below.
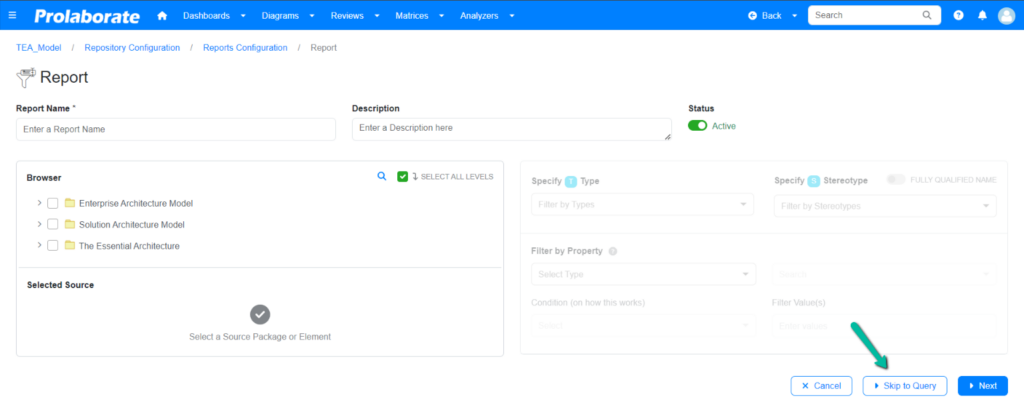
Option 2: Query Configuration for Report Widget
This feature allows the user to write query and capture it as a report for reuse. To create a report using query, click Skip to Query at the bottom of the page.
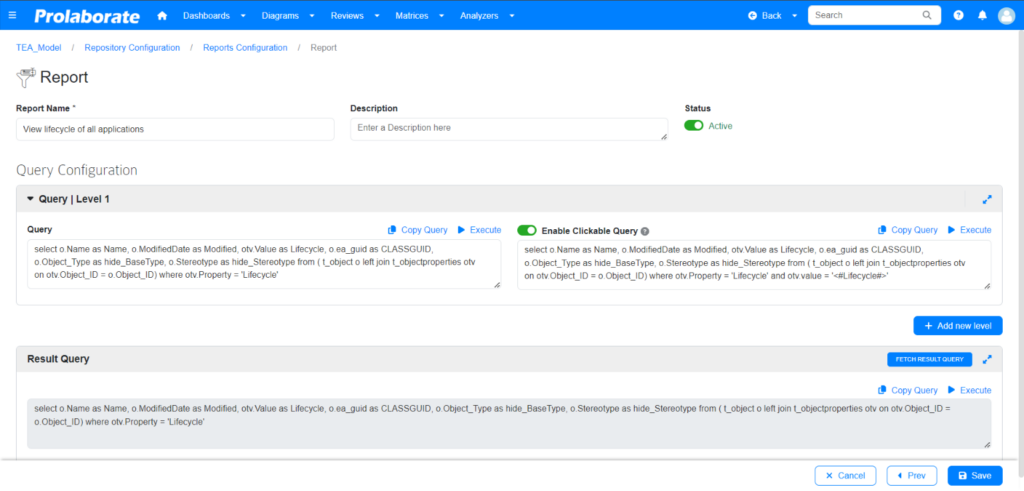
Query: Write the query in the space provided based on the desired result. Add placeholders using ‘<# #>’ in the query and enter values later to generate dynamic reports.
Copy Query: Click this button to copy the entire query, with no manual selection required.
Execute: Click Execute to open the Execute Query window and preview the results there. If placeholders are mentioned, enter values for them and then save and execute the query to preview the results.
Enable Clickable Query: By enabling this, the user can enter a clickable query and it will result in creation of a sub-report when creating a report widget. Add placeholders using ‘<# #>’ in the query and enter values later to generate dynamic reports.
Fetch Result Query: Clicking this button will fetch the result query.
Result Query: This text box will display the result query upon clicking on the Fetch Result Query.
The created report will be listed in the Report Configuration window along with the respective configuration type.
Build Reports for Chart Widget
Create reusable reports for Single and Multi-level Charts using the query configuration feature from the Reports Configuration page.
Option 1: Query Configuration for Single and Multi-level Charts
Click Create Report and then Skip to Query option to launch the query configuration window.
Query: Enter the query in the space provided based on requirements. Placeholders which ask users to enter values during execution are added to the query by using ‘<# #>’ syntax.
Copy Query: Click this button to copy the entire query.
Execute: Clicking on Execute opens the Execute Query window and displays results as preview. In the placeholders, enter the values, save and execute the query to preview the results.
Enable Clickable Query: By enabling this, the user can enter a clickable query and it will result in creation of a sub-report when creating a report widget. Add placeholders using ‘<# #>’ in the query and enter values later to generate dynamic reports.
Fetch Result Query: Clicking this button will fetch the result query.
Result Query: This text box will display the result query upon clicking on the Fetch Result Query.
Click on Save to save the report and use it to create a single level chart.
Note:
- This Multi-level feature allows users to navigate from one artifact to another via a connector or other properties such a RefGUID.
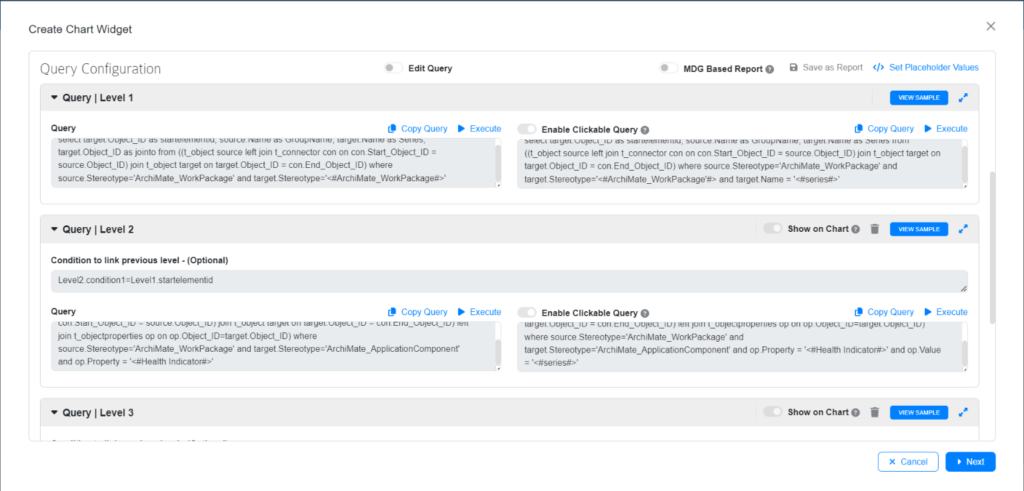
To create a report for multi-level chart, click Add New Level and enter query as required. Click Fetch Result Query to get a combined result query of all levels.
Show on Chart: Toggle this option to control which levels needs to be displayed while creating a multi-level chart.
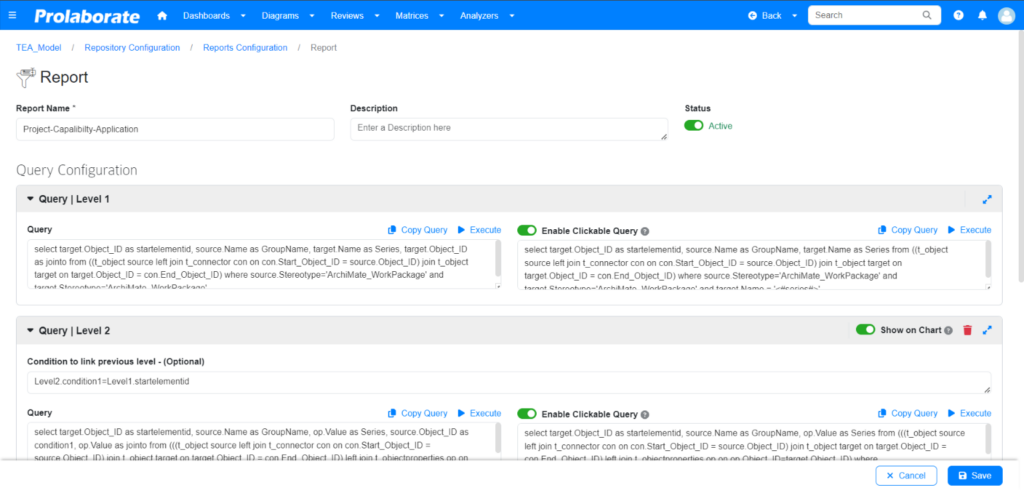
Click Save to save the report and use it to create a multi-level chart.
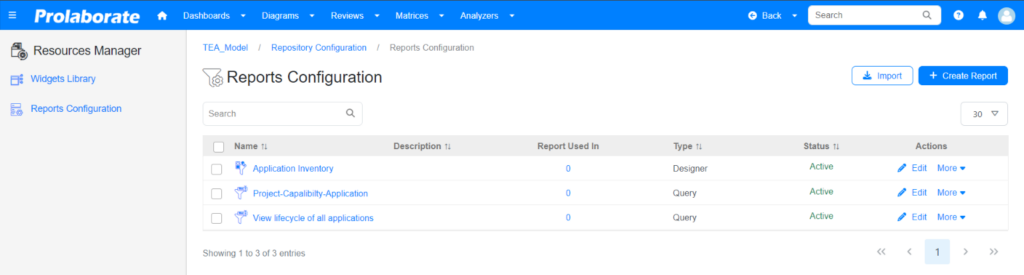
The report created will be listed in the Reports Configuration window along with the respective query type.
Apply Report on a Widget or Chart
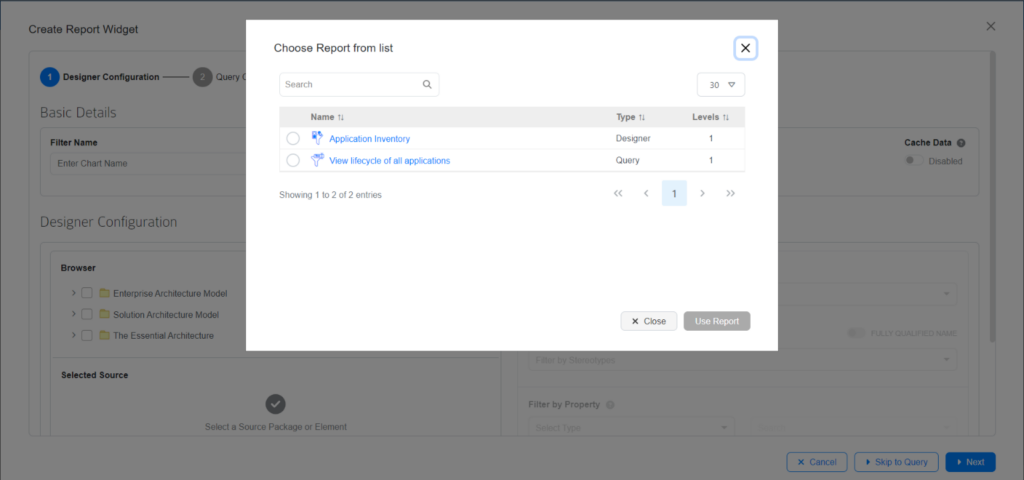
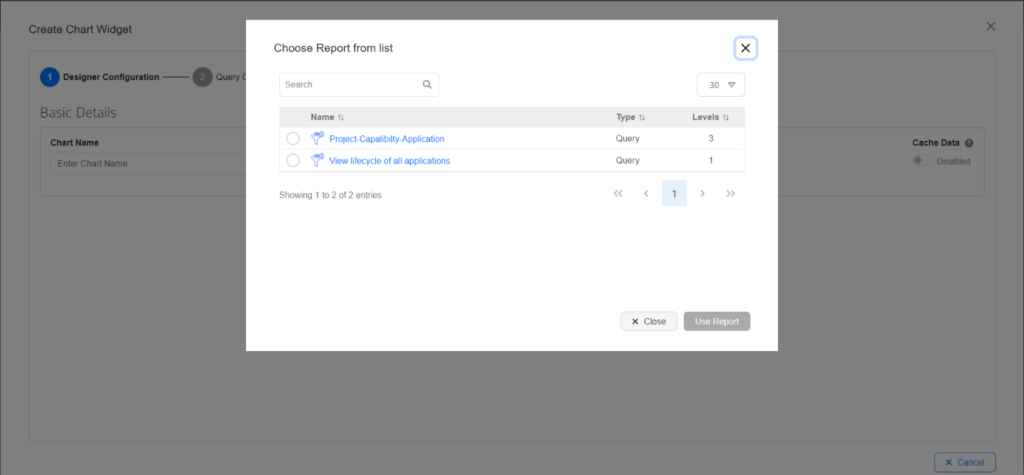
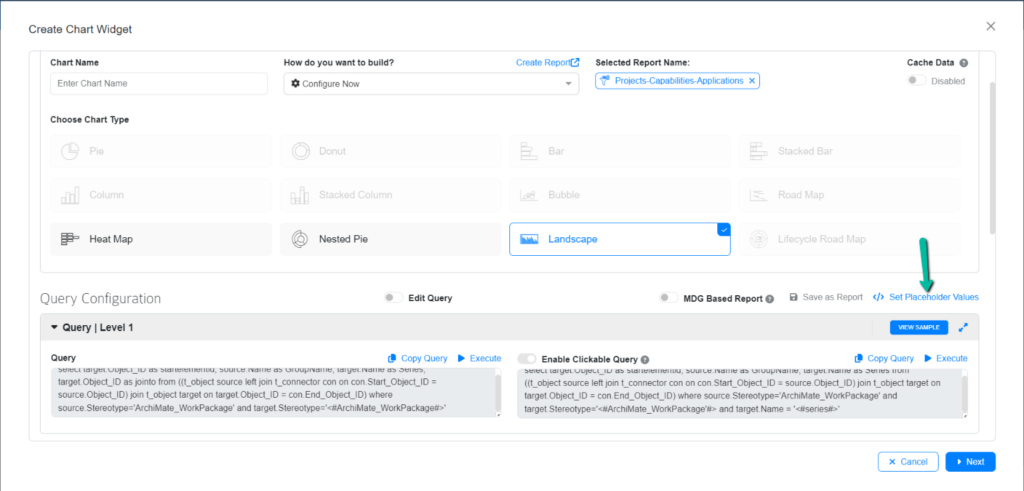
The reports which are created from above sections can be applied when creating a new chart widget or report widget. After choosing the widget type, a popup will appear listing all the available reports.
For EA report widget, the listing will list both the type of reports, designer and query reports.
For chart widget, it will display only the query type reports. The level column denotes the number of levels configured in the query.
Select the required report and click Use Report to apply it.
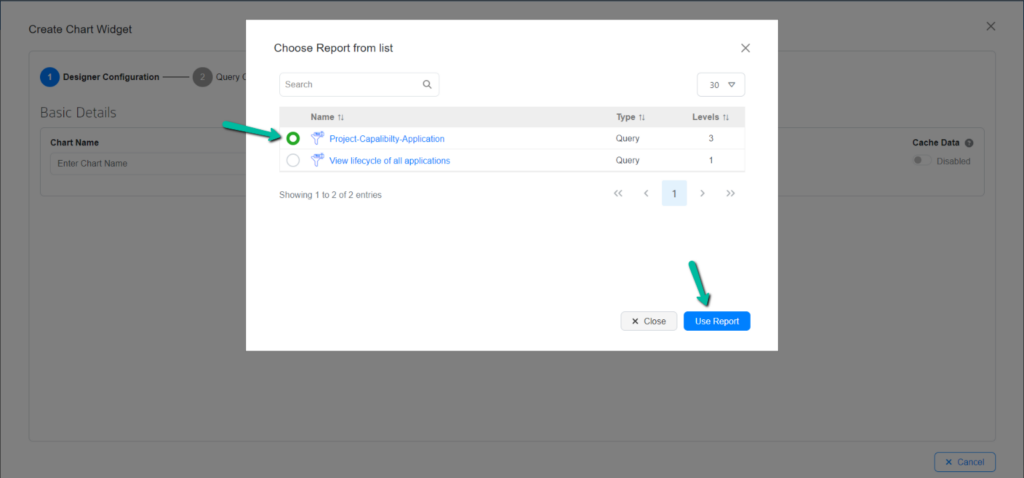
The selected report will be applied for the selected widget type.
Generate Dynamic Reports with Placeholders
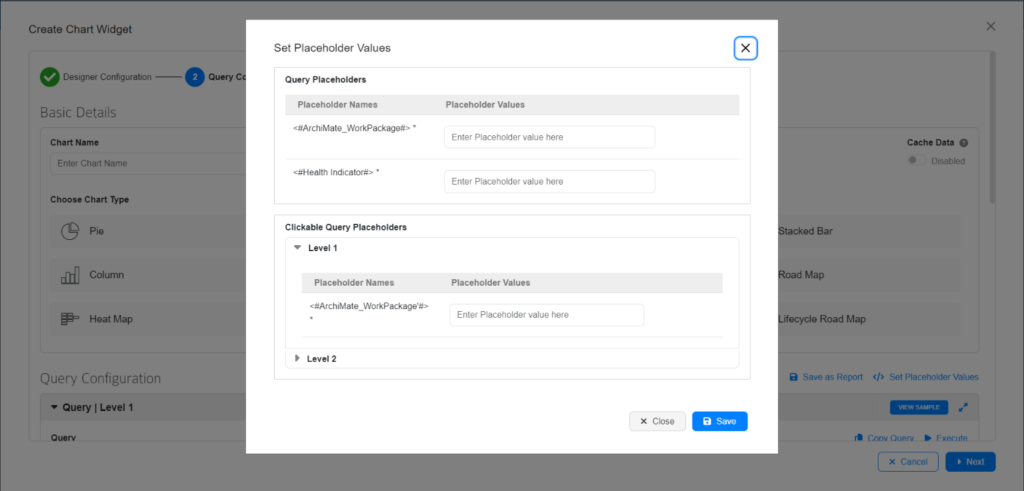
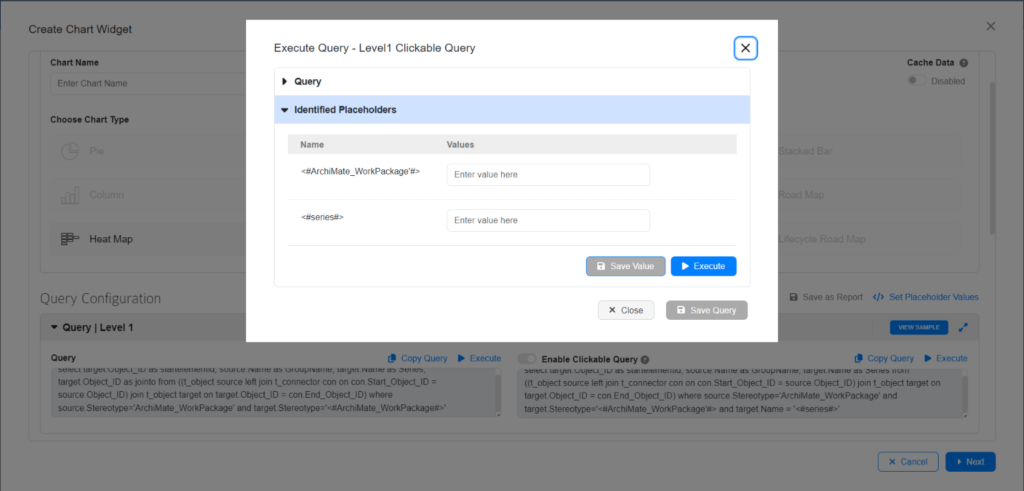
Placeholders enables dynamic report generation by allowing user to enter value, without hardcoding values in the query, on execution. When applying a report, if the selected report contains Placeholders in the query, Set Placeholder Values popup window will appear displaying all the placeholders’ Names. Enter values for the respective placeholders and click Save to save them.
The Placeholder values can be changed using Set Placeholder Values option.
The values can be changed for each level in the Execute Query window. Enter different values and execute them to preview the results.
After the report is applied, all the fields will be in read-only mode.
To edit the applied report, toggle the Edit Query option to make all the fields editable. Enabling this option makes all the fields editable, but it will result in loss of traceability between the selected report and the query.
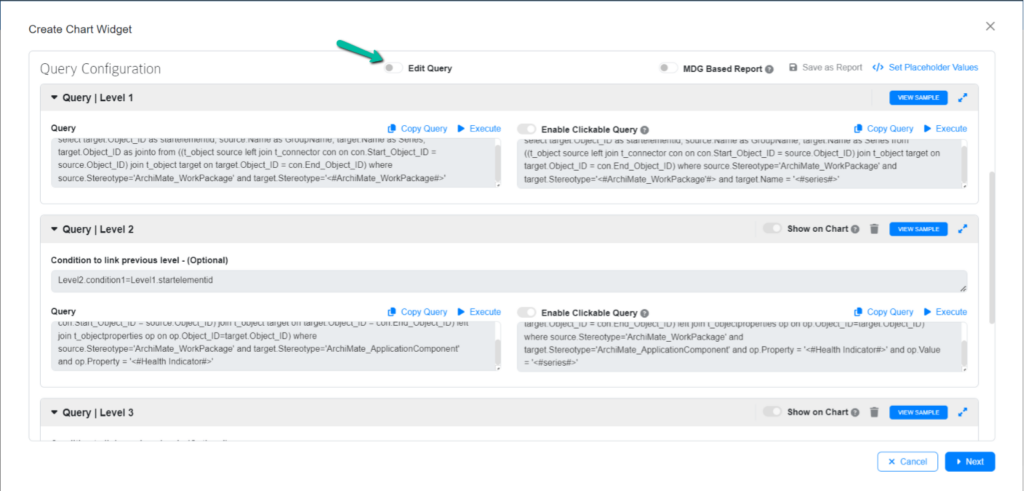
After enabling this option, users can edit and save the configurations as a new report by clicking Save as Report option.
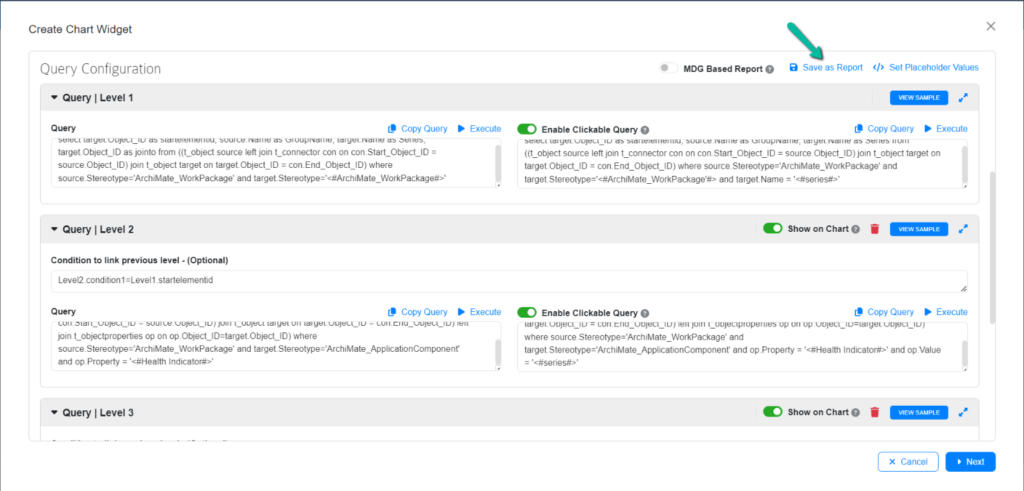
A popup will appear. Give a name for the report and a brief description for the report and click Save to save it.
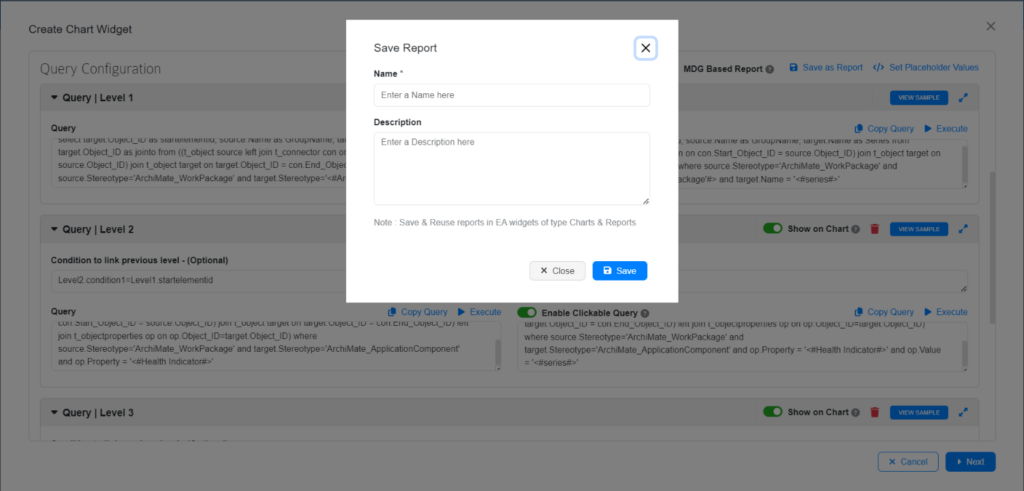
The saved report will be listed in the Reports Configuration page.
The existing Chart and Report Configurations from previous versions can be saved as a report using Save as Report option from the respective widgets.
Navigate to Dashboard, Widget, Connector or Query Properties
From Reports Configuration page, users can navigate to the dashboard, connector or query property where the report is currently used as reference. The number under Report Used In column will show the number of times a report is used.
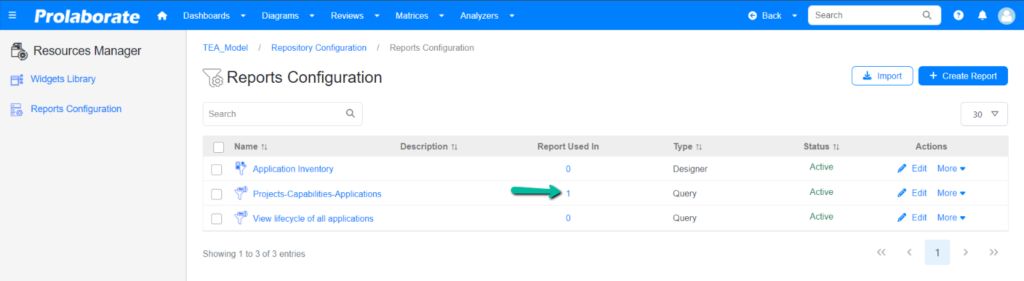
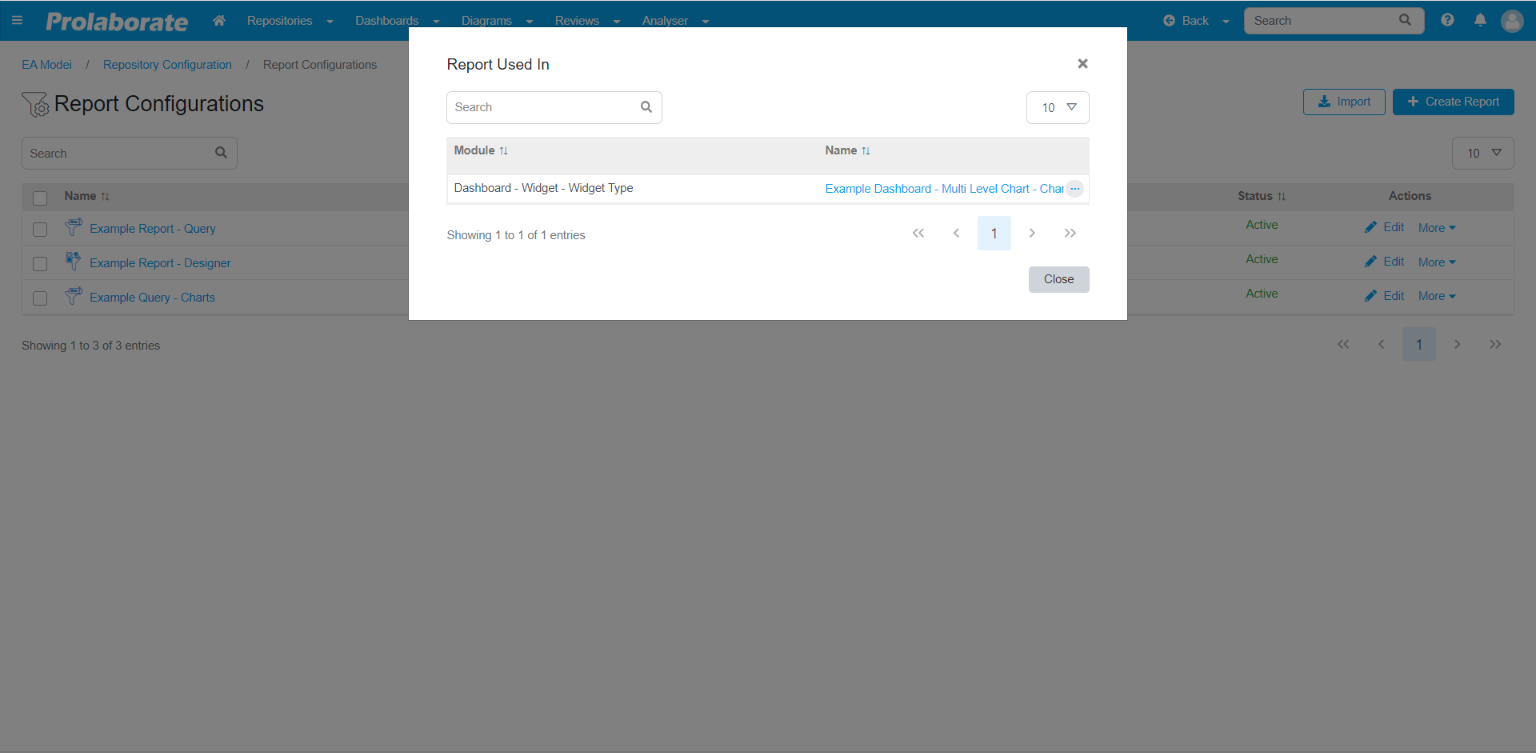
Click on the number to open the popup window where the name and type of resources where the report is currently mapped. Click on the name to open them.
Manage Reports
Edit Reports
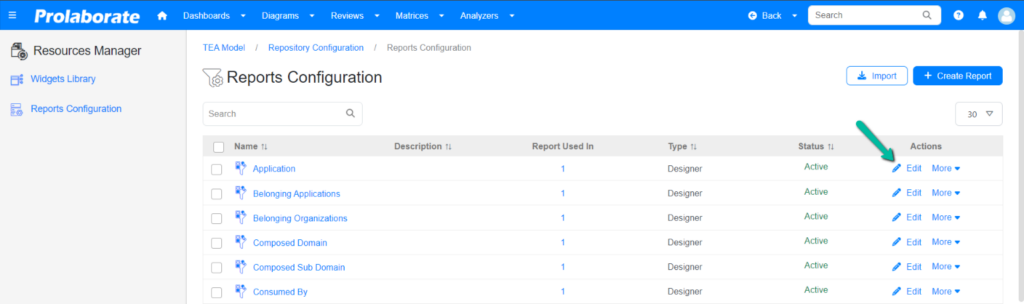
To edit a report, click the name of the report or click Edit option under Actions.
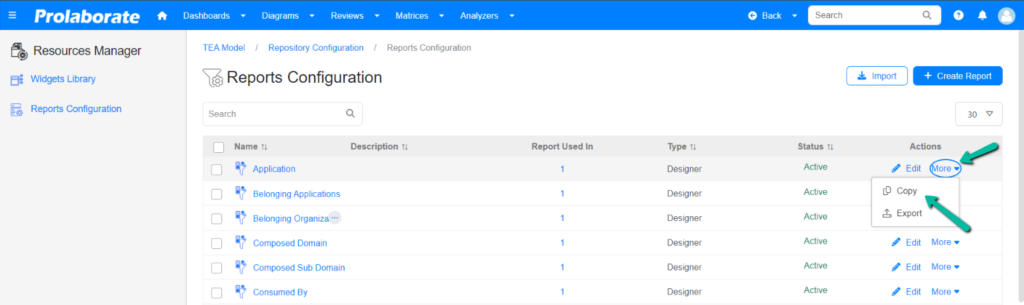
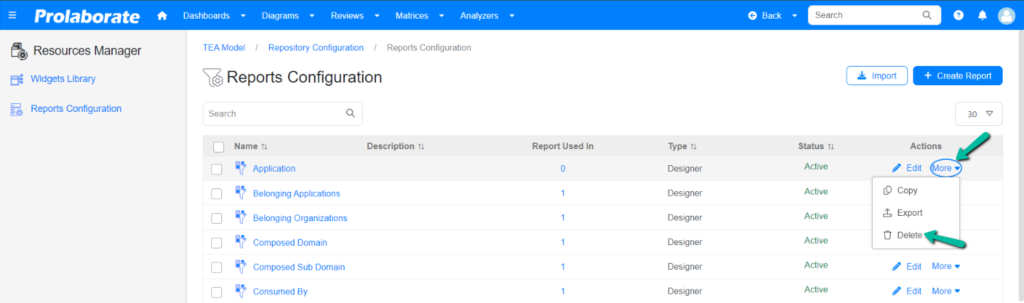
Copy Reports
To copy reports, click Copy option under Actions in the reports configuration page.
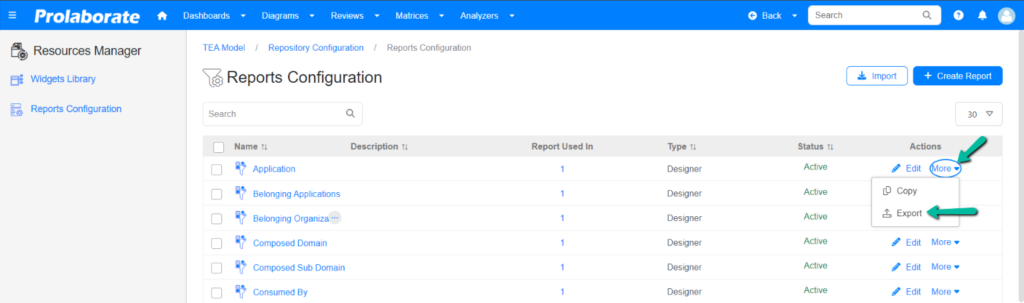
Export Reports
To export reports, click Export option under Actions in the report configuration page.
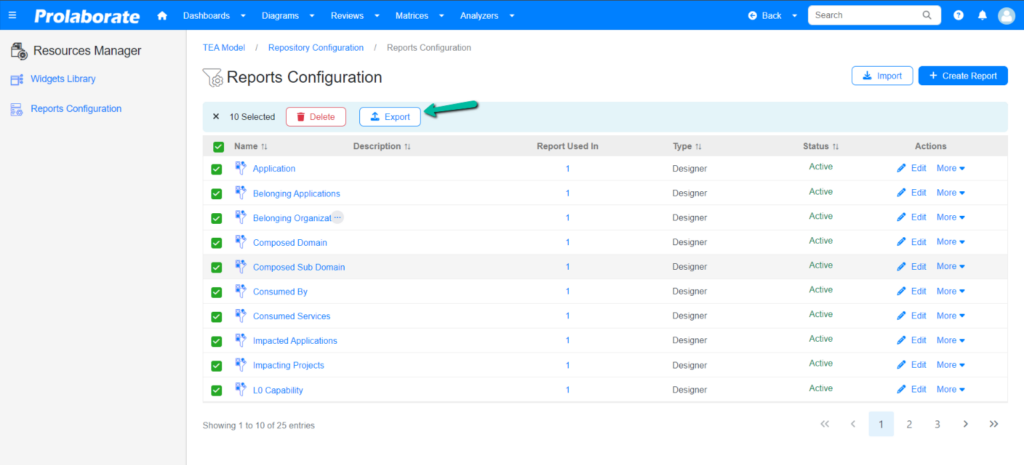
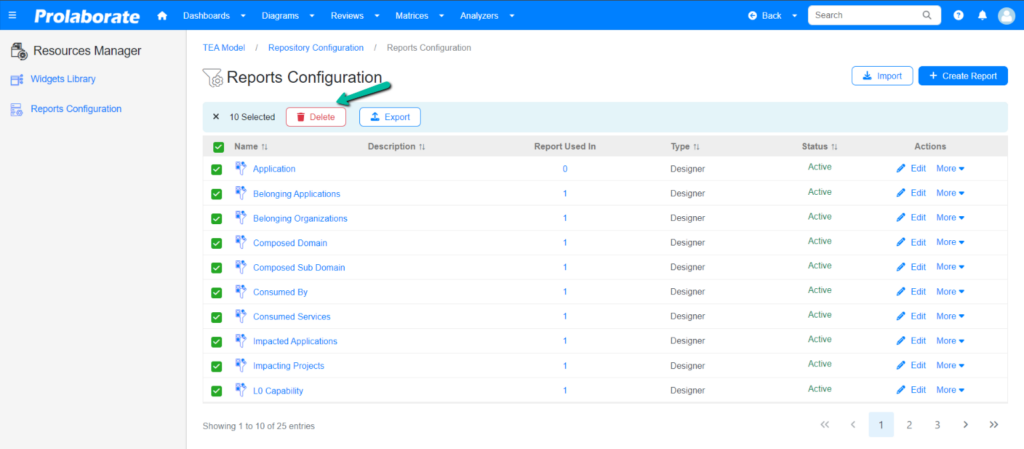
Reports can be exported in batches.
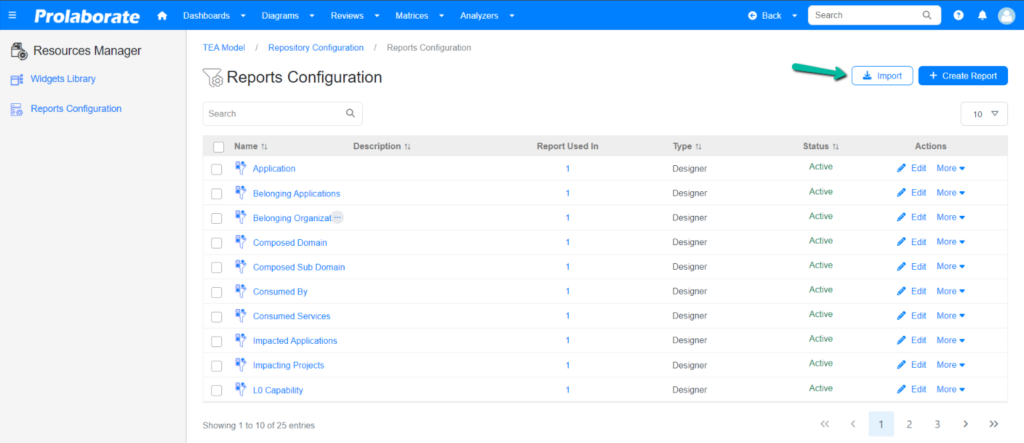
Import Reports
To import reports, click Import in the reports configuration page. Note that existing reports cannot be imported.
Delete Reports
To delete reports, click Delete option under Actions in the reports configuration page.
Reports can be deleted in batches.
The delete option will not be available for reports which are used to configure a Prolaborate resource.