Build Enterprise Architect Reports
Build Enterprise Architect Reports
Prolaborate lets you create dynamic reports quickly from your EA model data.
In this guide, we will look at how you can build live reports.
Note that we will be looking at only the capabilities of report widgets in this guide; please refer to Dashboard Designer to learn about the general functionalities of the dashboard.
Create Reports using Designer
You can create a report from through Report Designer or SQL Queries. In this section we will look at how you can create a report using Report Designer.
Click on Menu > Dashboards.
Click on Add New to add a dashboard or click on Edit icon on an existing dashboard.
Click on Add Widget, select EA Report widget from the list of widgets and click on Add New Widget.


Creating a report involves two steps:
- First you need to select the packages that hold the data for the report you are going to create.
- Then you can apply the filters. You can filter by Type, Base Type and stereotype.
- Customizing the EA report by modifying the look & feel of the EA report
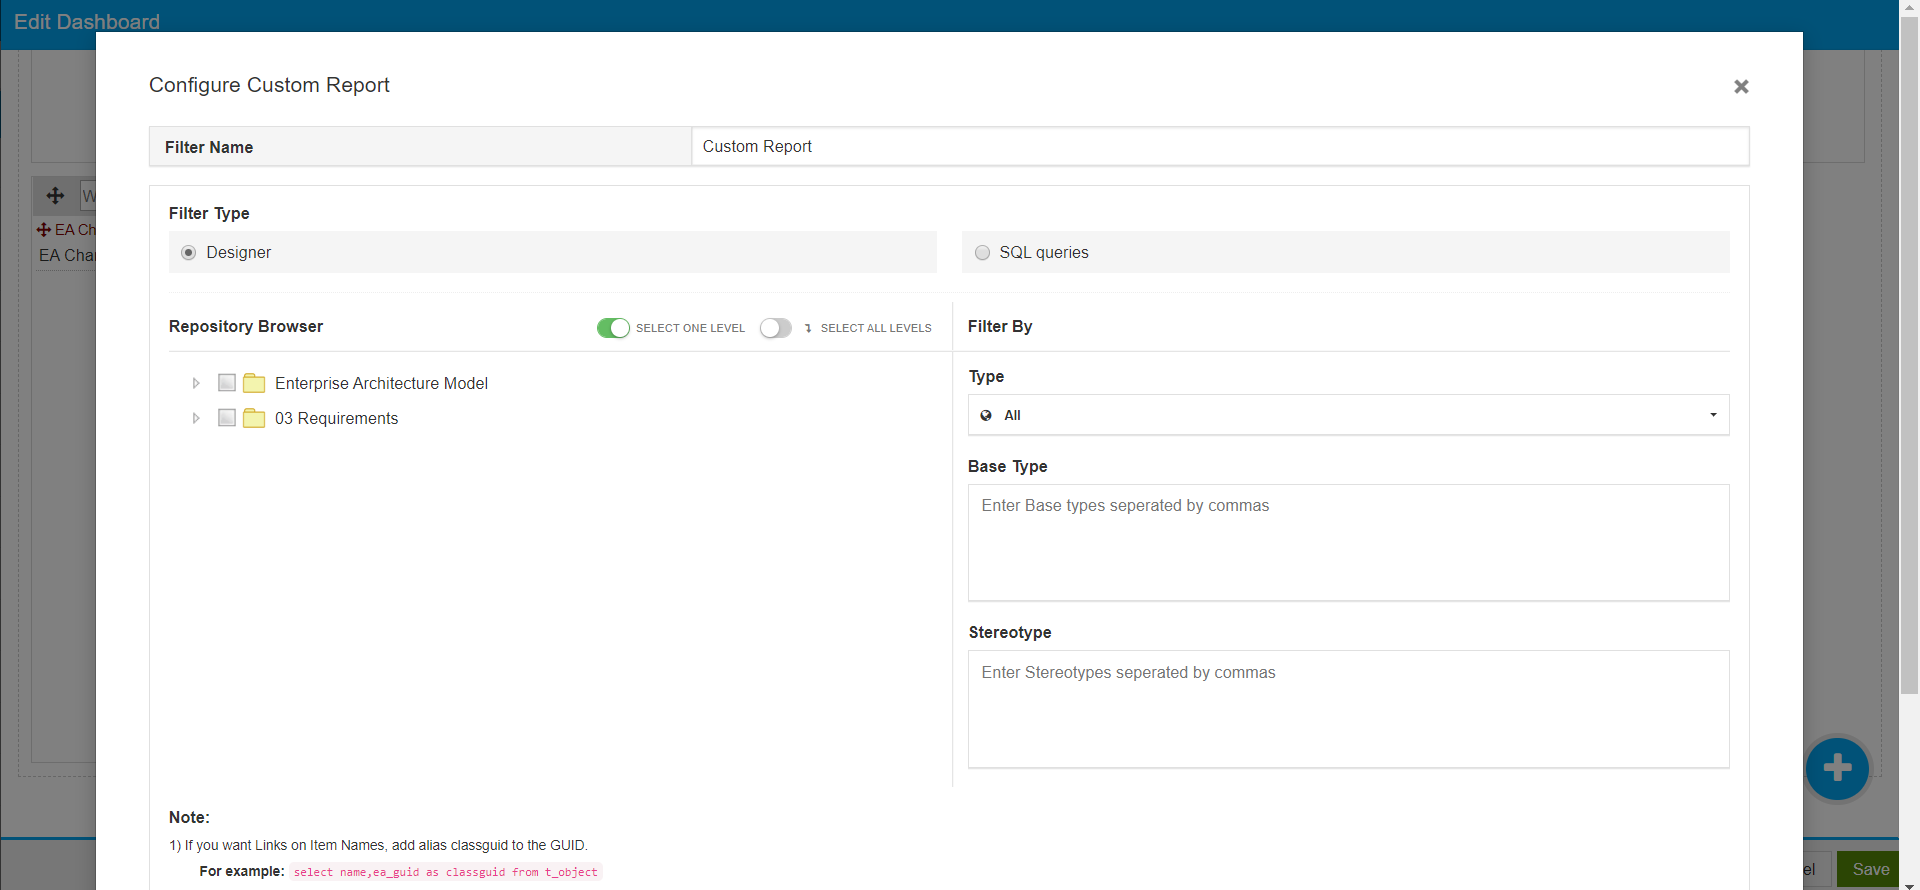
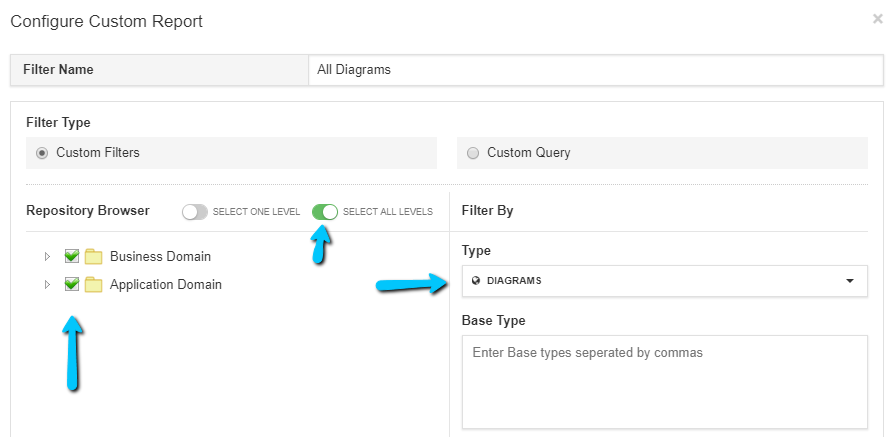
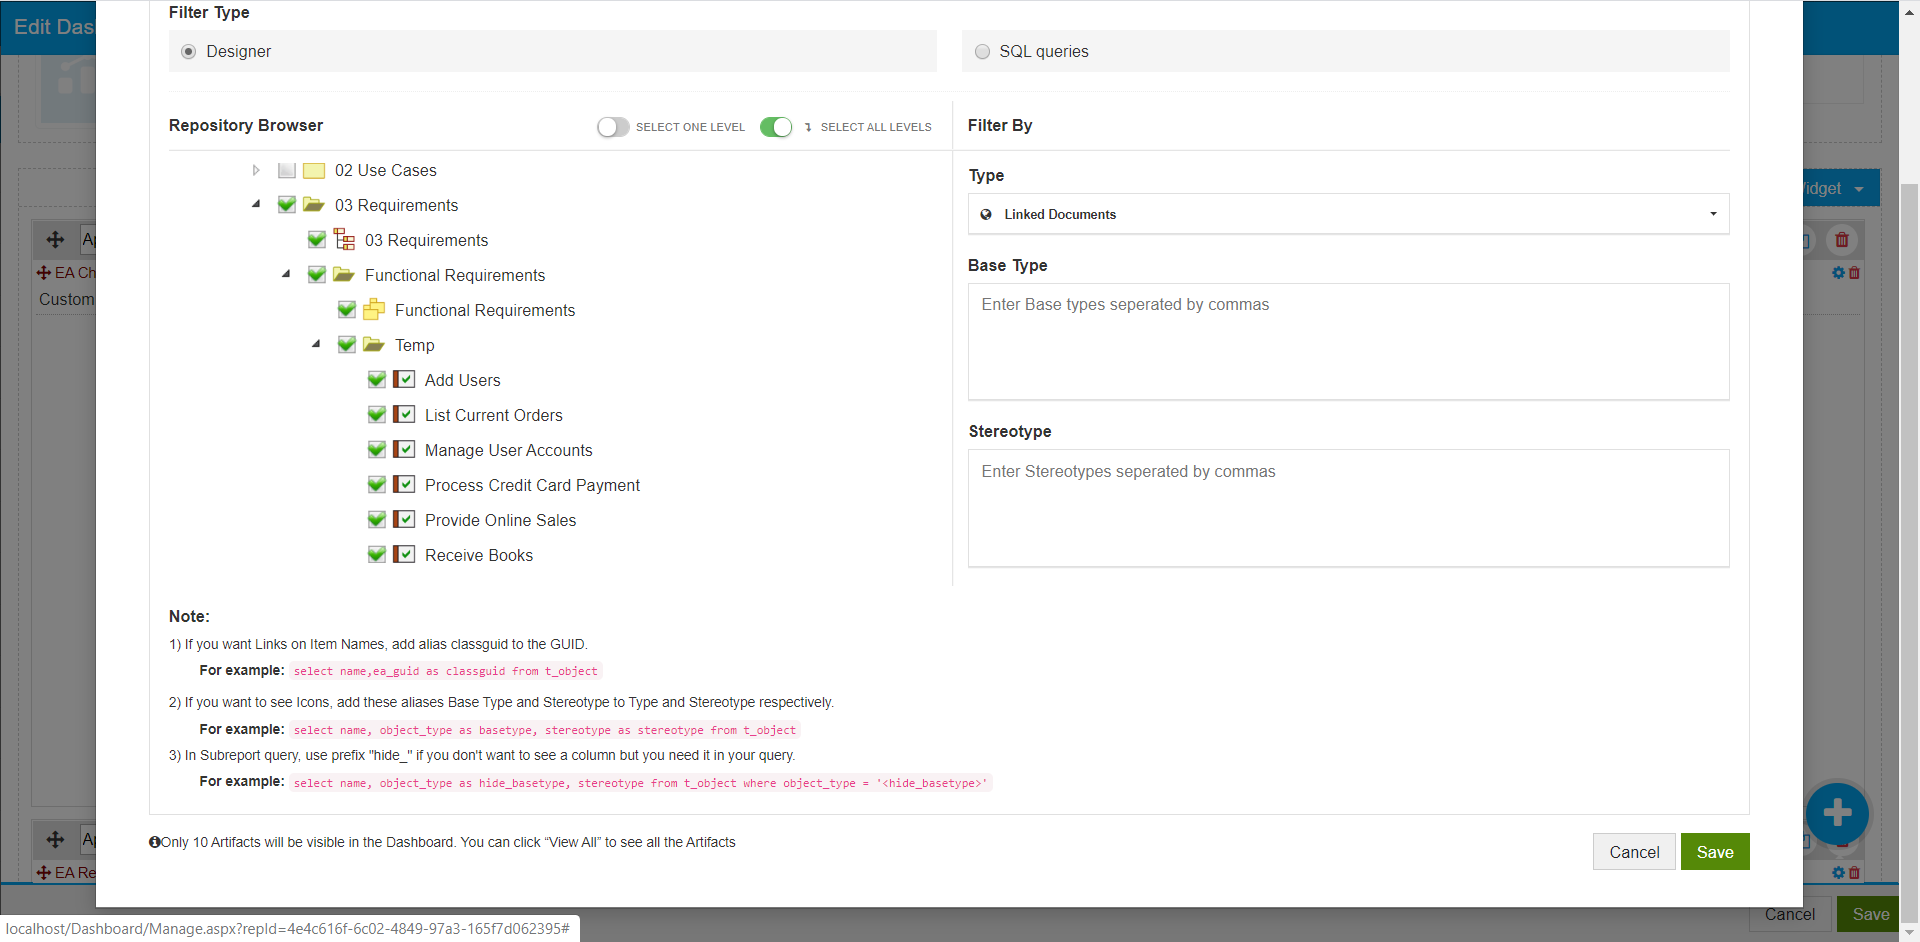
Step 1
Enable Select One Level toggle if you want to select a package and its contents up to one level.
Enable Select All Levels toggle if you want to select all the items under it (including sub packages and elements in it) when you select a package.
For example, enable Select All Levels and click on Enterprise Architecture Model to select everything under it.
Step 2
The following filters are available:
- TypeThe types available are:
- All
- Diagrams
- Packages
- Elements
- Linked Documents
- Embedded documents
- Base TypeYou can either enter the base type or choose from the dropdown
- StereotypeYou can either enter the stereotype name or choose from the dropdown.
Step:3
Modify Look & Feel
This section will let you customize each column of EA reports and its value with color, text format, etc. to make it more appealing to the audience.
Below are the steps to customize the report
- Click on “Add Column”
- Column Name: Mention the alias name of the EA report header name
- Enter the row value of the column which you want to customize
- Enter the HTML style such as color, font, size etc
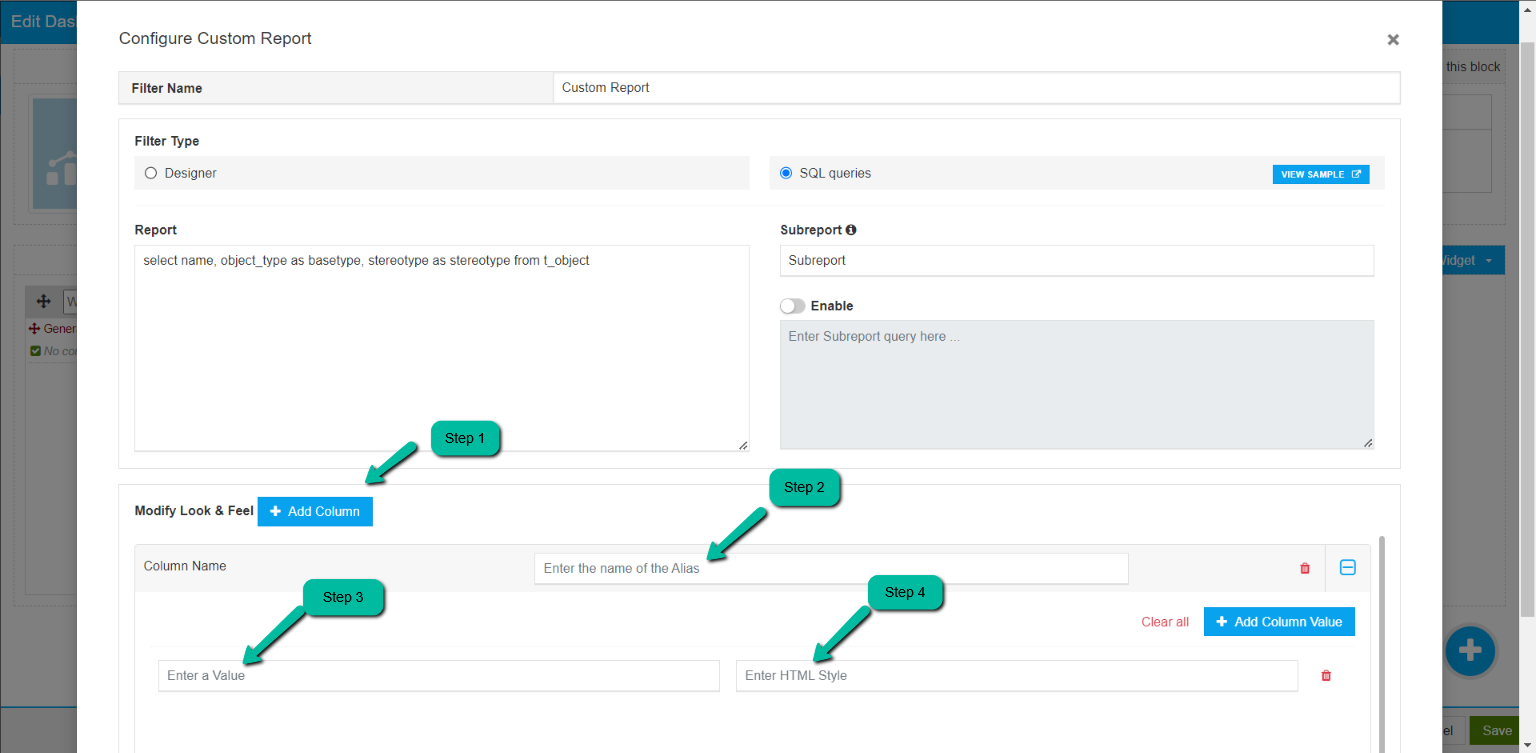
Below is the screenshot in which the EA report column and its value has been customized
Sample Reports created using Report Designer
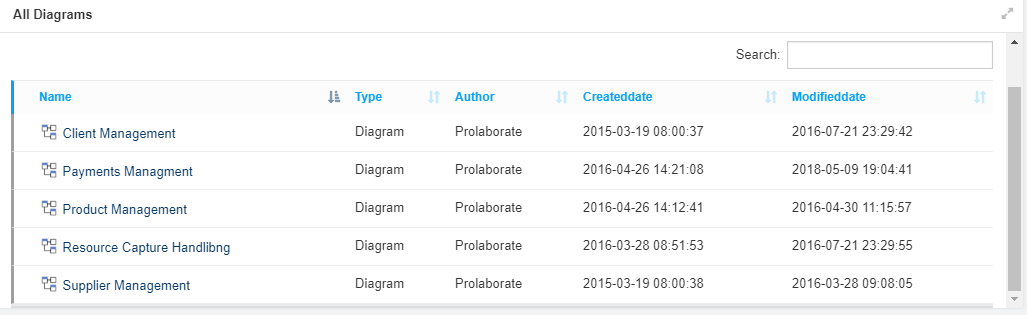
- List of all diagrams in the Model
Configuration
Result
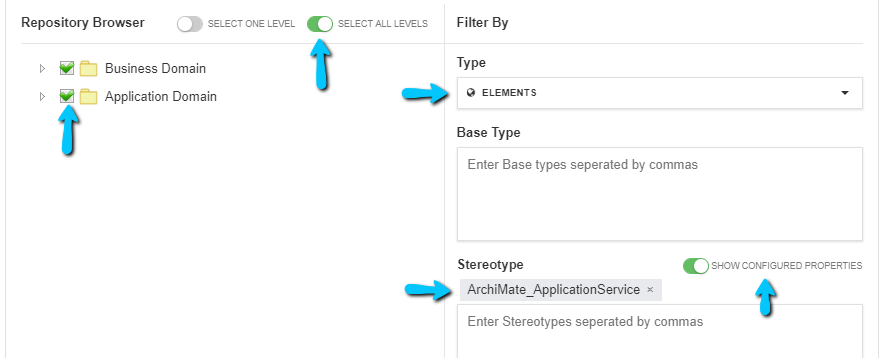
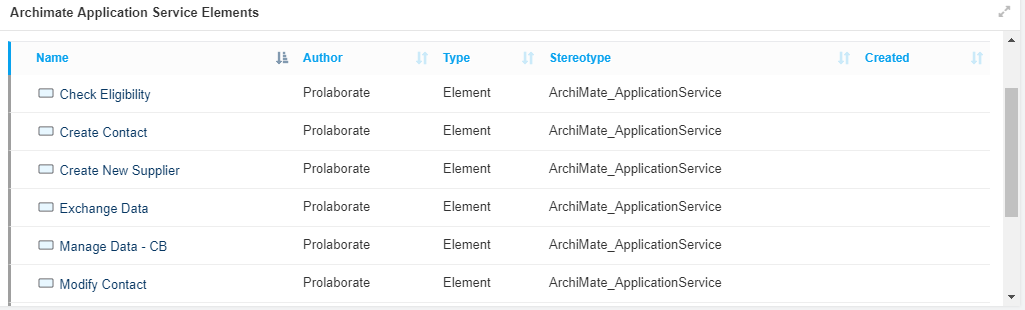
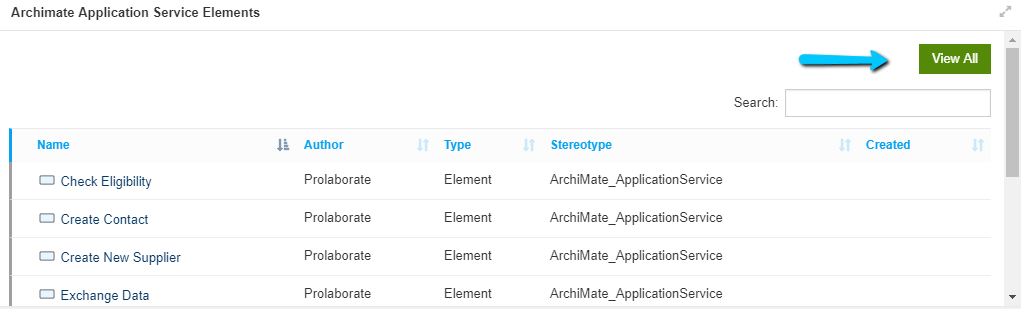
2. List of all Elements with Archimate Application Service as Stereotype. (Table Columns will be shown as per the configuration in Form Designer. Read about Form Designer in this link)
Configuration
Result
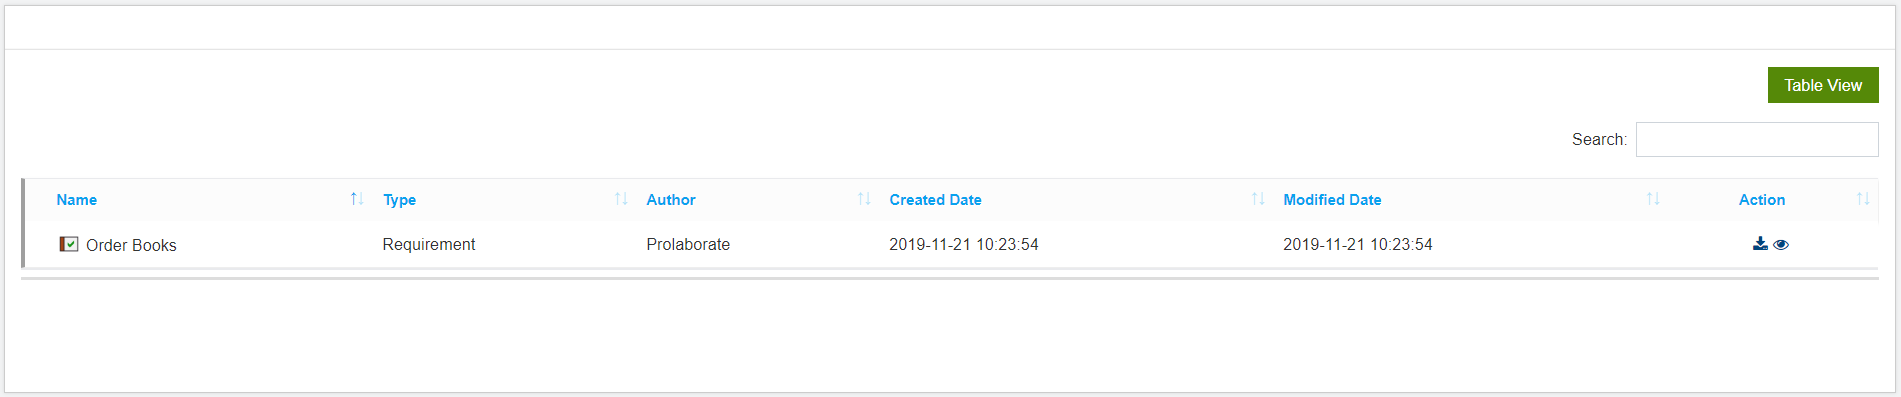
3. Create a report of linked documents in a package. You can view and download the documents from the dashboard. You can create a report of embedded documents in a similar way.
Configuration
Result
Create Advanced Reports using SQL Queries
You can change the filter type to SQL queries to enter queries to create advanced reports.
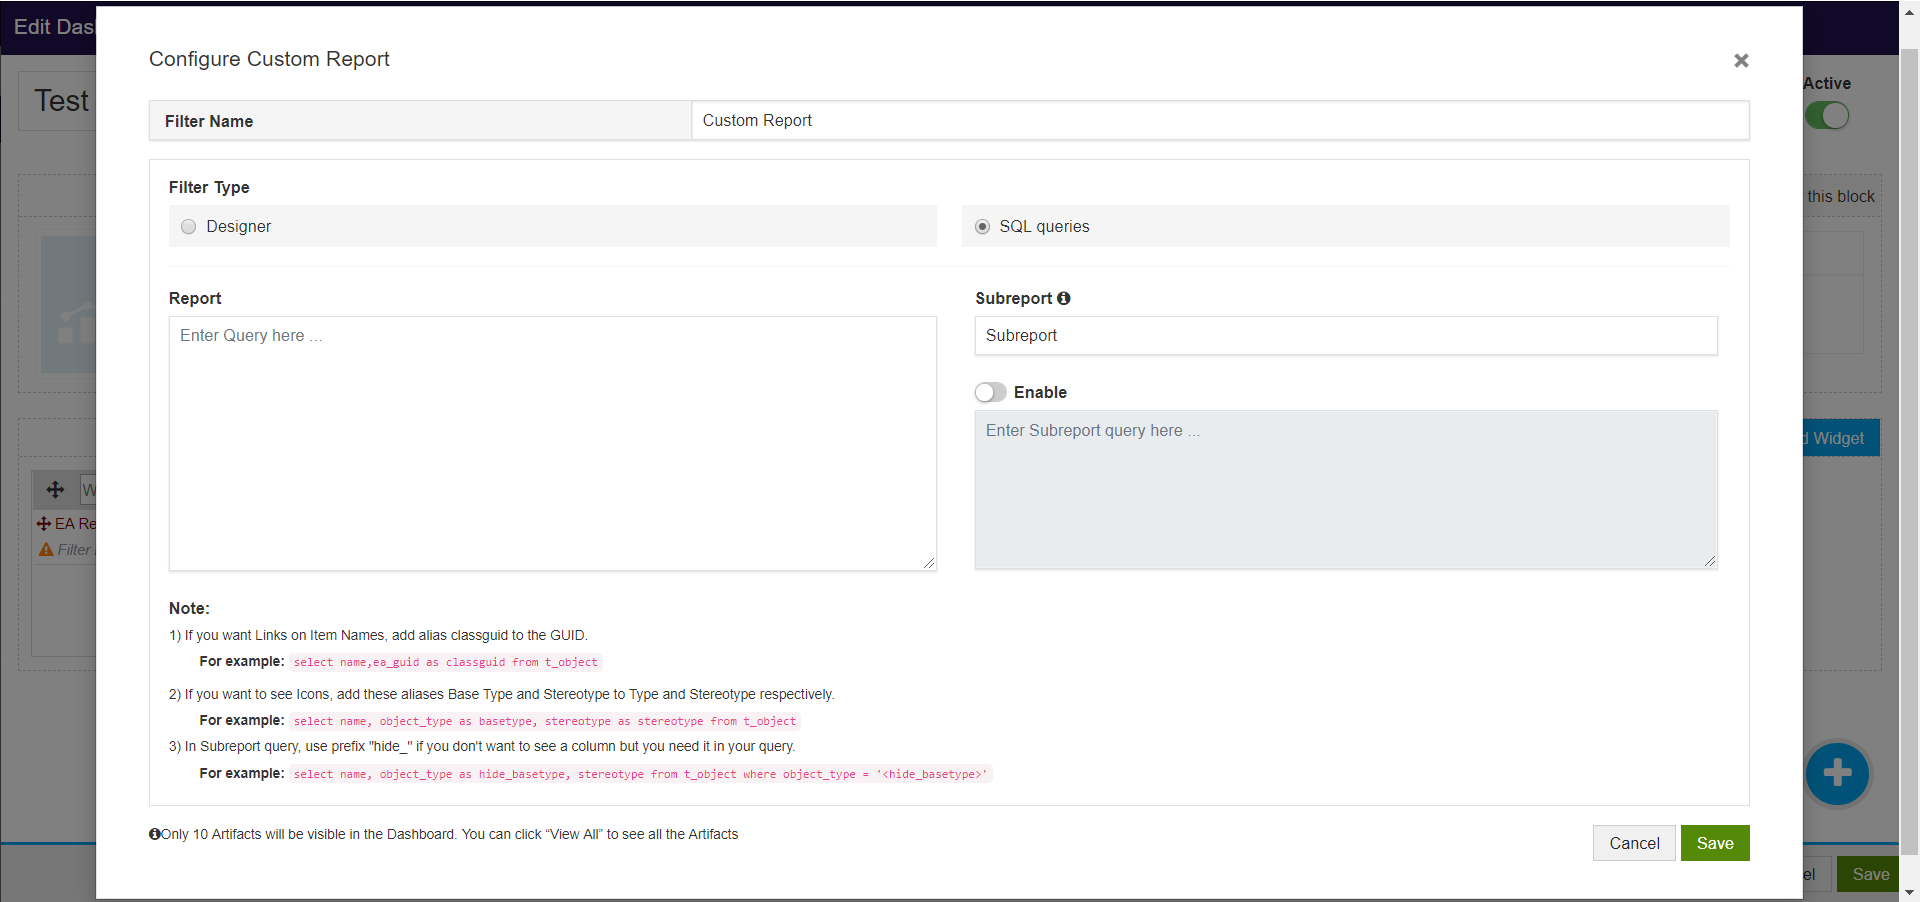
If you want to see a subreport based on the data in your report, you can enter a query in “Subreport” field.
You can give a name to the Subreport column to make it self-explanatory to your users.
All the columns you will be using in your “where” part of Subreport query must be in “select” part of Report query.
For example, if you want to use object_type and stereotype in your “where” statement of Subreport query, you need to define the Report query as follows:
Sample Report query:
select name, object_type as basetype, stereotype as sttype from t_object
Sample Subreport query:
select name, status, priority from t_object where object_type = ‘’ and stereotype = ‘’
You can use the following aliases if necessary:
- If you want links on the names of EA objects, add alias classguid to the GUID. For example:
select name,ea_guid as classguid from t_object
2. If you want to see appropriate EA Icons, add these aliases Base Type and Stereotype to Type and Stereotype respectively. For example:
select name, object_type as basetype, stereotype as stereotype from t_object
3. If you don’t want to see a column but you need to use it in your “Where” query or as an “alias” as mentioned above, use “hide_” prefix. For example, the following query will give the same result as above but Base Type and Stereotype columns will not be shown in the result:
select name, object_type as hide_basetype, stereotype as hide_stereotype from t_object
Step:3
Modify Look & Feel
This section will let you customize each column of EA reports and its value with color, text format, etc. to make it more appealing to the audience.
Below are the steps to customize the report
- Click on “Add Column”
- Column Name: Mention the alias name of the EA report header name
- Enter the row value of the column which you want to customize
- Enter the HTML style such as color, font, size etc
Below is the screenshot in which the EA report column and its value has been customized
Alias Usage:
You can mention the alias name within double quotes with space, and with mixed cases.
Sample Query : Below is the sample query in which the alias name is declared with space and mixed cases
select o.Name as "Display Name", o.note as "Notes", o.ModifiedDate as 'MODIFIED', otv.Value as Lifecycle, o.ea_guid as CLASSGUID, o.Object_Type as hide_BaseType, o.Stereotype as hide_Stereotype from ( t_object o left join t_objectproperties otv on otv.Object_ID = o.Object_ID) where otv.Property = 'Lifecycle'
Below is the screenshot which shows the alias name is displayed with space and with mixed cases.
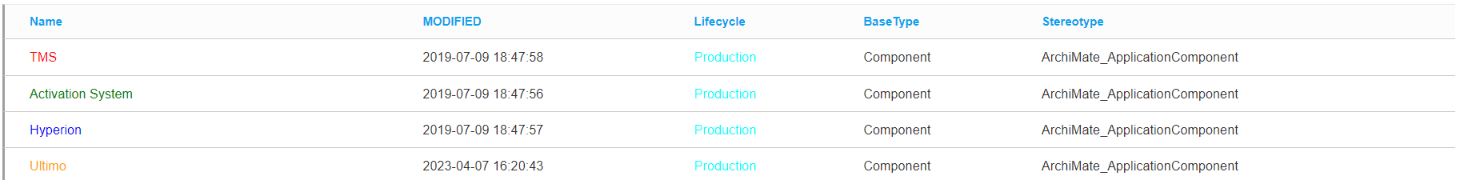
Clickable Column
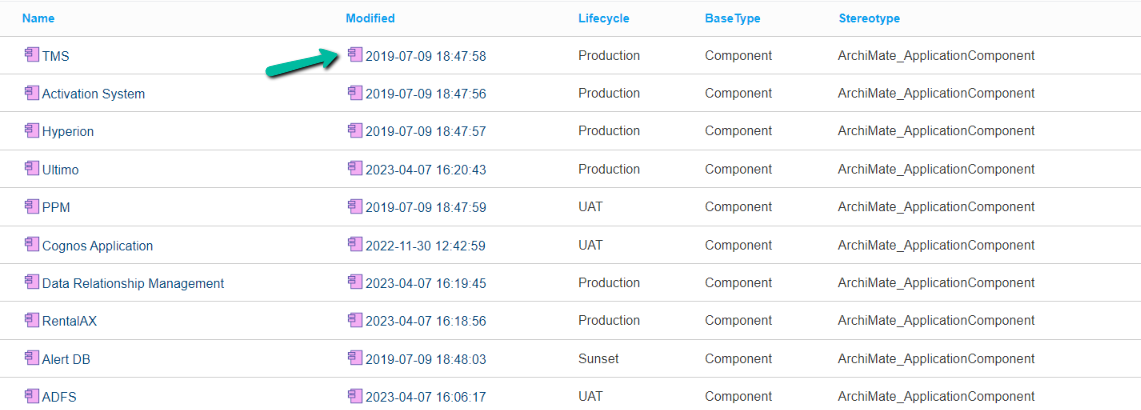
To make the column clickable in the table view add “clickable” followed by the column name in the query. Below is the sample query in which shows the column Modified is defined as clickable.
select o.Name as Name, o.ModifiedDate as clickable_Modified, otv.Value as Lifecycle, o.ea_guid as classguid, o.Object_Type as Basetype, o.Stereotype as Stereotype from ( t_object o left join t_objectproperties otv on otv.Object_ID = o.Object_ID) where otv.Property = 'Lifecycle'
Below is the screenshot in which the column Modified is now clickable
Sample Reports created using SQL Queries
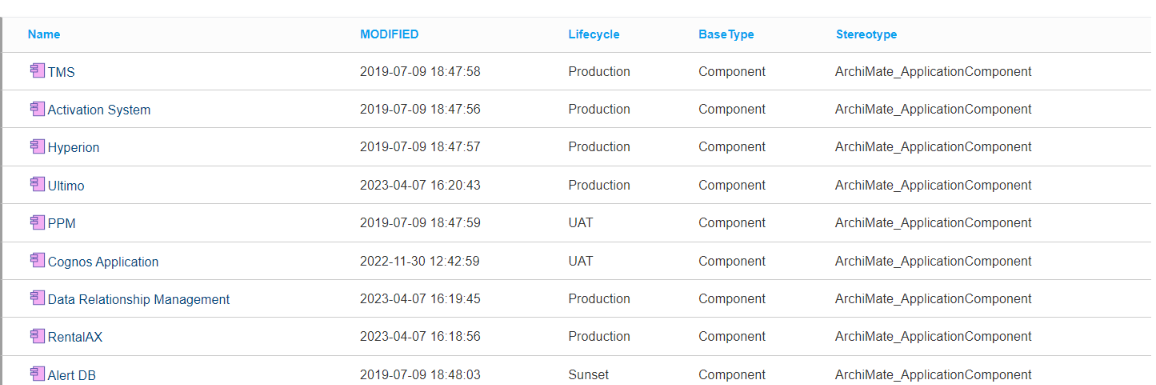
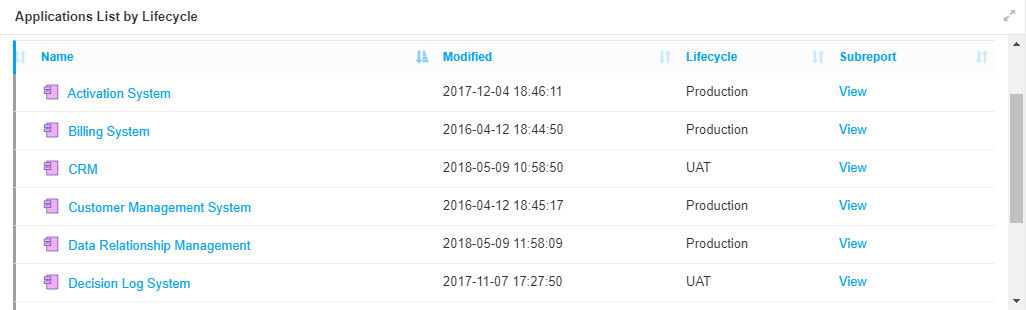
1. Applications List by Lifecycle
Report Query
select o.Name as Name, o.ModifiedDate as Modified, otv.Value as Lifecycle, o.ea_guid as CLASSGUID, o.Object_Type as hide_BaseType, o.Stereotype as hide_Stereotype from ( t_object o left join t_objectproperties otv on otv.Object_ID = o.Object_ID) where otv.Property = 'Lifecycle'
Report in Dashboards
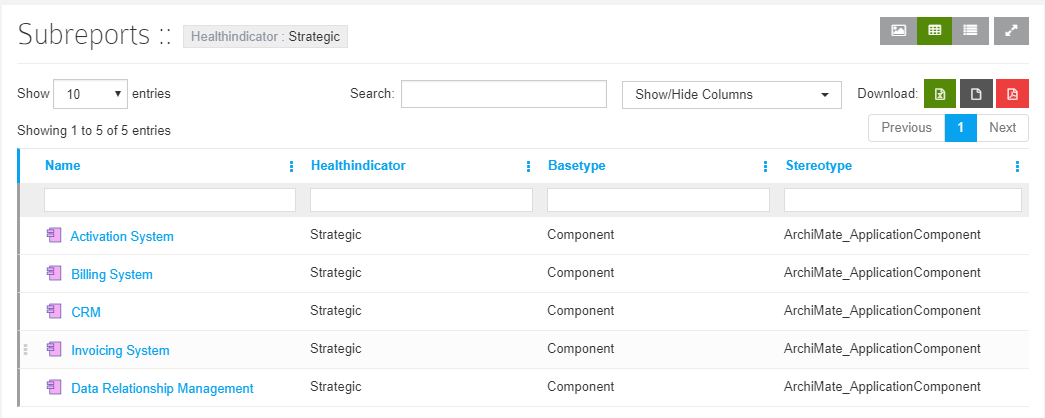
Subreport Query
select o.Name as Name, o.ModifiedDate as Modified, otv.Value as Lifecycle, o.ea_guid as CLASSGUID, o.Object_Type as hide_BaseType, o.Stereotype as hide_Stereotype from ( t_object o left join t_objectproperties otv on otv.Object_ID = o.Object_ID) where otv.Property = 'Lifecycle' and otv.value = ''
Complete Subreport
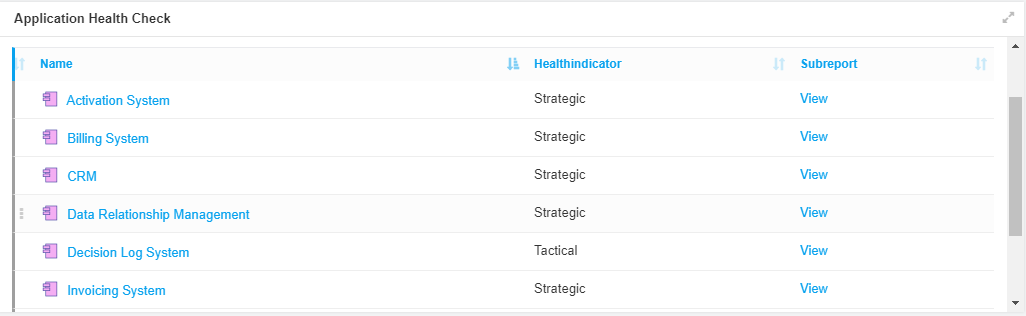
2. Application Health Check
Query
select o.Name as Name, tv1.Value as HealthIndicator, o.ea_guid as Classguid, o.Object_Type as hide_BaseType, o.Stereotype as hide_Stereotype from (t_object o left join t_objectproperties tv1 on tv1.Object_ID = o.Object_ID) where tv1.Property='Health Indicator'
Report in Dashboard
Subreport Query
select o.Name as Name, tv1.Value as HealthIndicator, o.ea_guid as Classguid, o.Object_Type as BaseType, o.Stereotype as Stereotype from (t_object o left join t_objectproperties tv1 on tv1.Object_ID = o.Object_ID) where tv1.Property='Health Indicator' and tv1.value = ''
Complete Subreport
View Complete Report
Click on View All from Dashboard widget to see the full report.
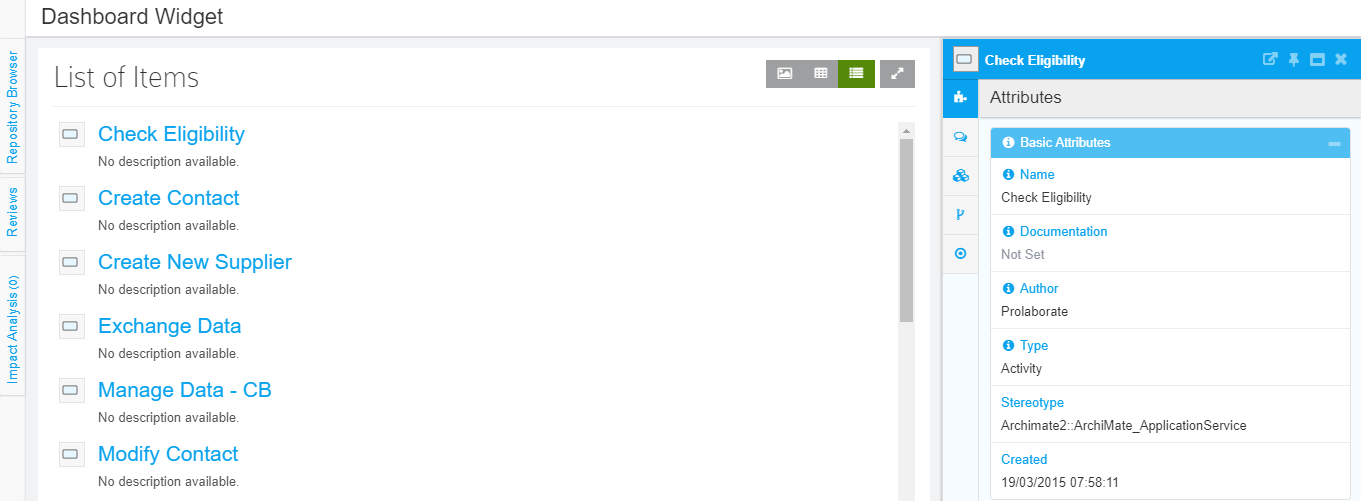
You will be taken to the Table view.
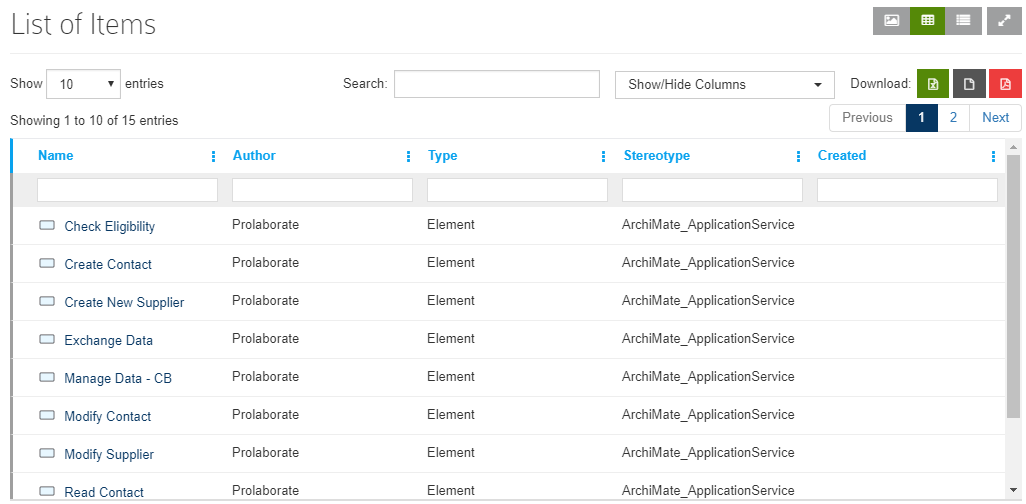
This view will show columns as per configuration in Modeling languages if all the objects in the report are of same Stereotype.
From Table view, you can
- Show 10, 25, 50 or 100 entries at a time
- Search for any text
- Show/Hide columns from the table which you feel are not necessary
- Download the list in xlsx and, csv formats
- View the list in full screen
- Search for text from any single column
- Click on the Name of an element to see its details
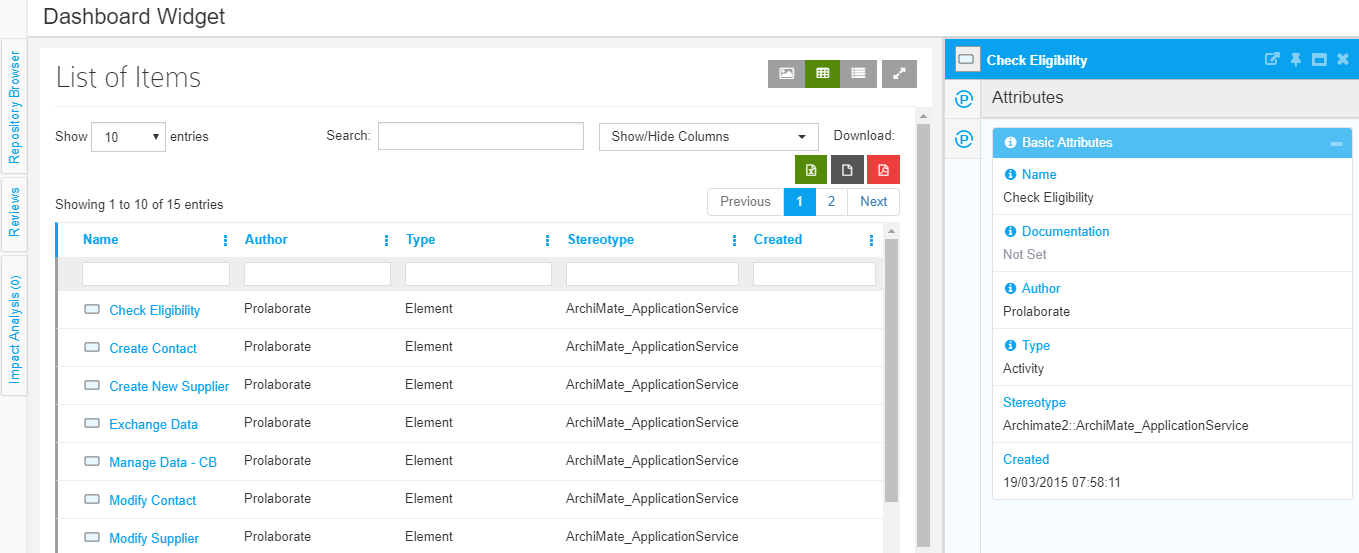
h. Double click on the Name to go to its Overview page
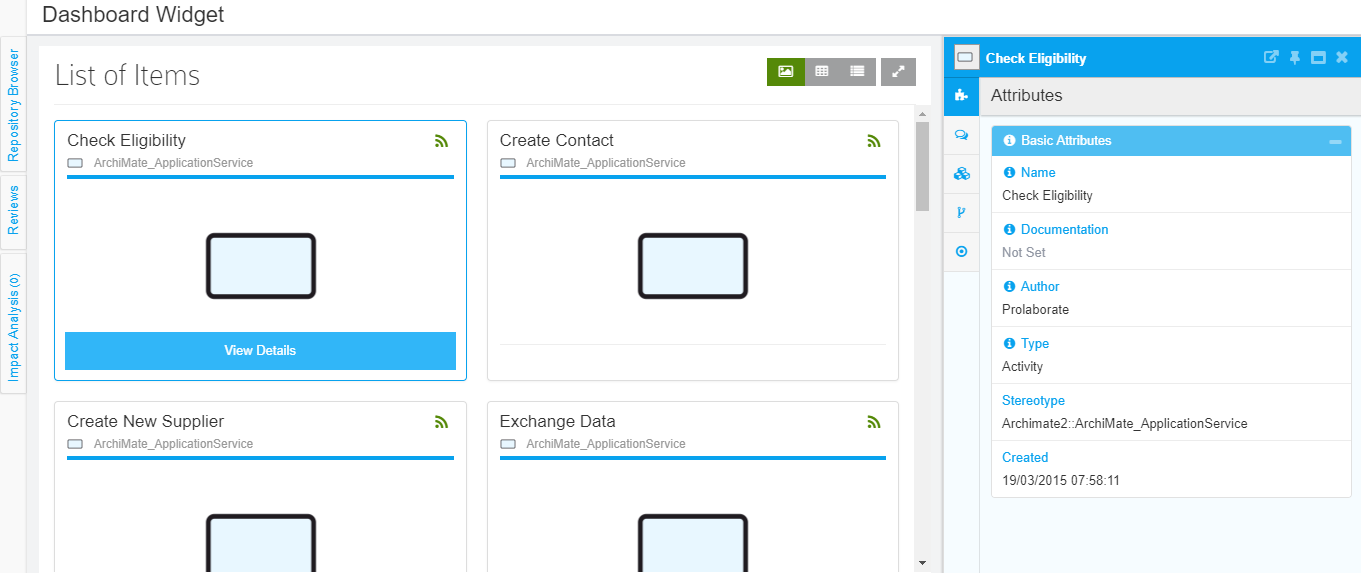
You can switch to Thumb view to see diagram thumbnails in your results.. Click on View details to see their details.
You can also switch to List view to see description of EA objects as well in the primary view. Click on the Name to see its details.