Relationship Matrix
Relationship Matrix
Relationship Matrix helps you visualize, understand, and analyze relationships in your Enterprise Architect models.
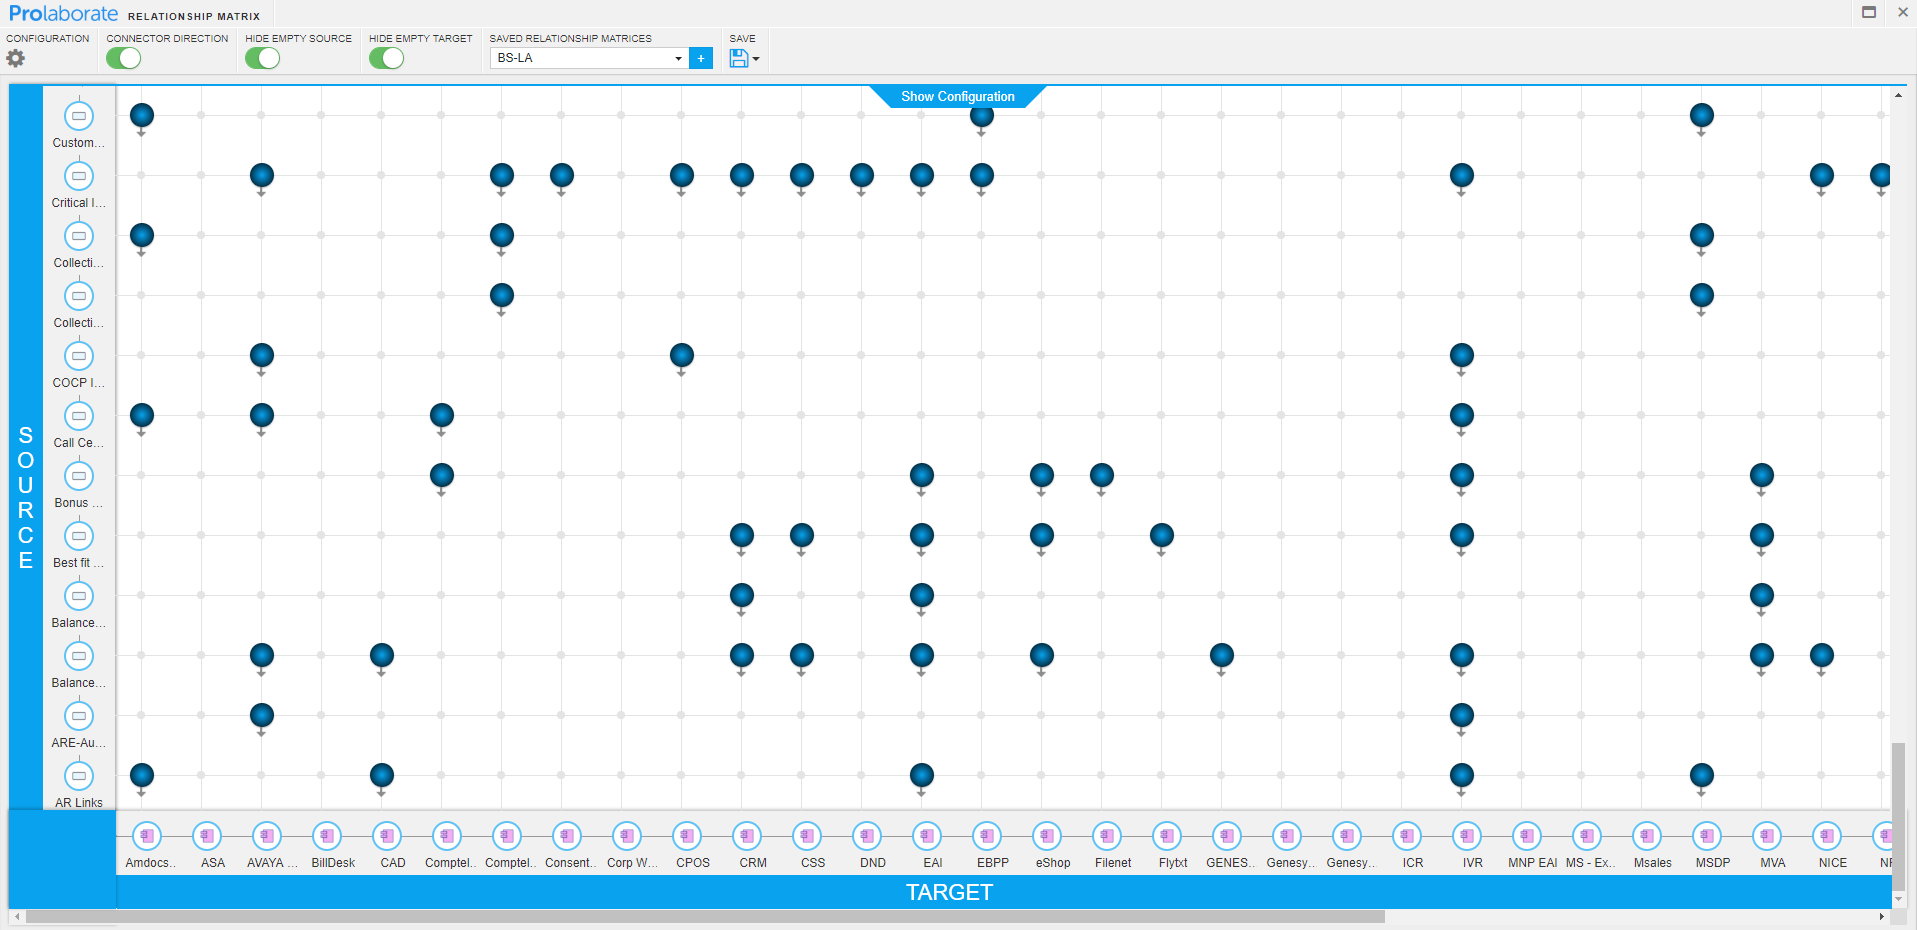
For example, here we are trying to understand how the business processes and applications that are used in an organization are interconnected.


In this guide, we will learn how to use Relationship Matrix to analyze relationships effectively.
Here are the workflows involved:
- Open a Matrix created in Enterprise Architect
- Create a Relationship Matrix
- Configure the Matrix
- Understand the Relationships
Open a Matrix created in EA
Click on Menu > Relationship Matrix.
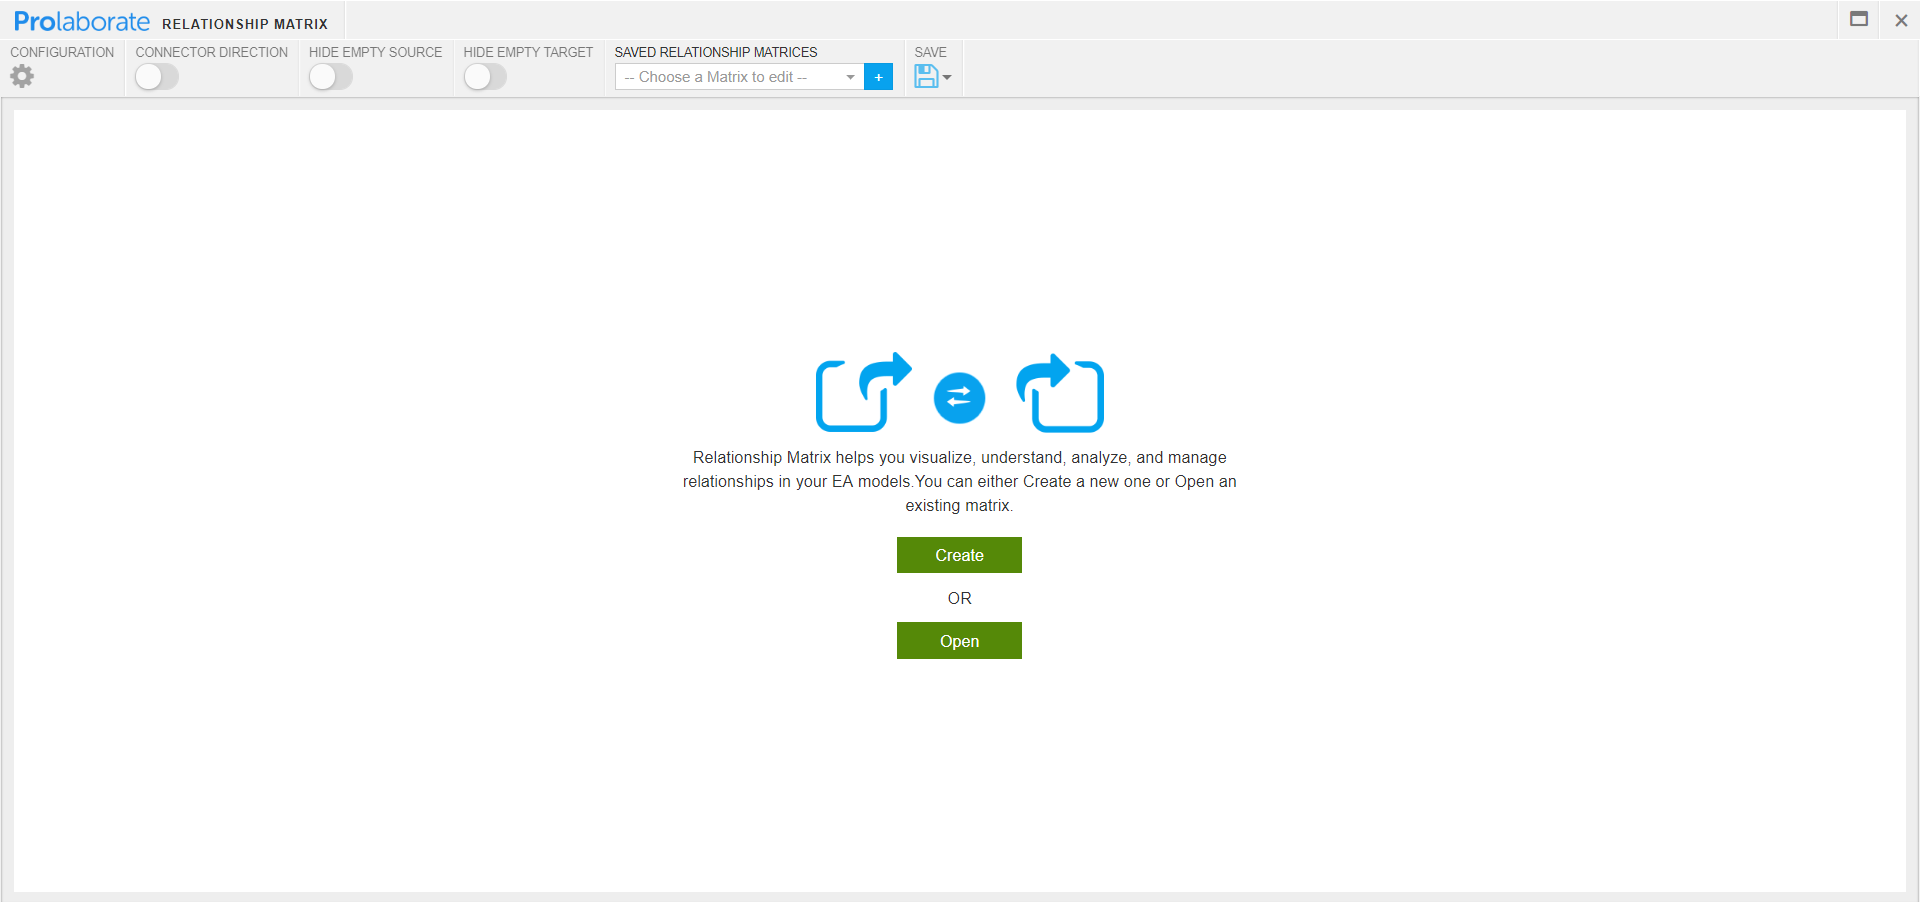
As we want to open a matrix created in Enterprise Architect, click on Open.
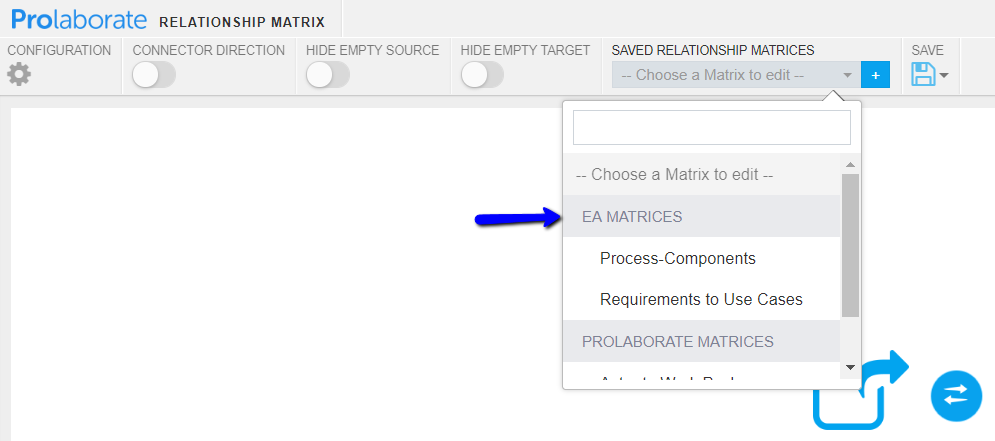
All the matrices created in EA will be listed as shown. Click on an entry to open it.
Retrieving EA matrices is automatic. There is no manual intervention needed.
Here is how it looks like in Enterprise Architect:
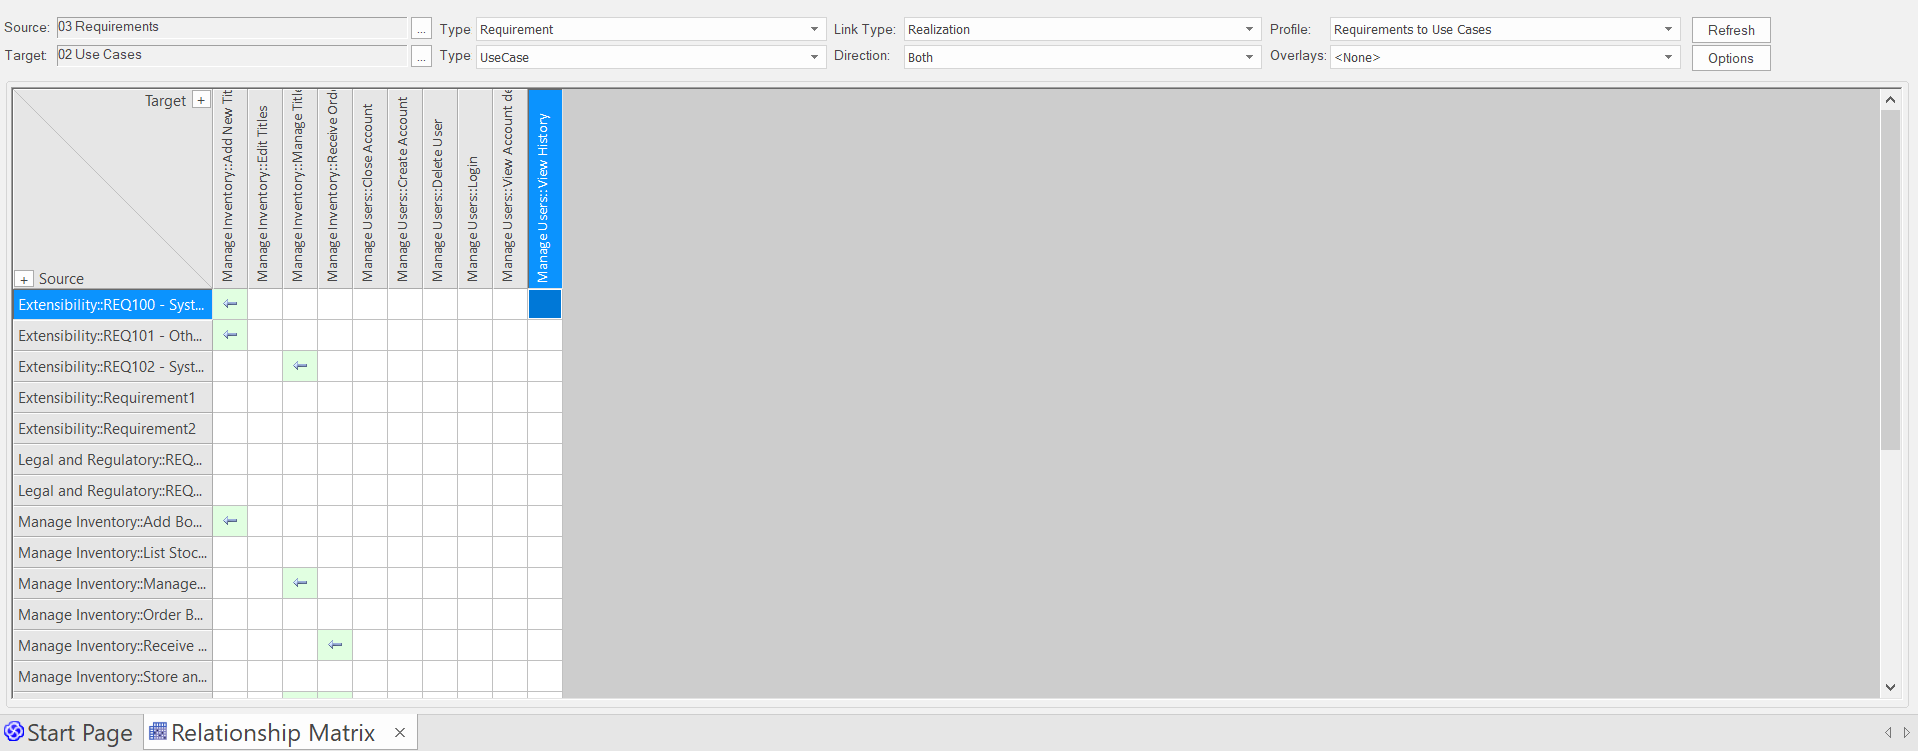
As you notice, even the settings in Prolaborate are retrieved as it is in EA.
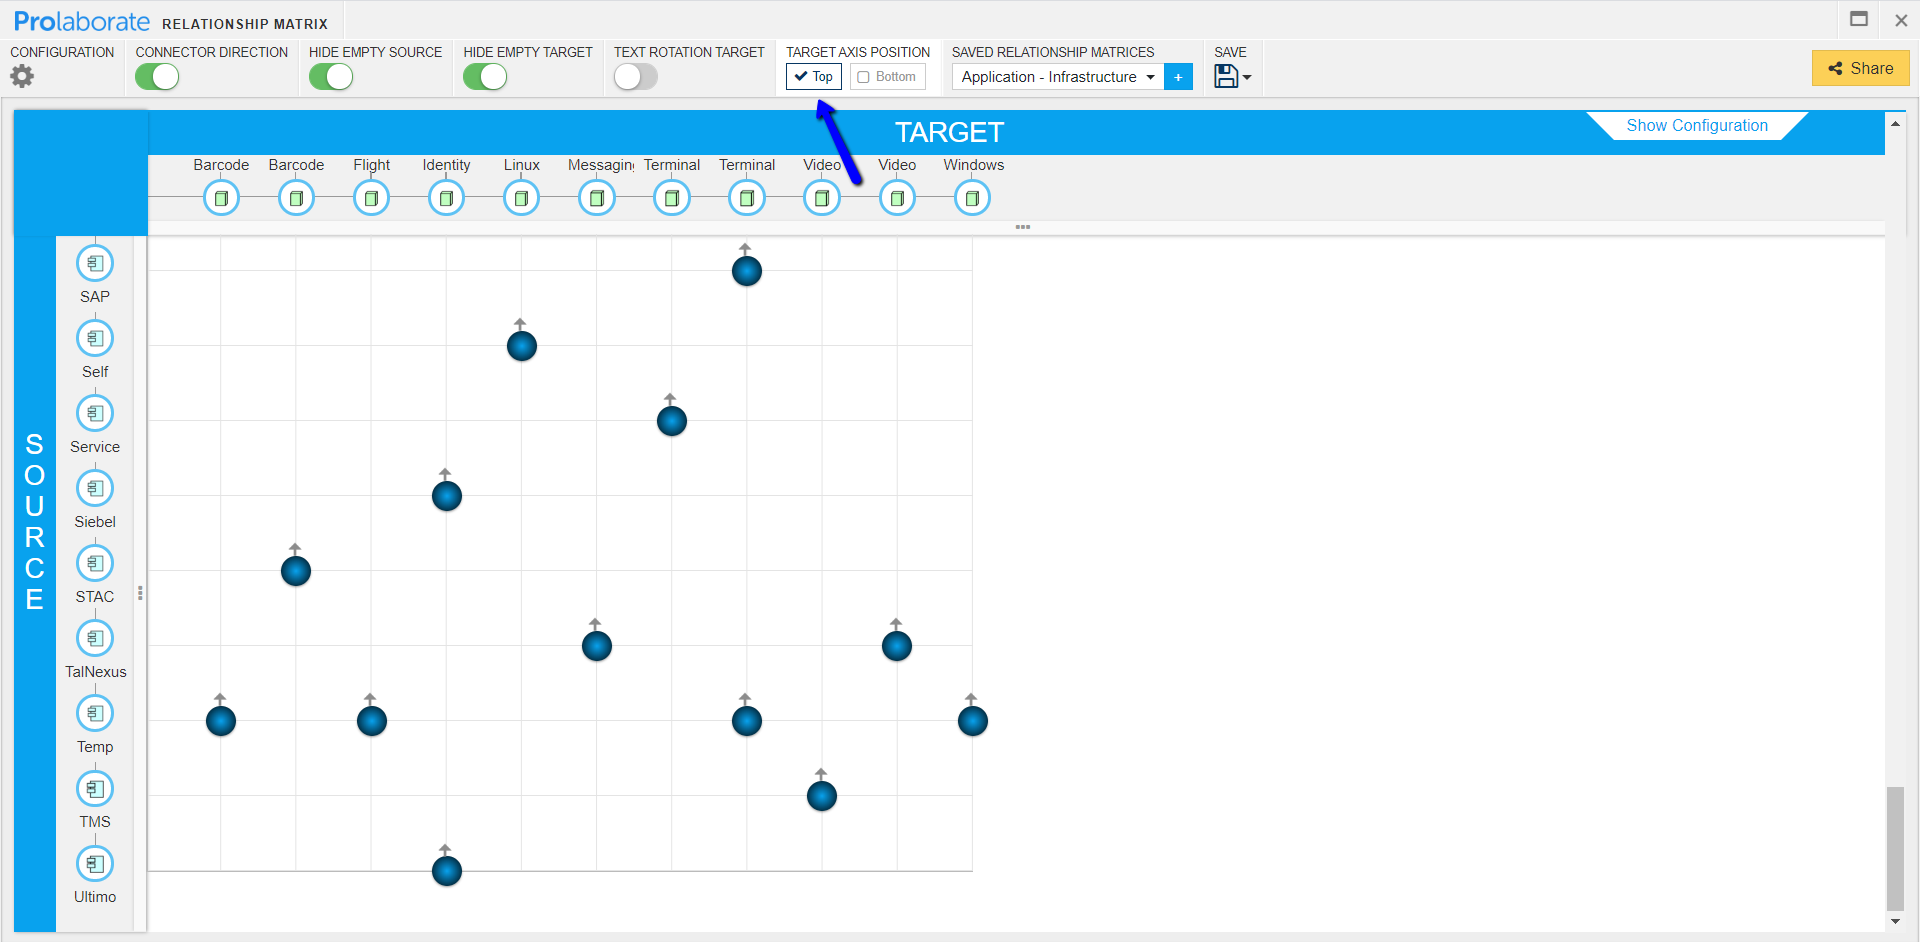
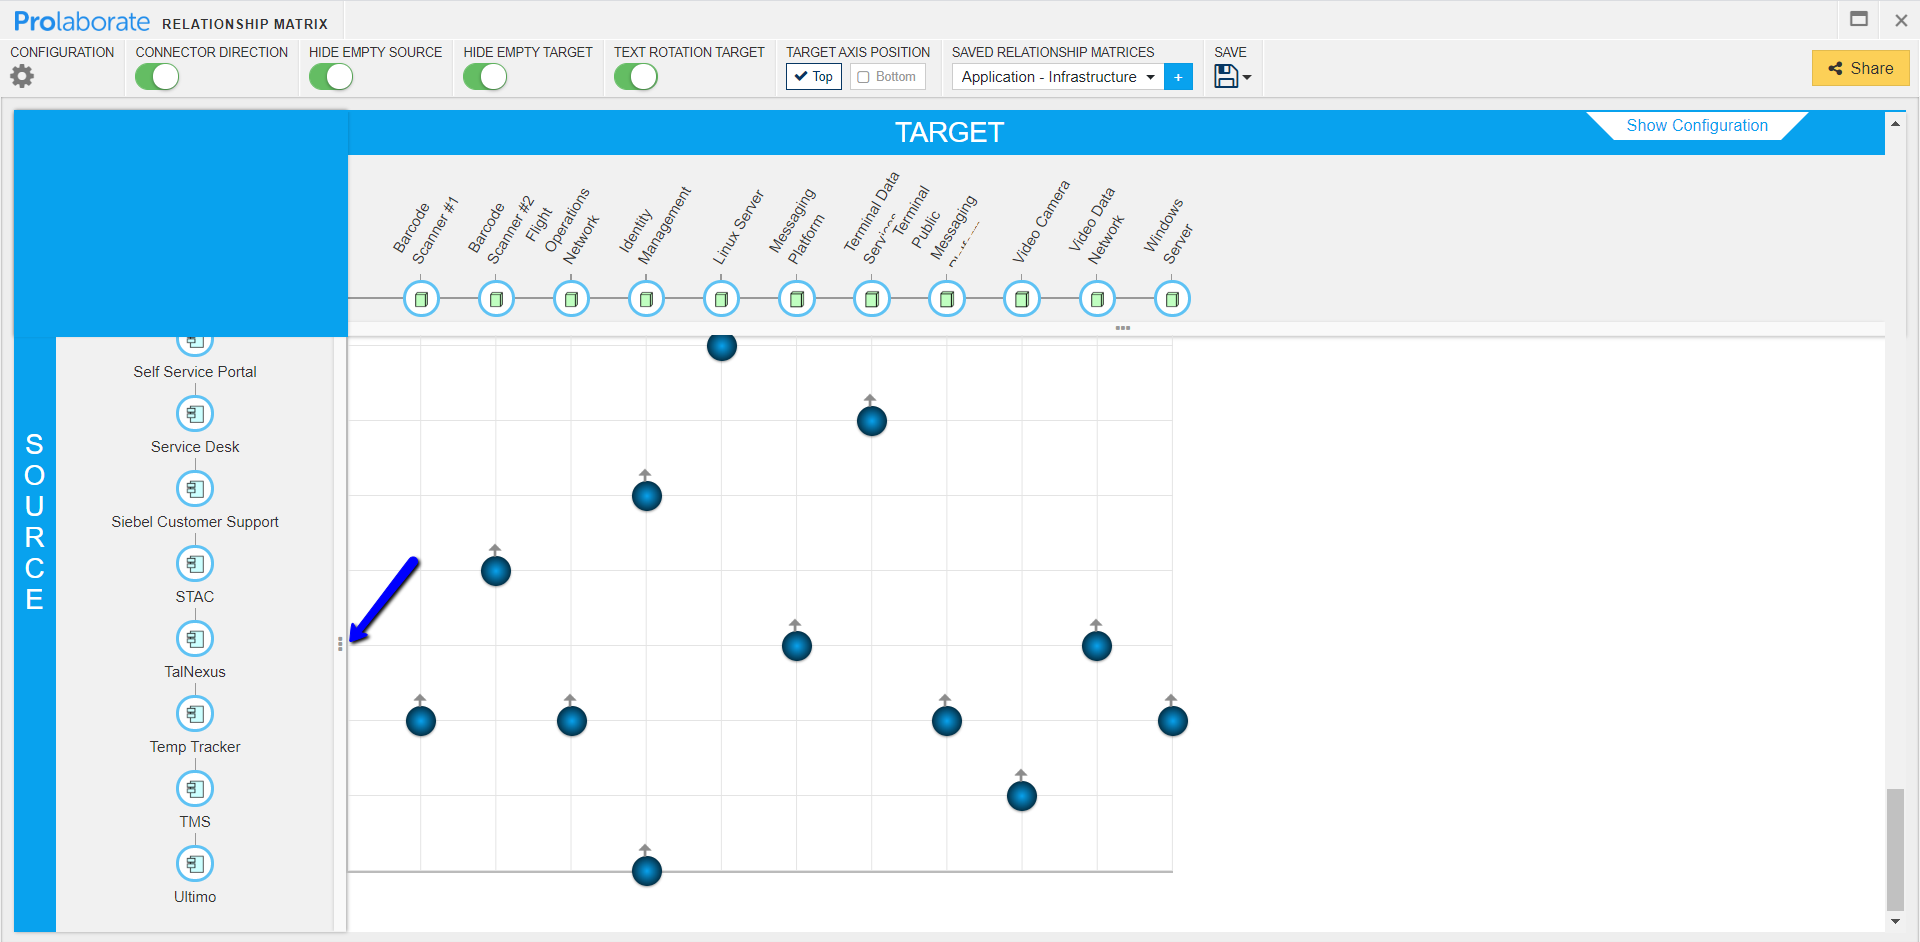
If you want to change the axis to be same as in EA, click on Top as shown below:
If the names of the elements are long, you can view them by
enabling Text Rotation
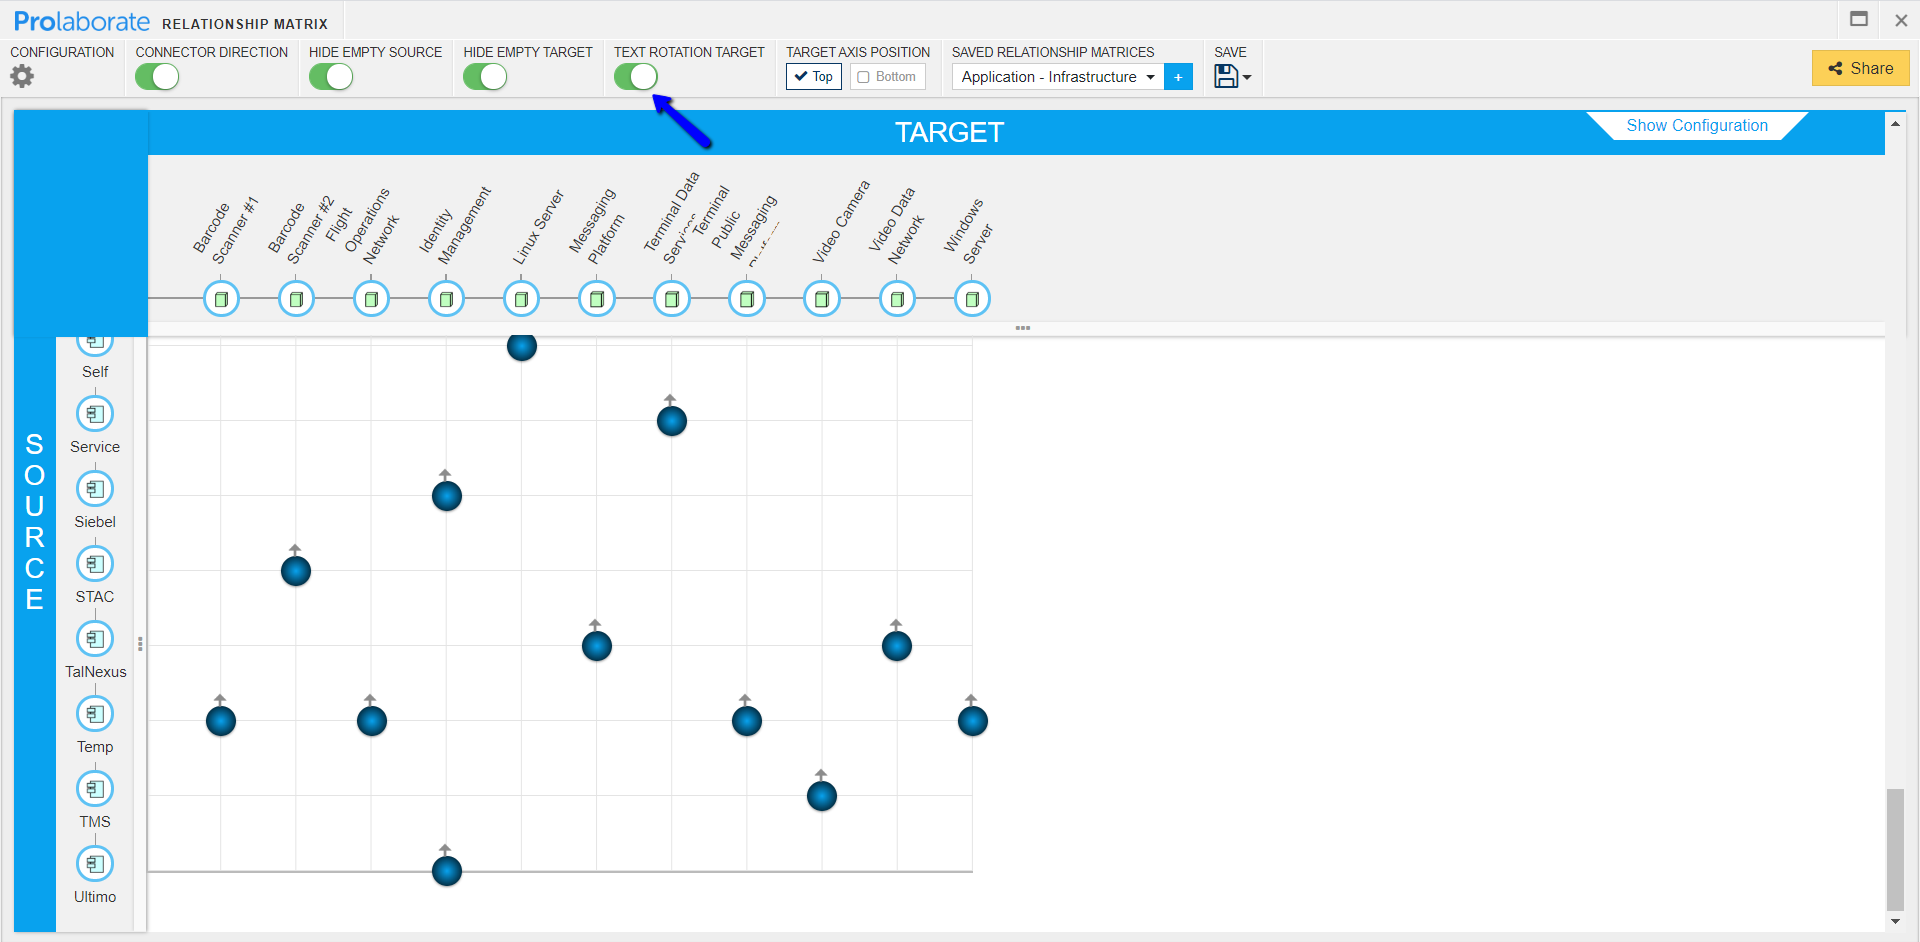
and expanding the bar
Now, you can edit everything and save it as a Prolaborate matrix. Details on what can be edited can be found in the subsequent sections.
You cannot save the changes back to EA.
Create a Relationship Matrix
Click on Menu > Relationship Matrix.
Click on Create a Relationship matrix.
Every single setting in this wizard can be changed later. So, feel free to choose anything without any worry.
Source Configuration
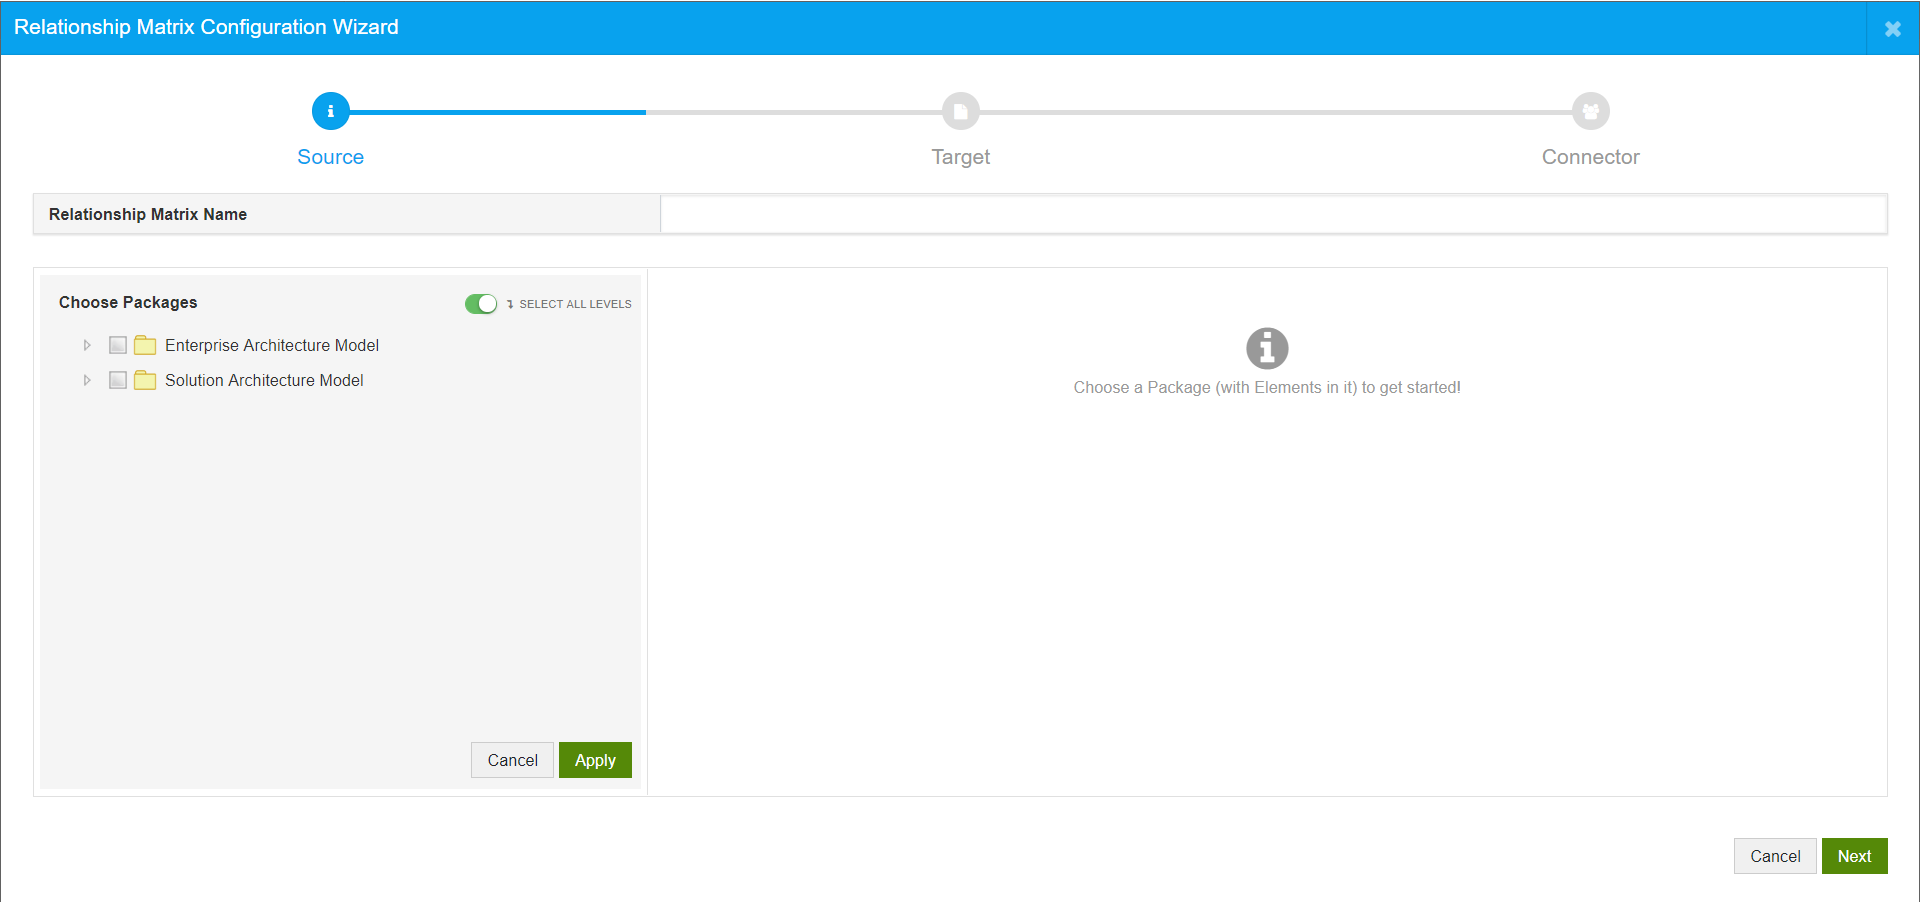
Select the package(s) that has the elements you want to analyze the relationships and click on Apply.
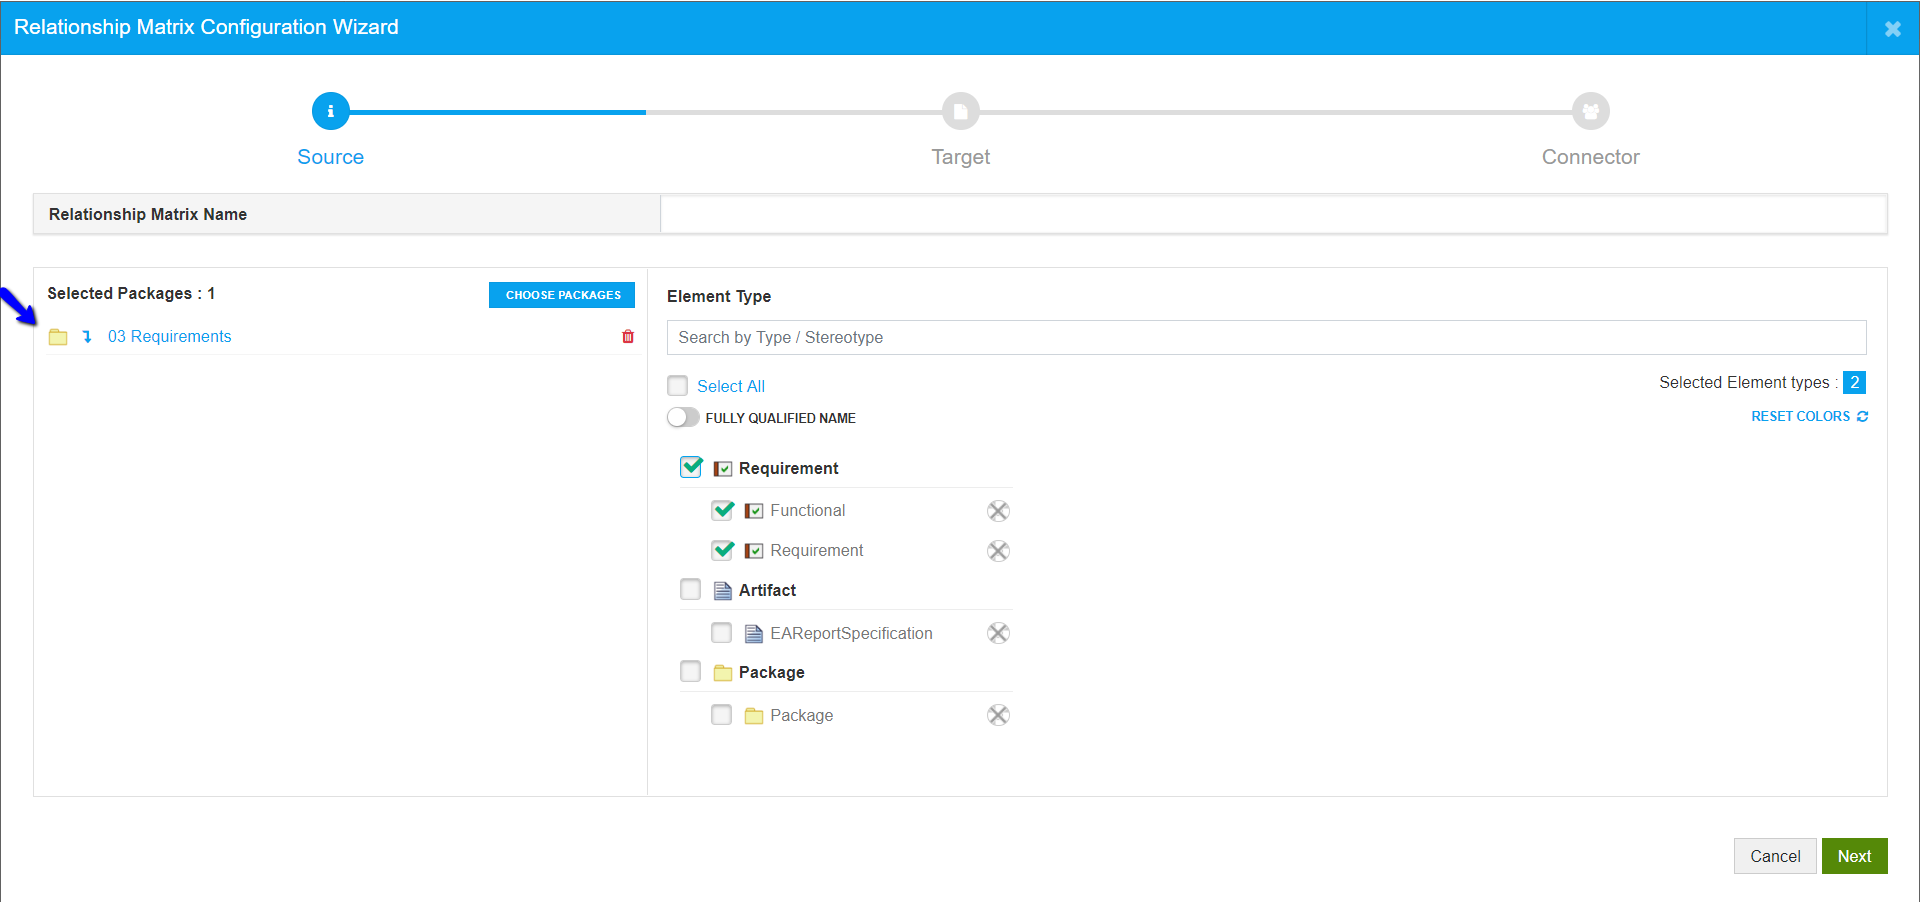
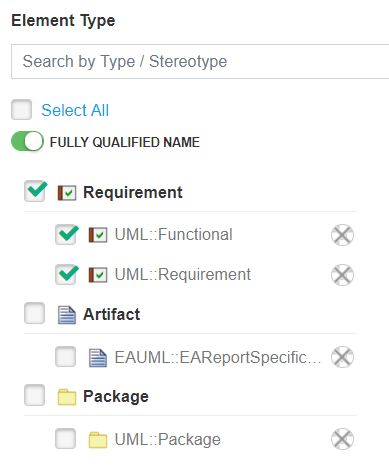
You will be shown the types and stereotypes of elements in the package(s) you have selected. Choose the type of elements that need to be considered.
For example, here we have selected all stereotypes under the Requirement type.
Here is what you can do in this page:
- Search for Type / Stereotype if the list of too big
- Click on Select All to select everything in the list
- Click on Fully Qualified Name to see the full name of the types and Stereotypes
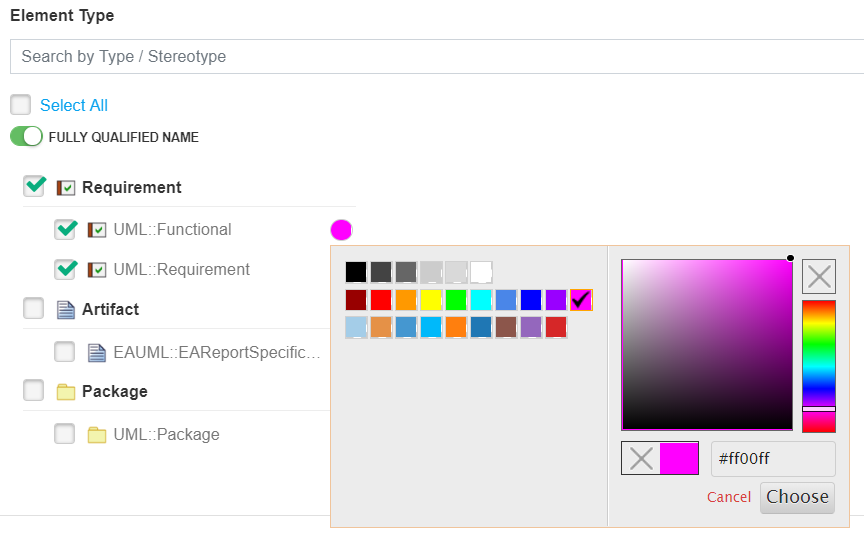
4. Specify color to each type or stereotype
Click on Next
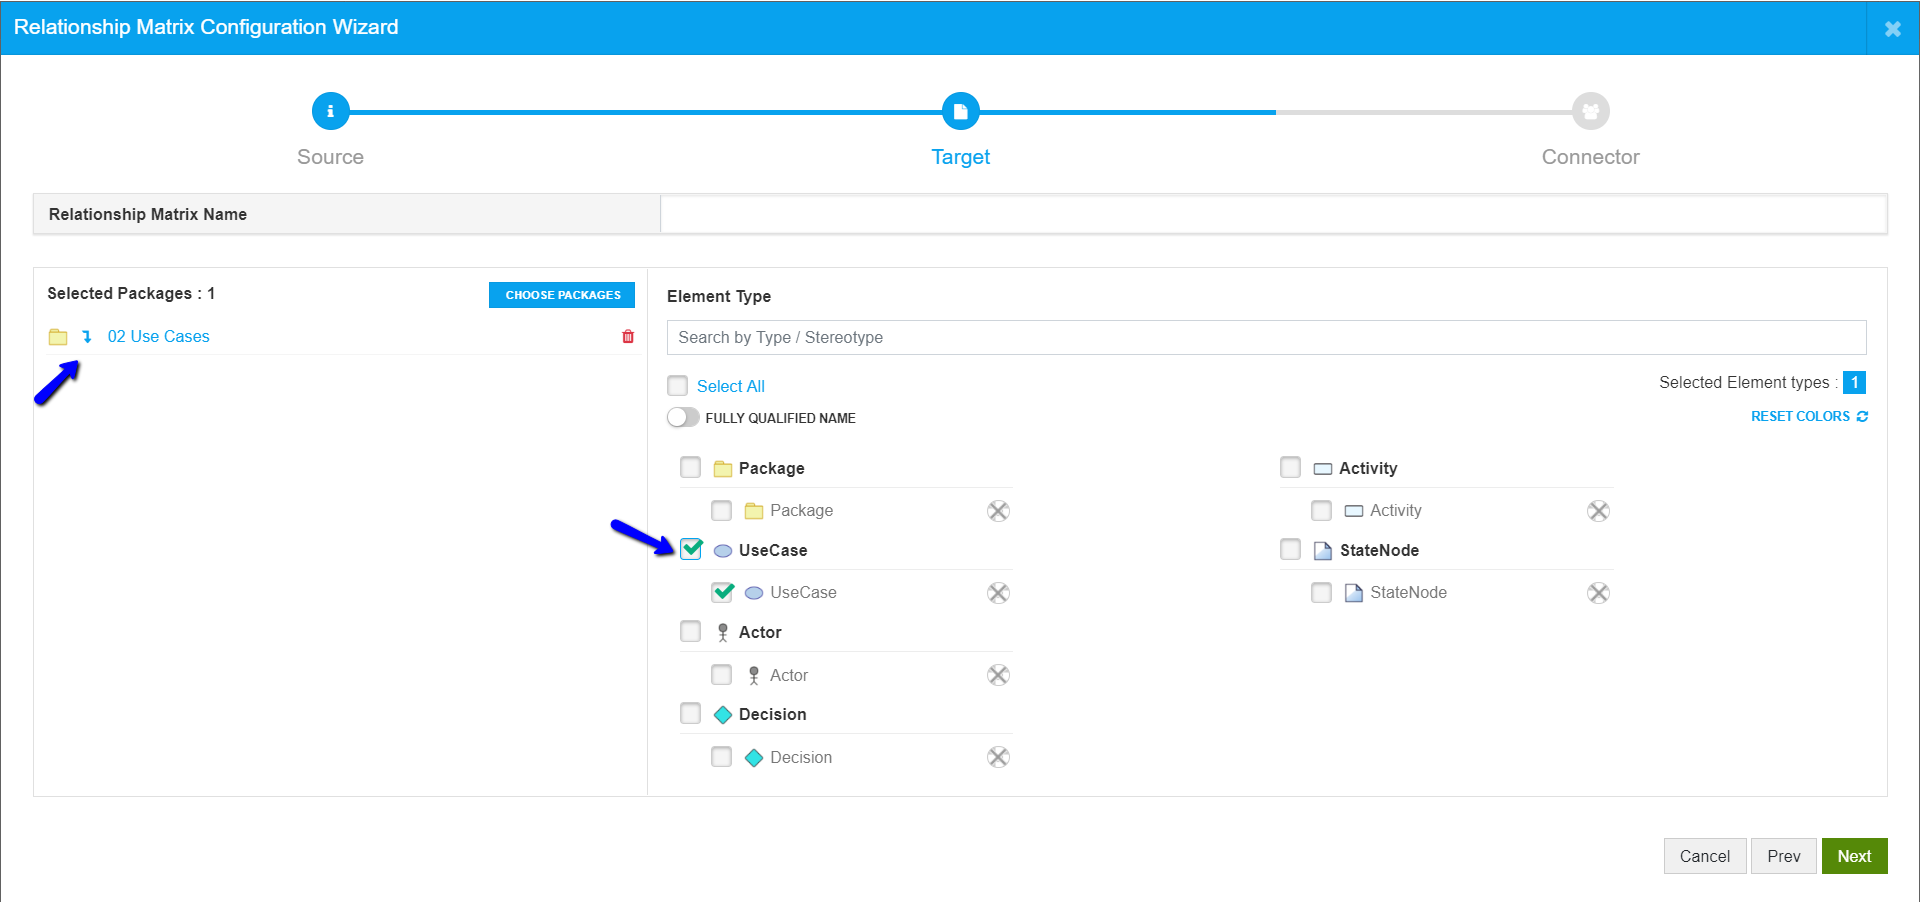
Target Configuration
Repeat the above-mentioned steps and click on Next.
Connector Configuration
Based on the Source and Target that are chosen, all the connectors between them are shown in the third step.
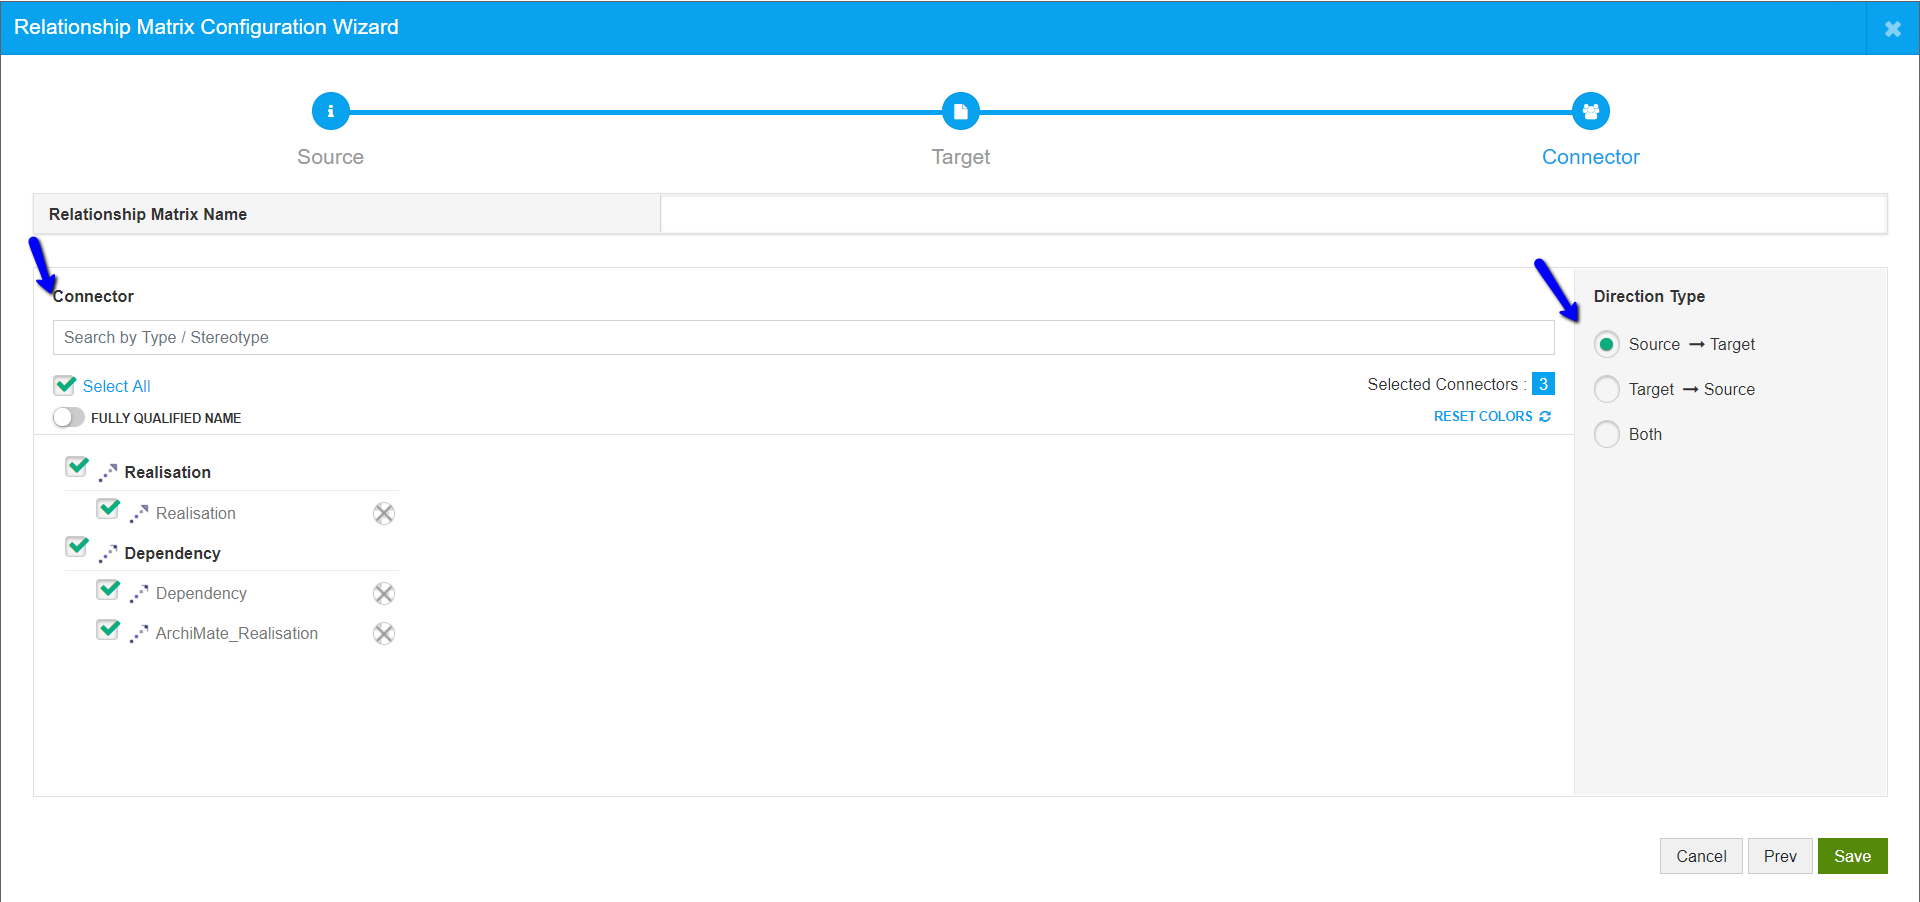
You can choose the kind of relationships you want to see in the matrix and their direction.
Give a Name to the Matrix and Click on Save.
Configure the Matrix
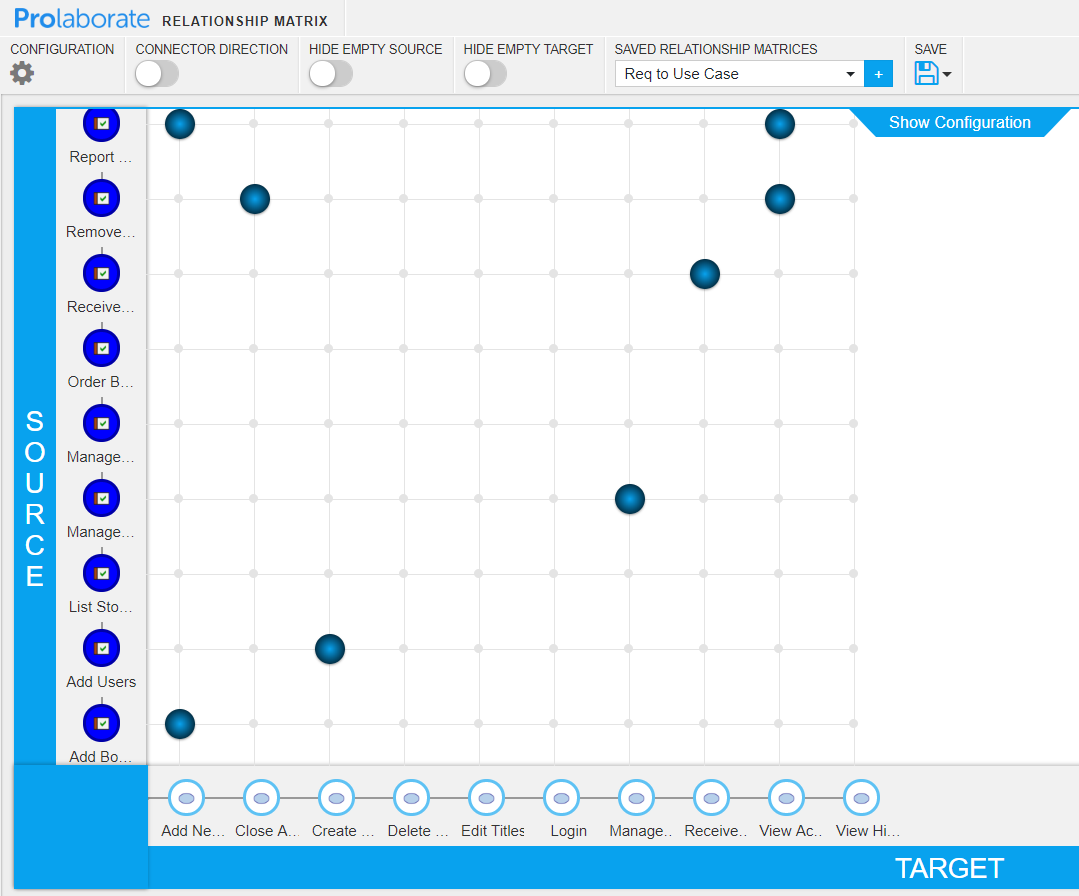
Once the matrix is created as per the previous section, enable the following:
- Connector direction – To see the direction of relationship
- Hide Empty Source – To hide elements from the Source which has no relationship with any element in the Target
- Hide Empty Target – To hide elements from the Target which has no relationship with any element in the Source
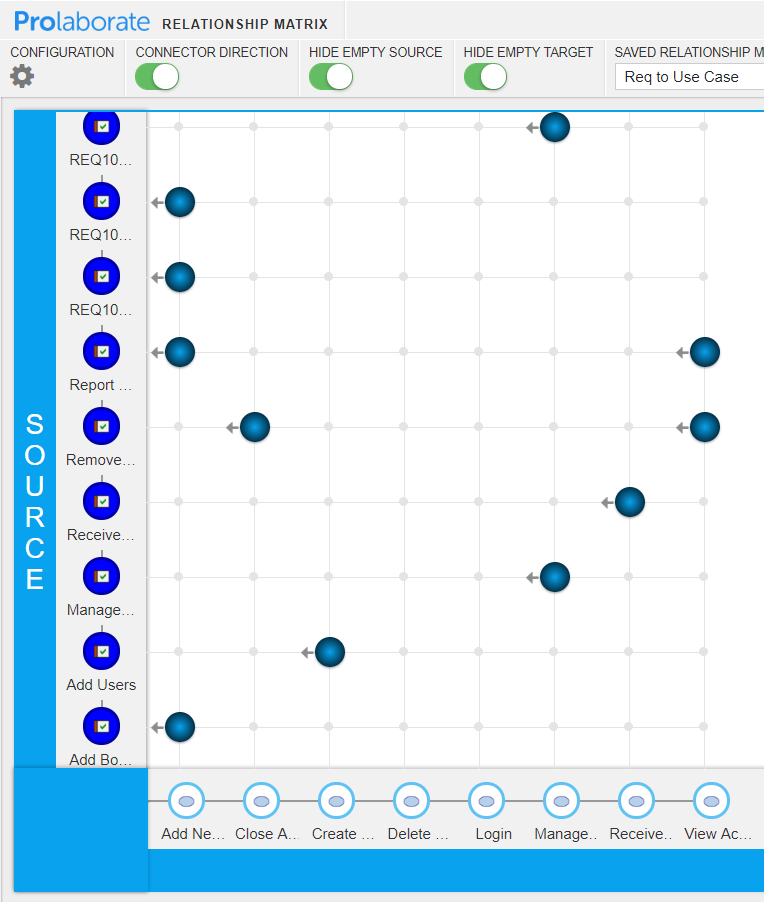
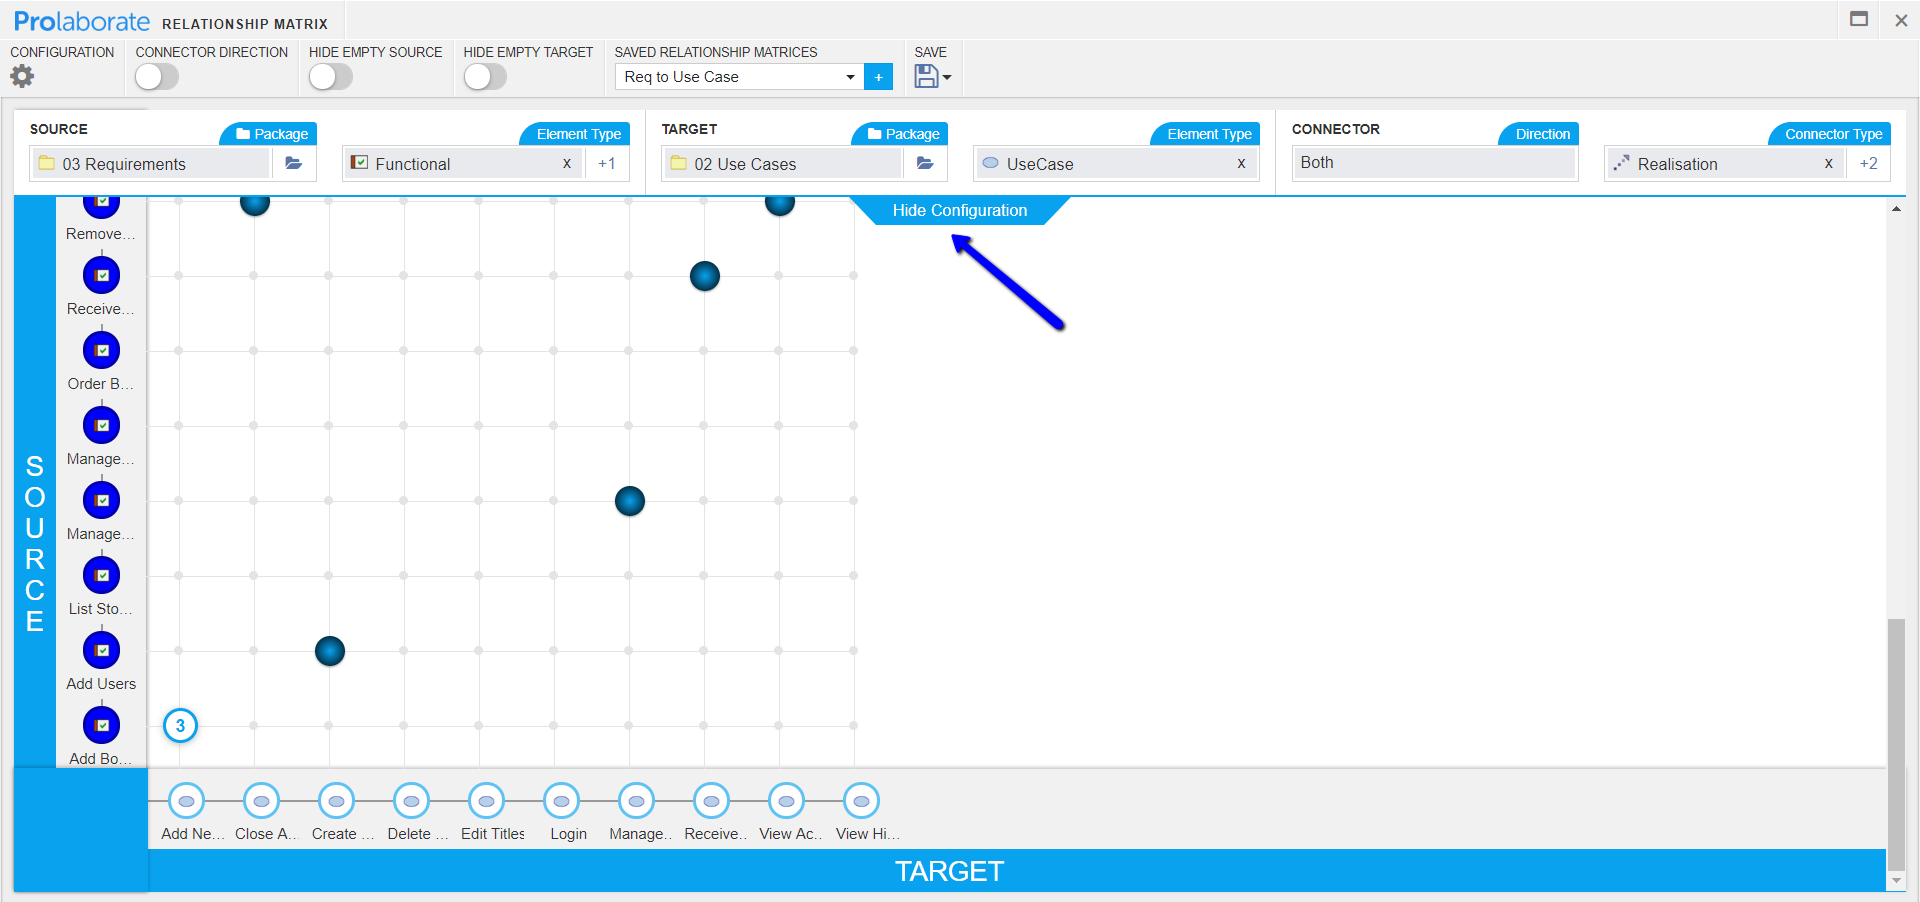
Now, we can clearly how the elements in the Source and Target are connected.
Color Code Elements and Relationships
To make the view clearer, you can set colors to the elements and relationships based on their Type or Stereotype. Click on Configuration.
Click on Connector tab and color code the relationships.
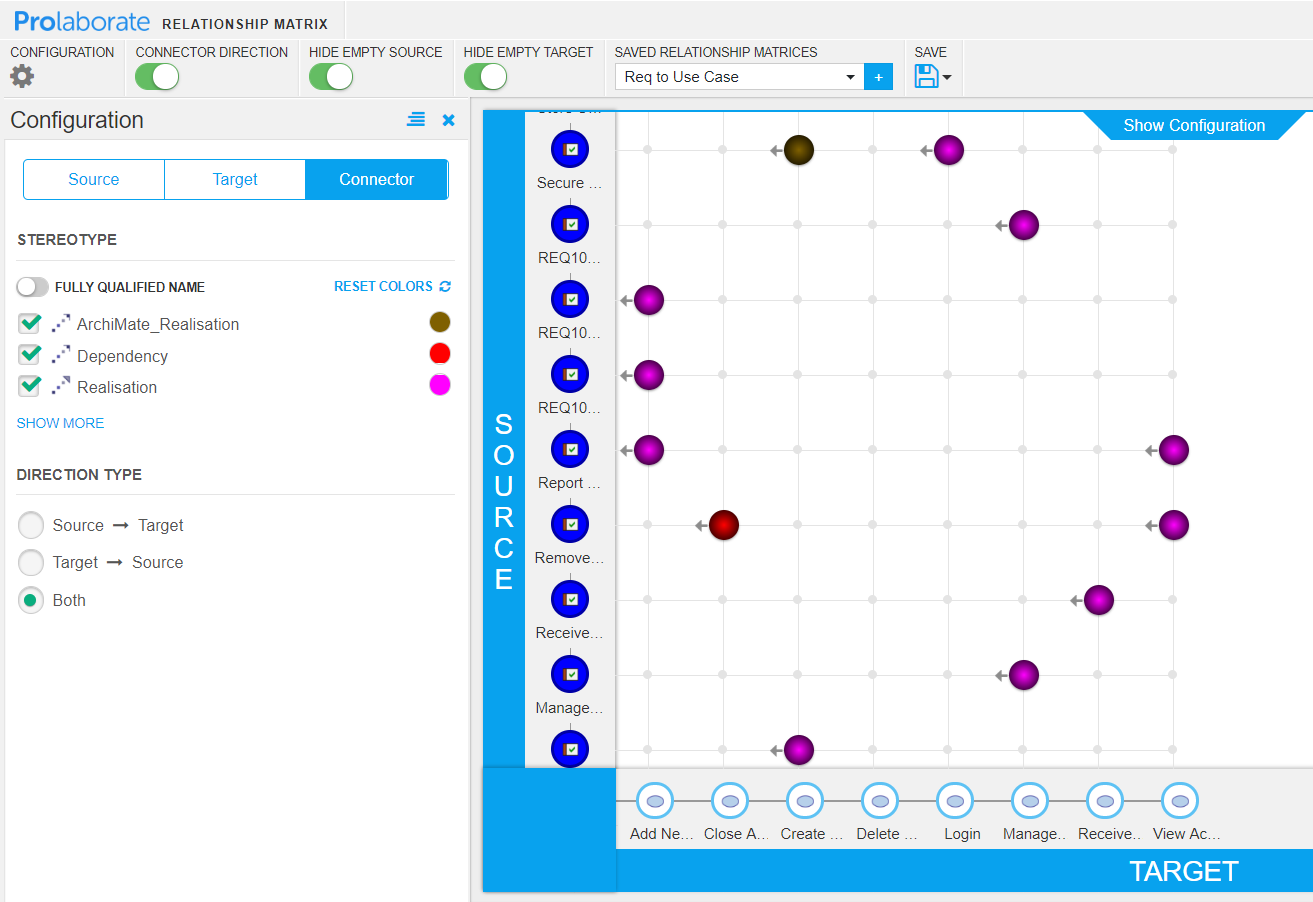
We can now understand the relationships in a better way. From this view, we can easily see there is only one Dependency.
Click on Source or Target and color code the elements:
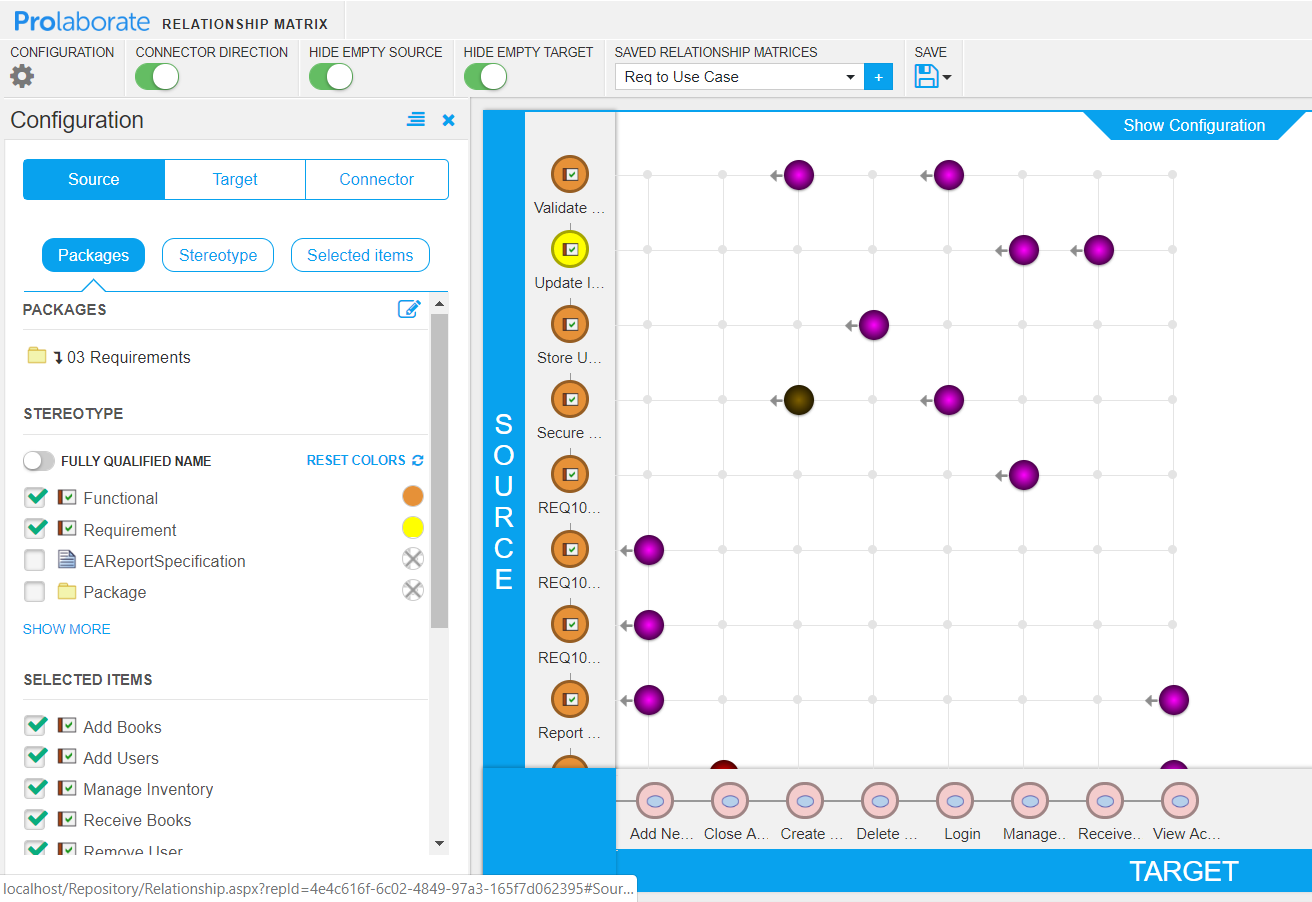
Now, the whole view will be self-explanatory to the viewers.
To make the view much more focused, you can specify a single color (Say Red) to the elements and relationships that needs attention.
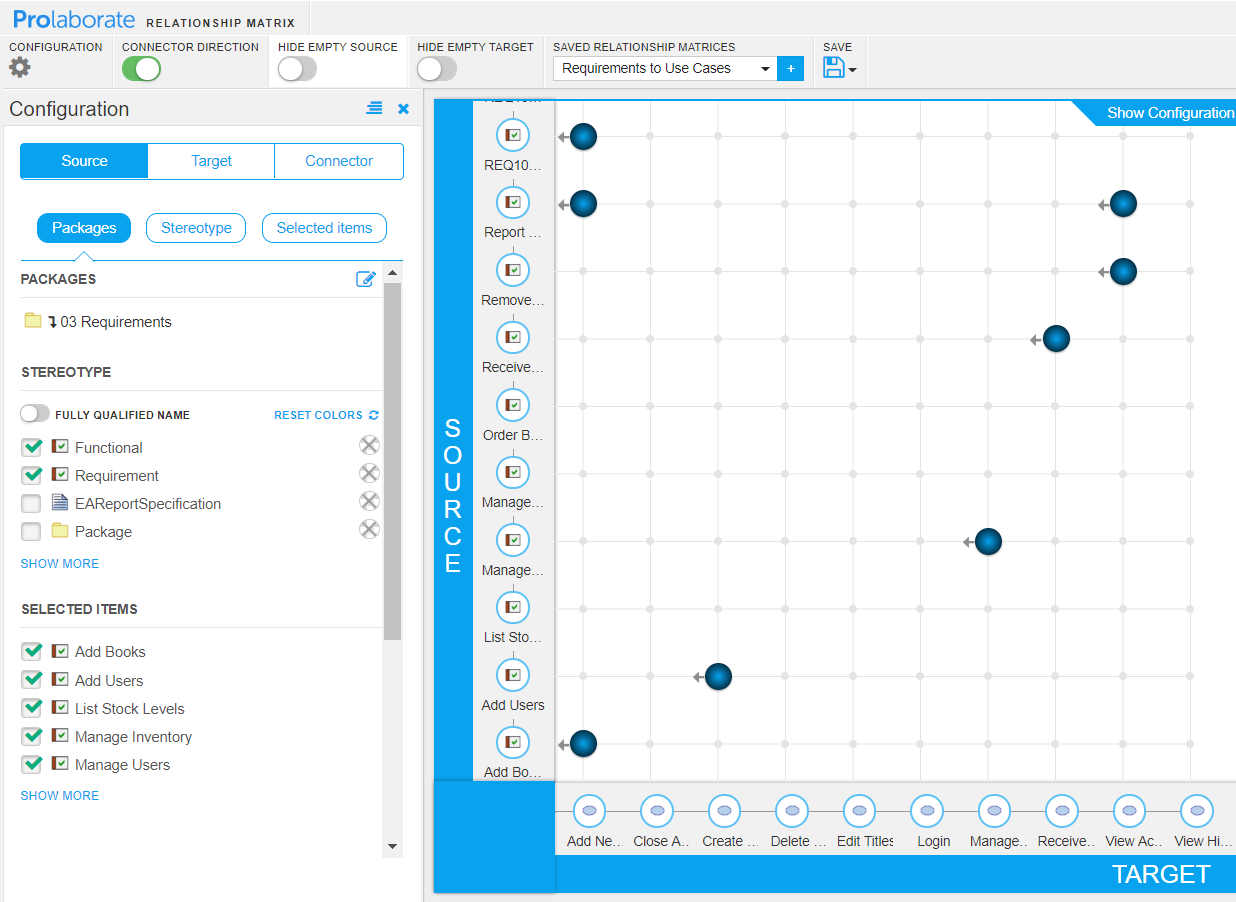
Filter the Elements
In many cases, even after we filter out the elements and relationships, we would still be left out with a huge list of items that are not relevant to the objective at hand.
To handle this scenario, you can choose only the elements that need attention.
Click on Source or Target > Selected Items > Show More:
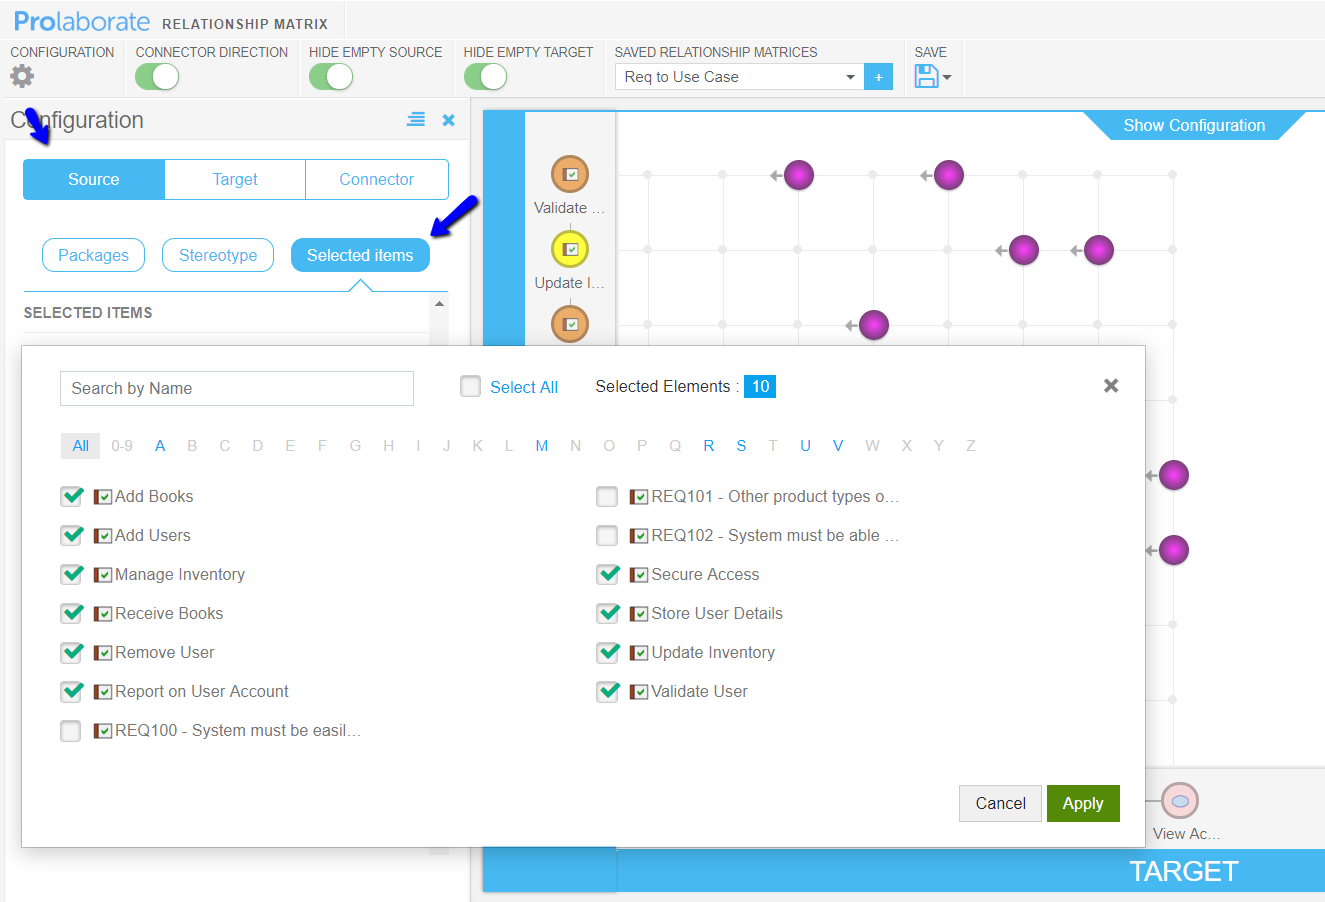
You can now remove the items that are irrelevant and click on Apply.
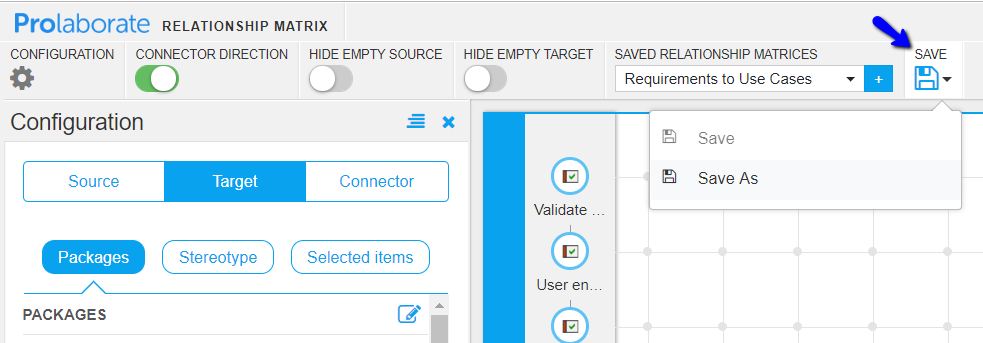
Save the Matrix by clicking on Save > Save.
Now, you can share the name of the Matrix to your users and they can just open the Matrix and view it.
Share Matrix
Click on Share to get a shortened URL for the matrix. You can share this link with your Prolaborate users for easy access.
If in the case share is disabled, please enable it by visiting Menu > Repository Settings > Share Settings.
Understand the Relationships
So far, we have been seeing the workflows of an architect or analyst who wants to share the matrix with a wider audience.
This section covers the help topics for the audience or the consumers of the matrix.
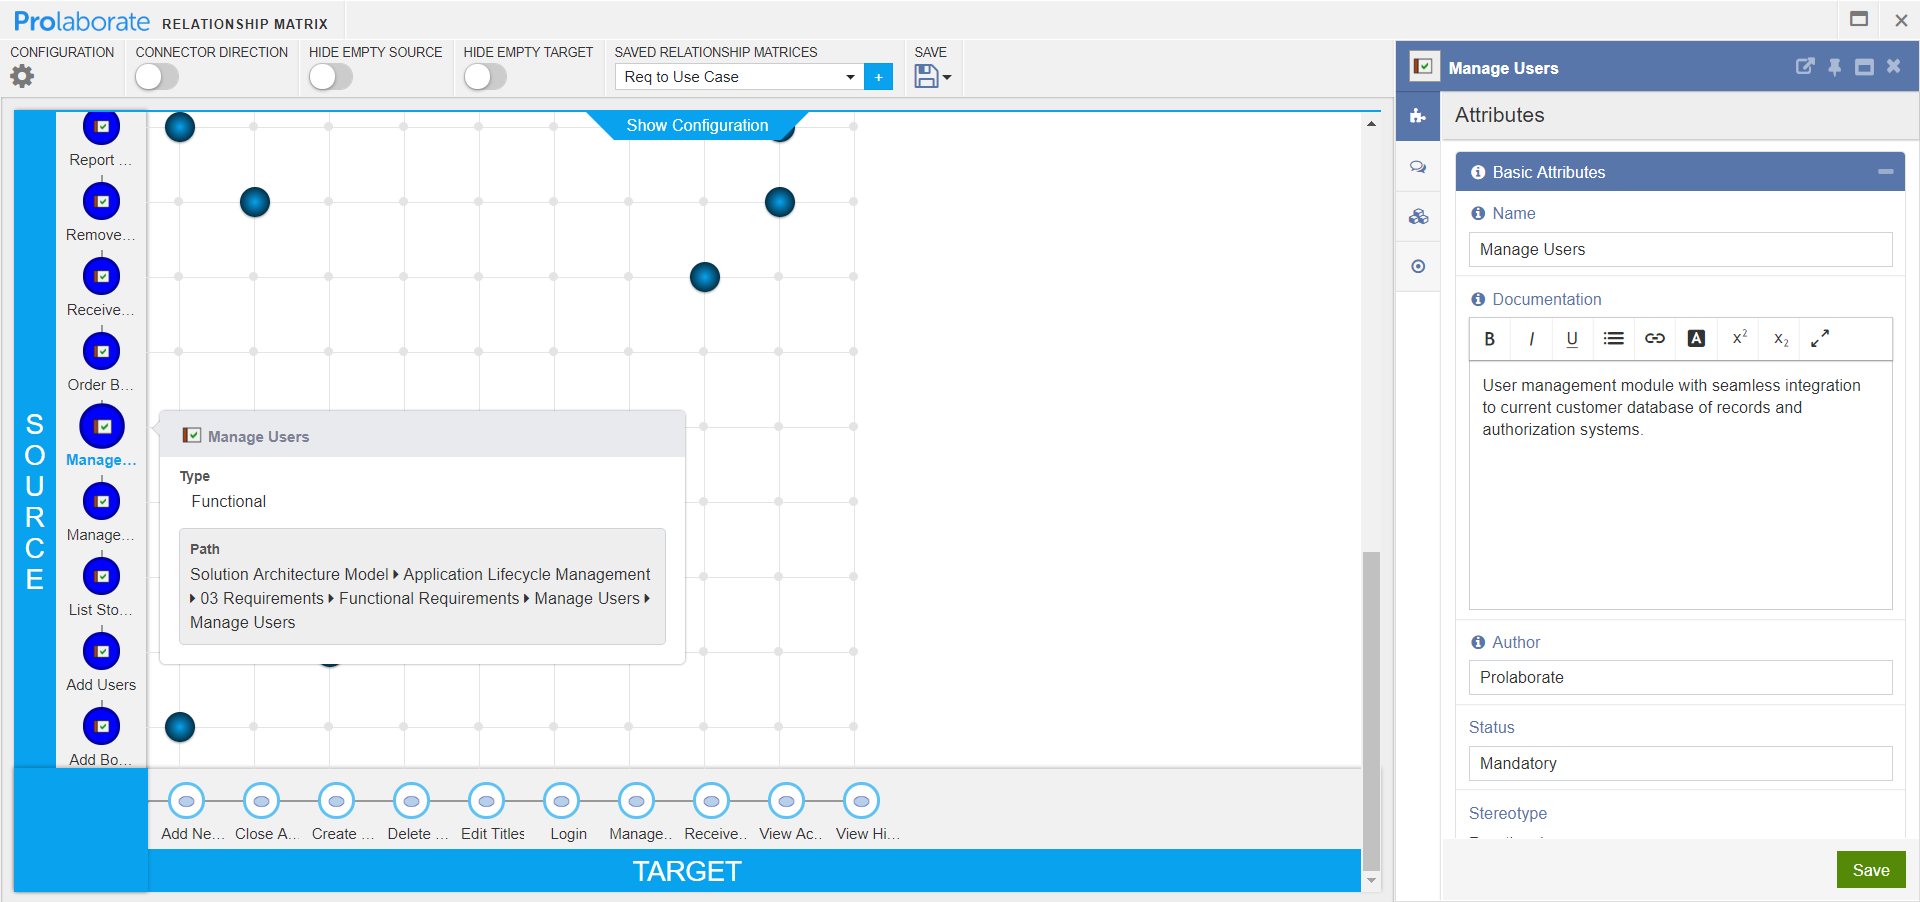
You can hover over the elements to see a quick overview and click on the any of the elements in Source or Target to view more information
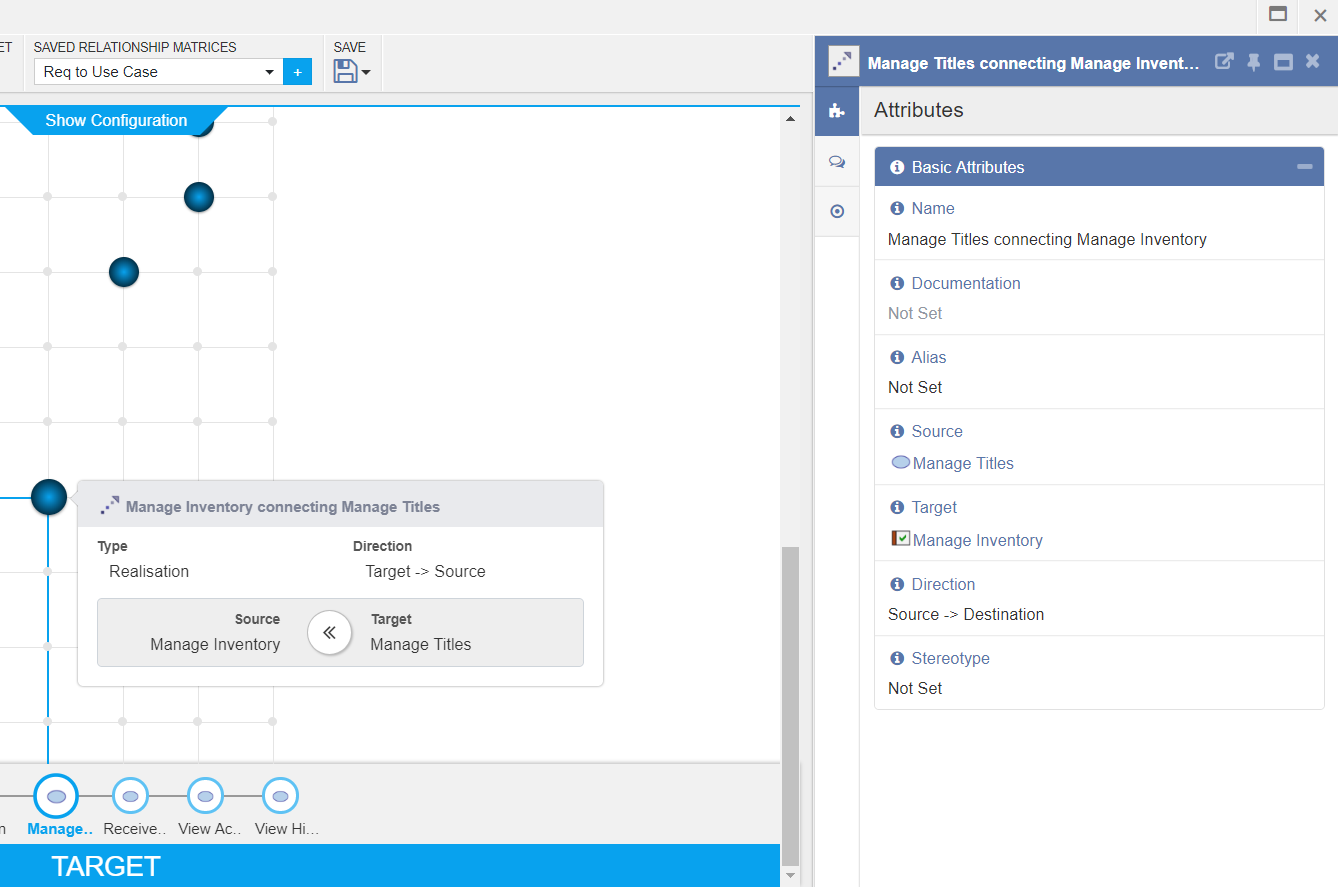
Hover over the connectors to see a quick overview and click on them to view more information
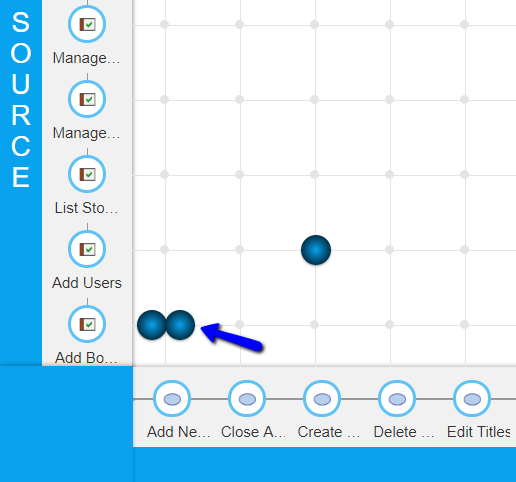
Multiple relationships are shown as below:
Two-way relationship:
If two elements maintain more than two kinds of relationship, it is shown as below:
You can hover over the count to see the connectors and click on any of them to see its properties.
To get a quick overview of the configuration, you can click on Show Configuration.