
Transform Your Enterprise Architecture Diagrams into meaningful dashboards for better decision making
Transform Your Enterprise Architecture Diagrams into meaningful dashboards for better decision making
Key pain points for introducing MDG Color Configuration
In previous versions of Prolaborate (before 4. X), creating charts and heatmaps with a consistent color was a tedious process as it required manual configuration for every chart. This made it difficult to scale up uniform visuals across architecture dashboards.
However, the latest version of Prolaborate (4. X) addresses this pain point by introducing MDG Color Configuration, which enables the configuration of colors across the model. The feature simplifies the process of creating charts and heatmaps with a consistent color setting, allowing users to easily create a uniform look and feel across their architecture dashboards.
As a result, Prolaborate 4. X helps to foster readability and better decision-making by enabling users to create clear and visually appealing dashboards.
Note:
- Please click the following link to read more on how to configure MDG Color Configuration
Problem Statement 1: Inconsistent colors for properties
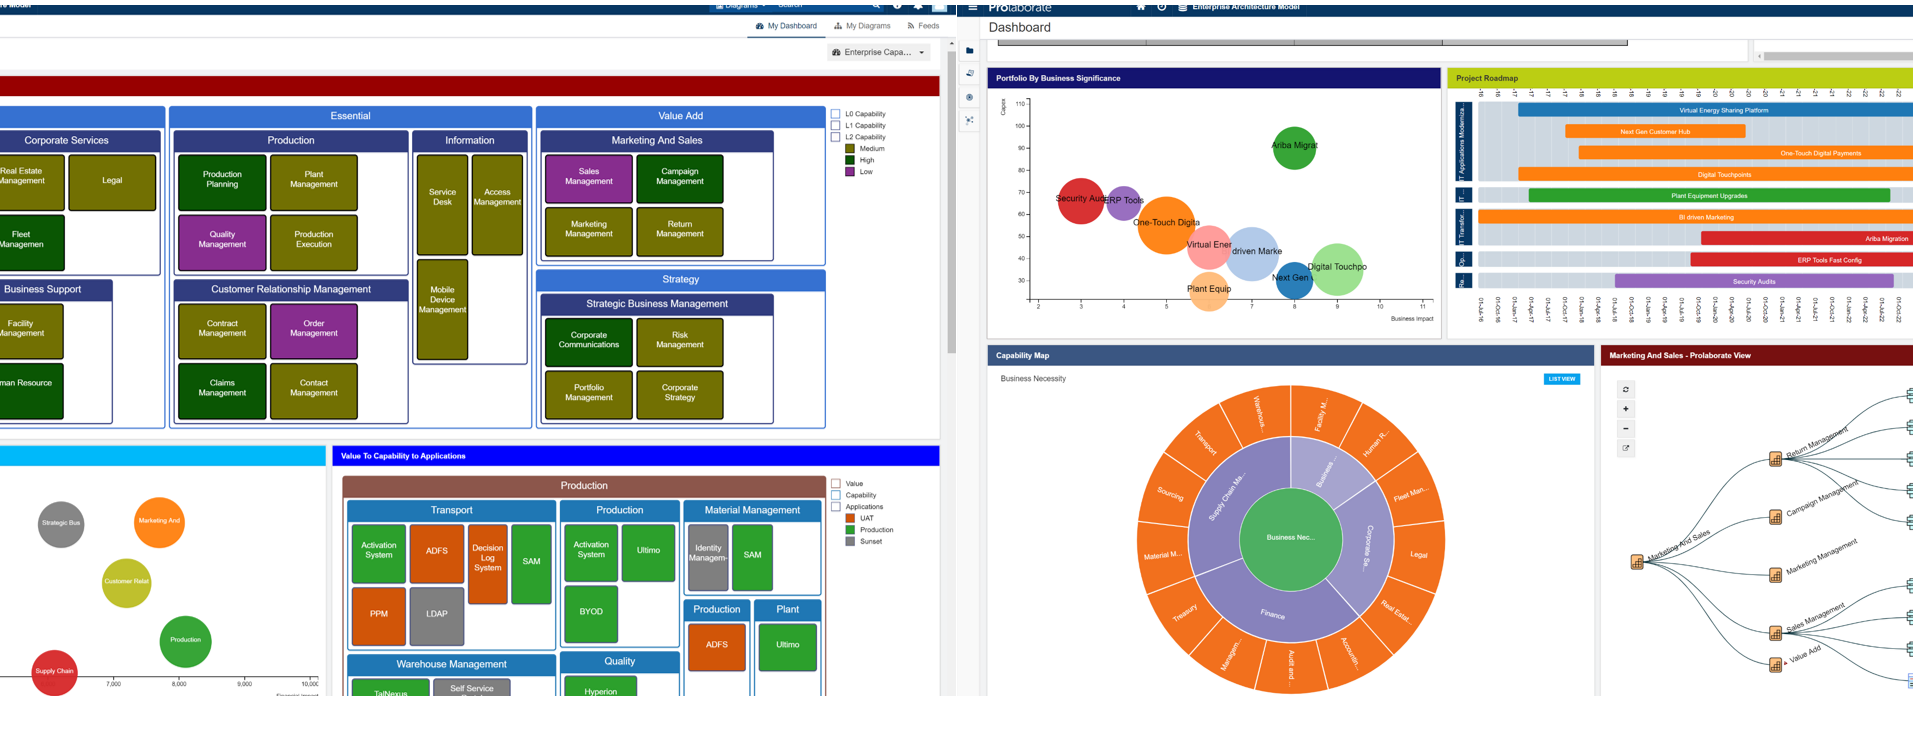
In Prolaborate V3, to apply a specific color for a property across model, we must set colors in every place it is used. This is a tedious process for one who tries to showcase the same color for a property across model. In the below dashboard, ‘Enterprise Capability Analysis’, the colors for a property ‘Criticality’ the color is configured manually in each widget.
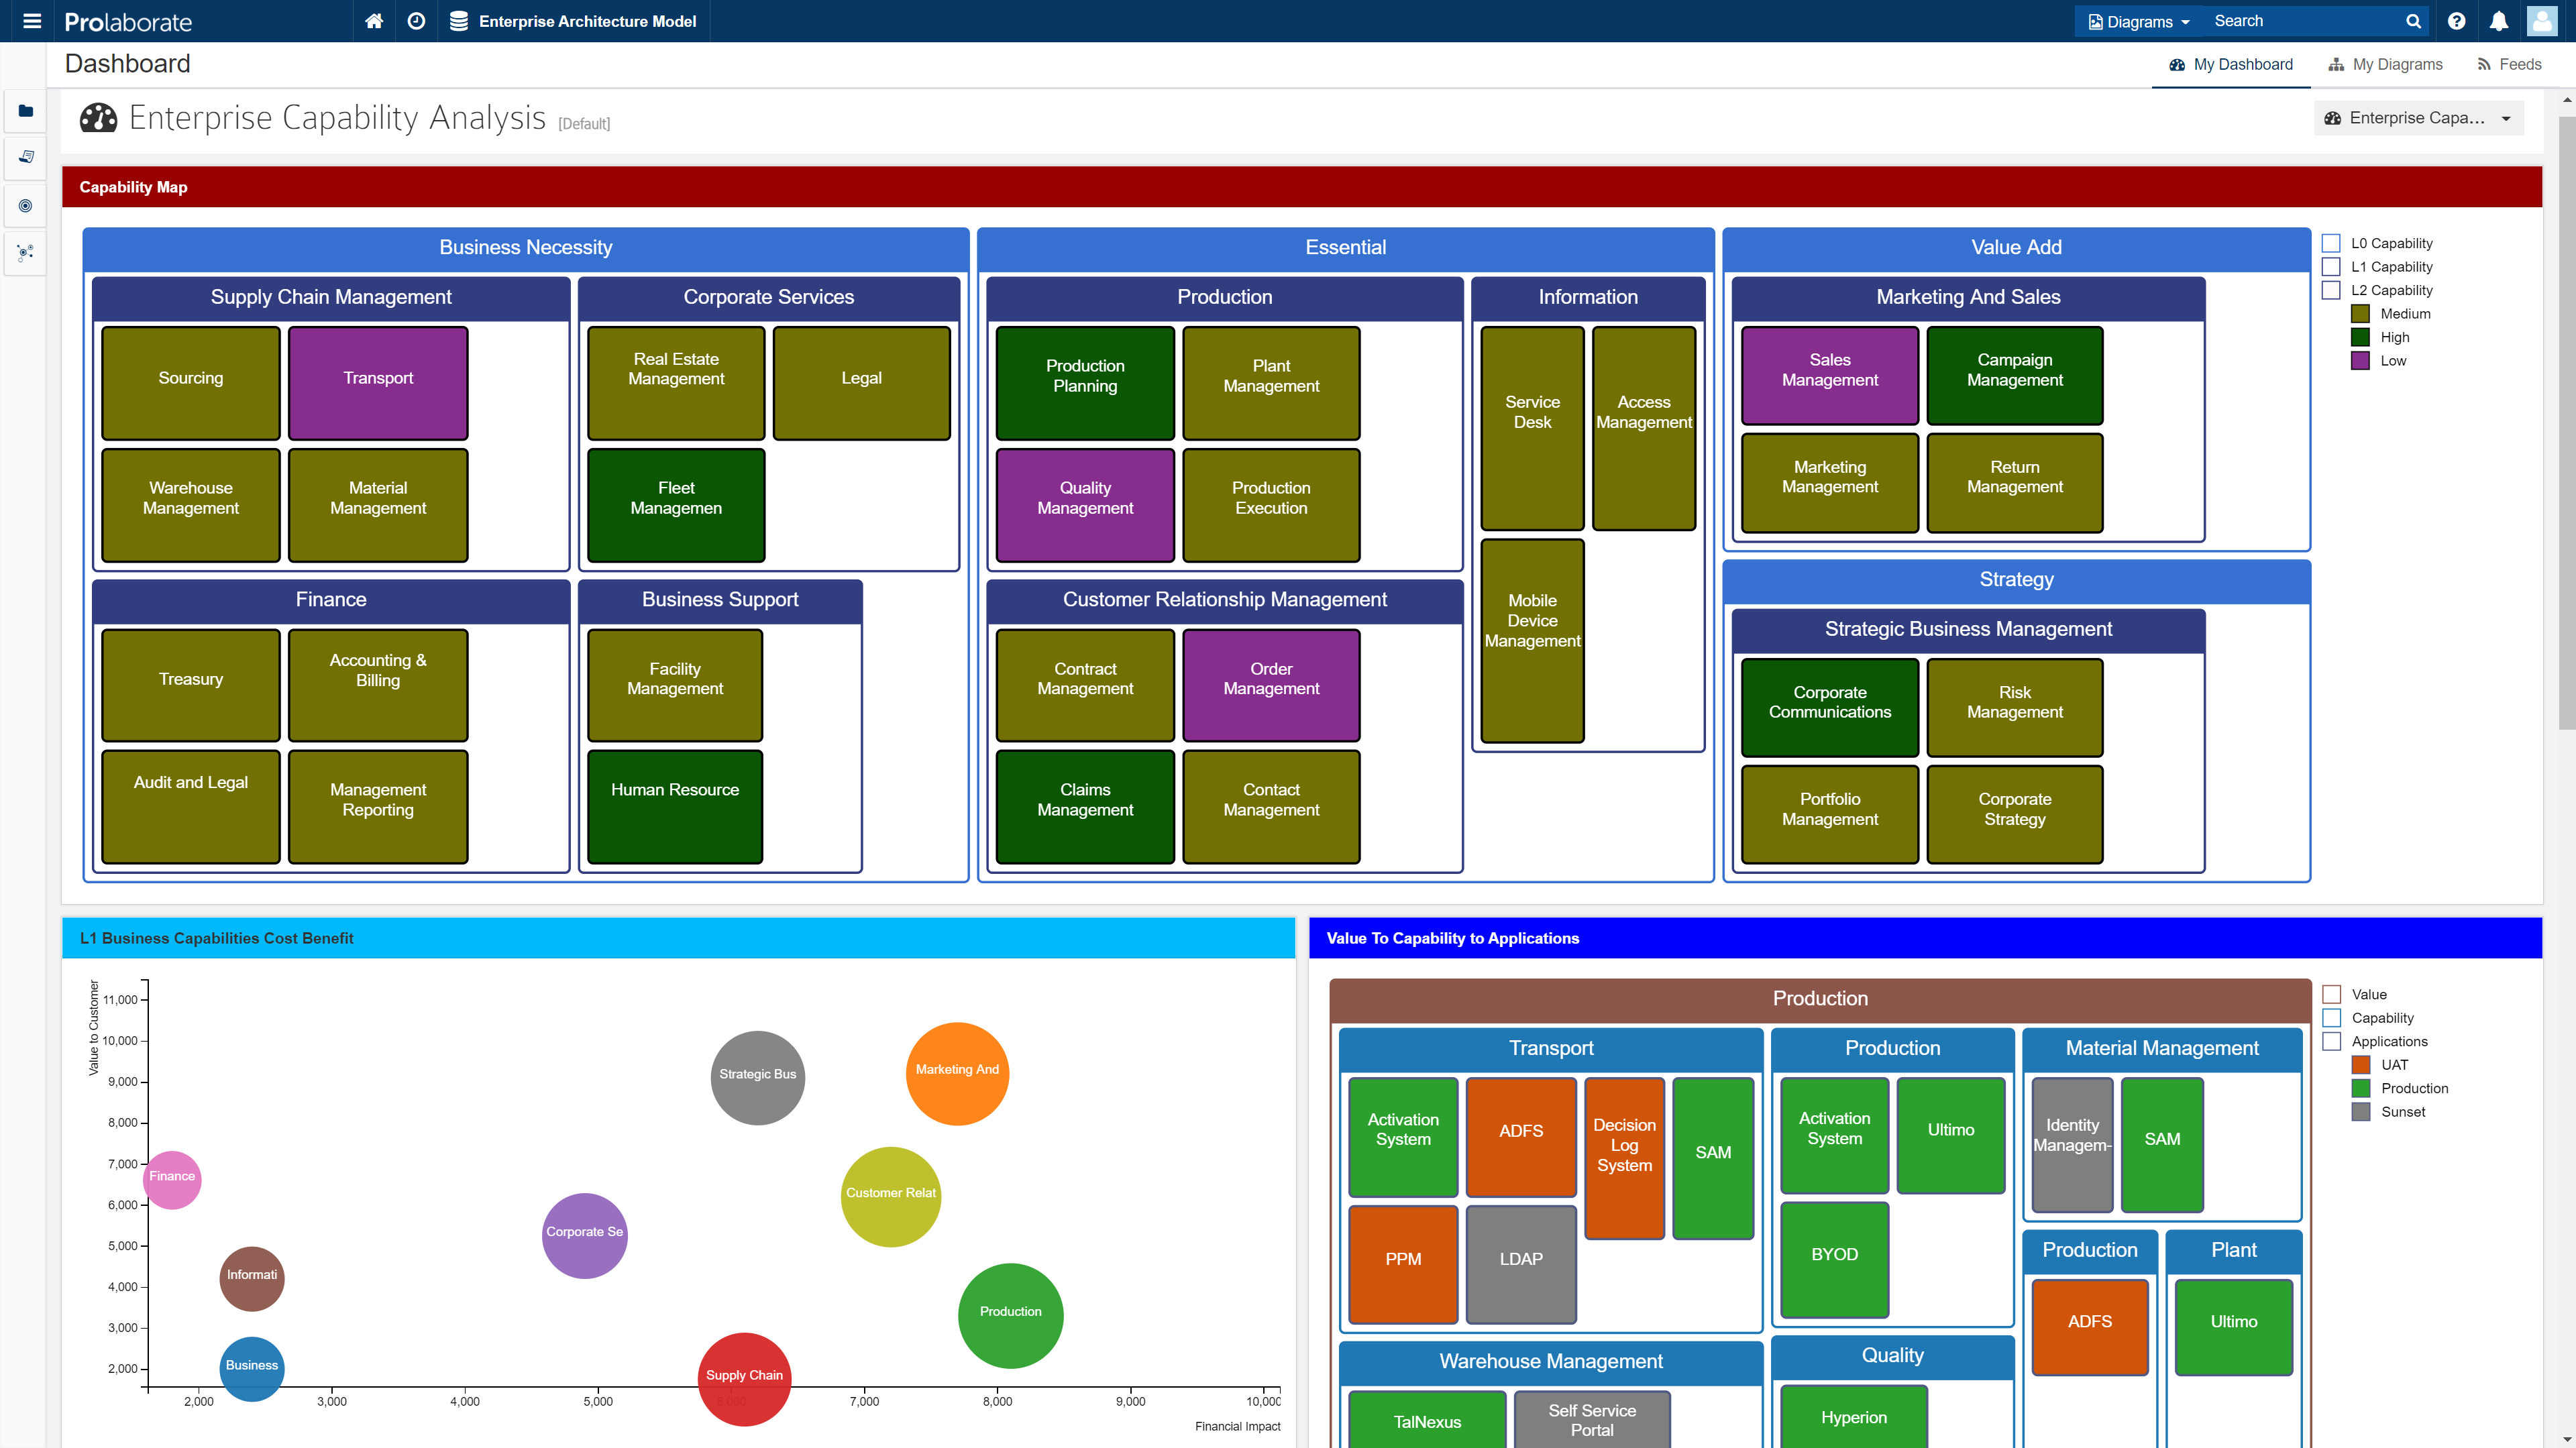


The colors have been configured by using the color palette from the chart configuration. It needs to be done manually, which consumes a lot of time and effort. However, with MDG Color Configuration we can achieve this easily in V4.
Set consistent colors across the model
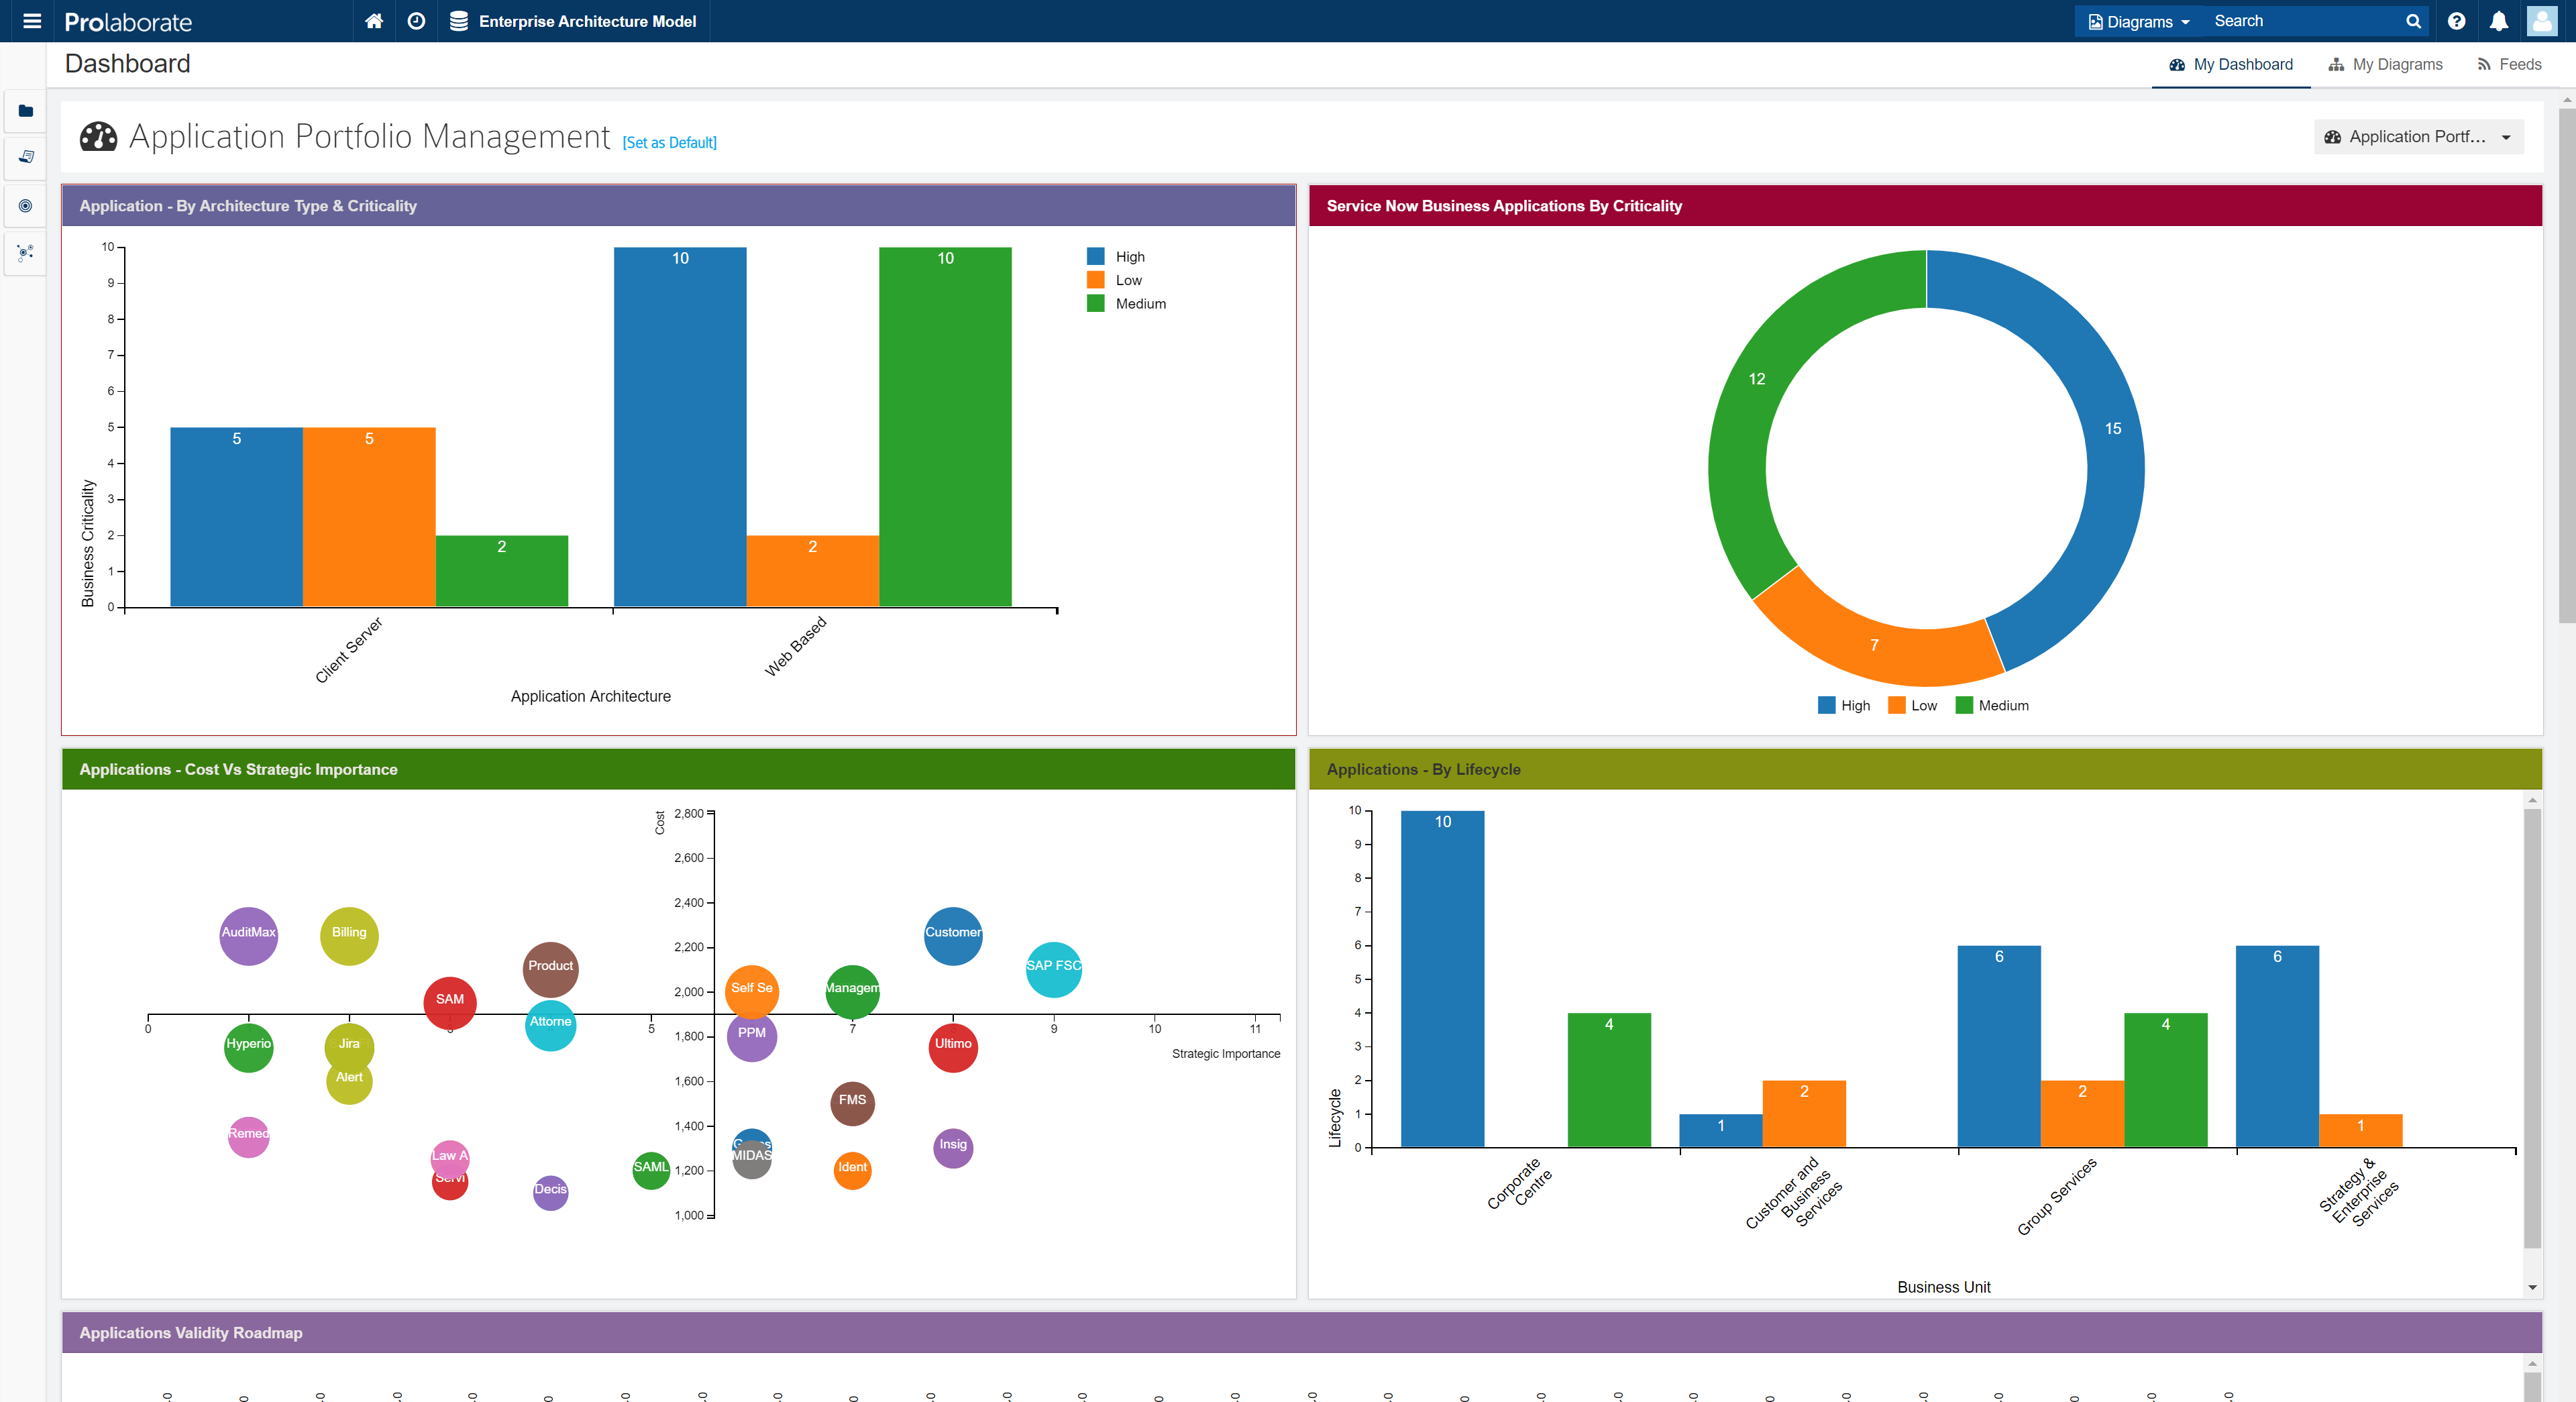
In the below dashboard, the colors are set to properties in one source and the widgets have automatically rendered the colors in dashboards in accordance. Hence, colors are maintained consistently across model.
The colors have been auto-configured from the MDG color configuration. For more personalization users can select the colors for tagged values, which consumes less effort and time.
Problem Statement 2: Repeat the configuration for each widget
To generate a great visual cue, users need to configure colors for properties in each widget. So that the widgets complement each other. To achieve this in Prolaborate 3.x one must configure colors manually for all the charts and reports. A user can easily overcome this challenge in Prolaborate V4.
One-time Color Configuration
One can skip the hassle by setting the colors for the tagged values in MDG color configuration as it enables Prolaborate to render the colors in the following areas-
- Dashboards and widgets
- EA Reports
- Property tab
- Overview page
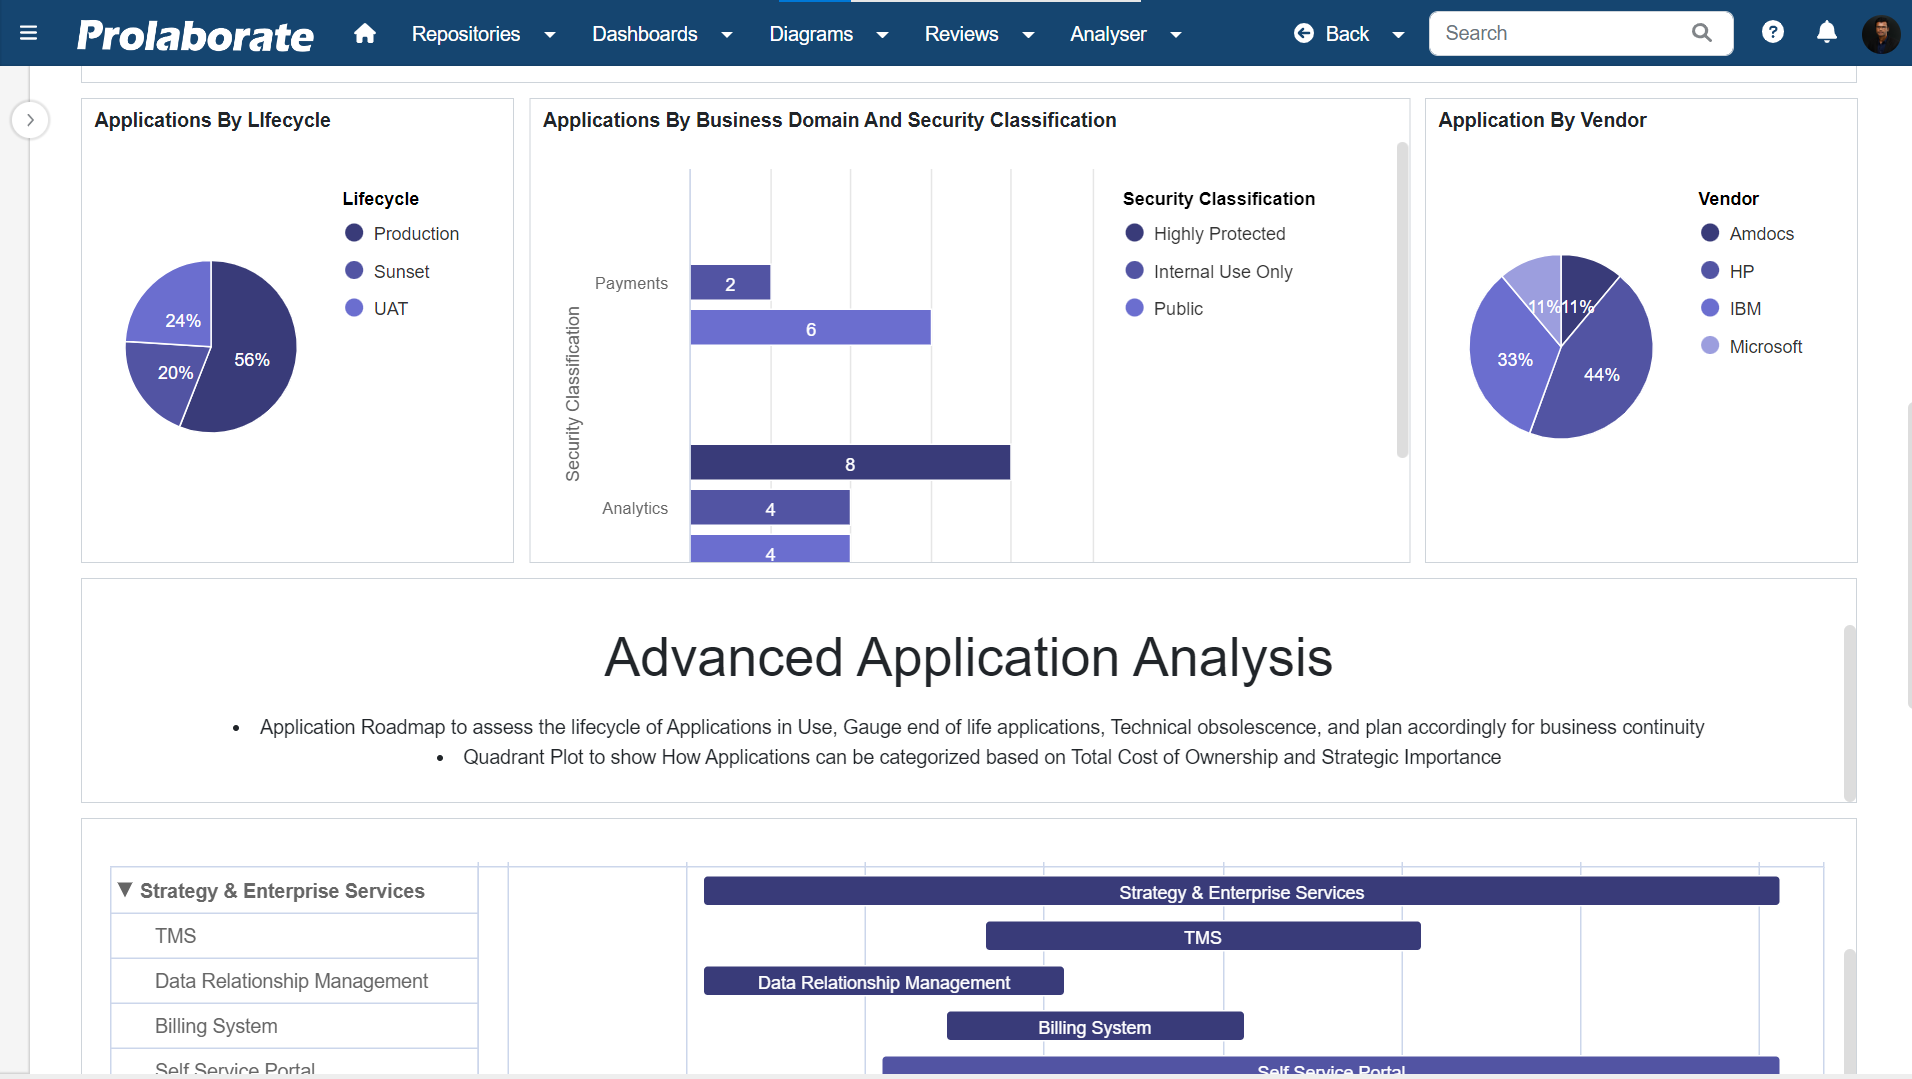
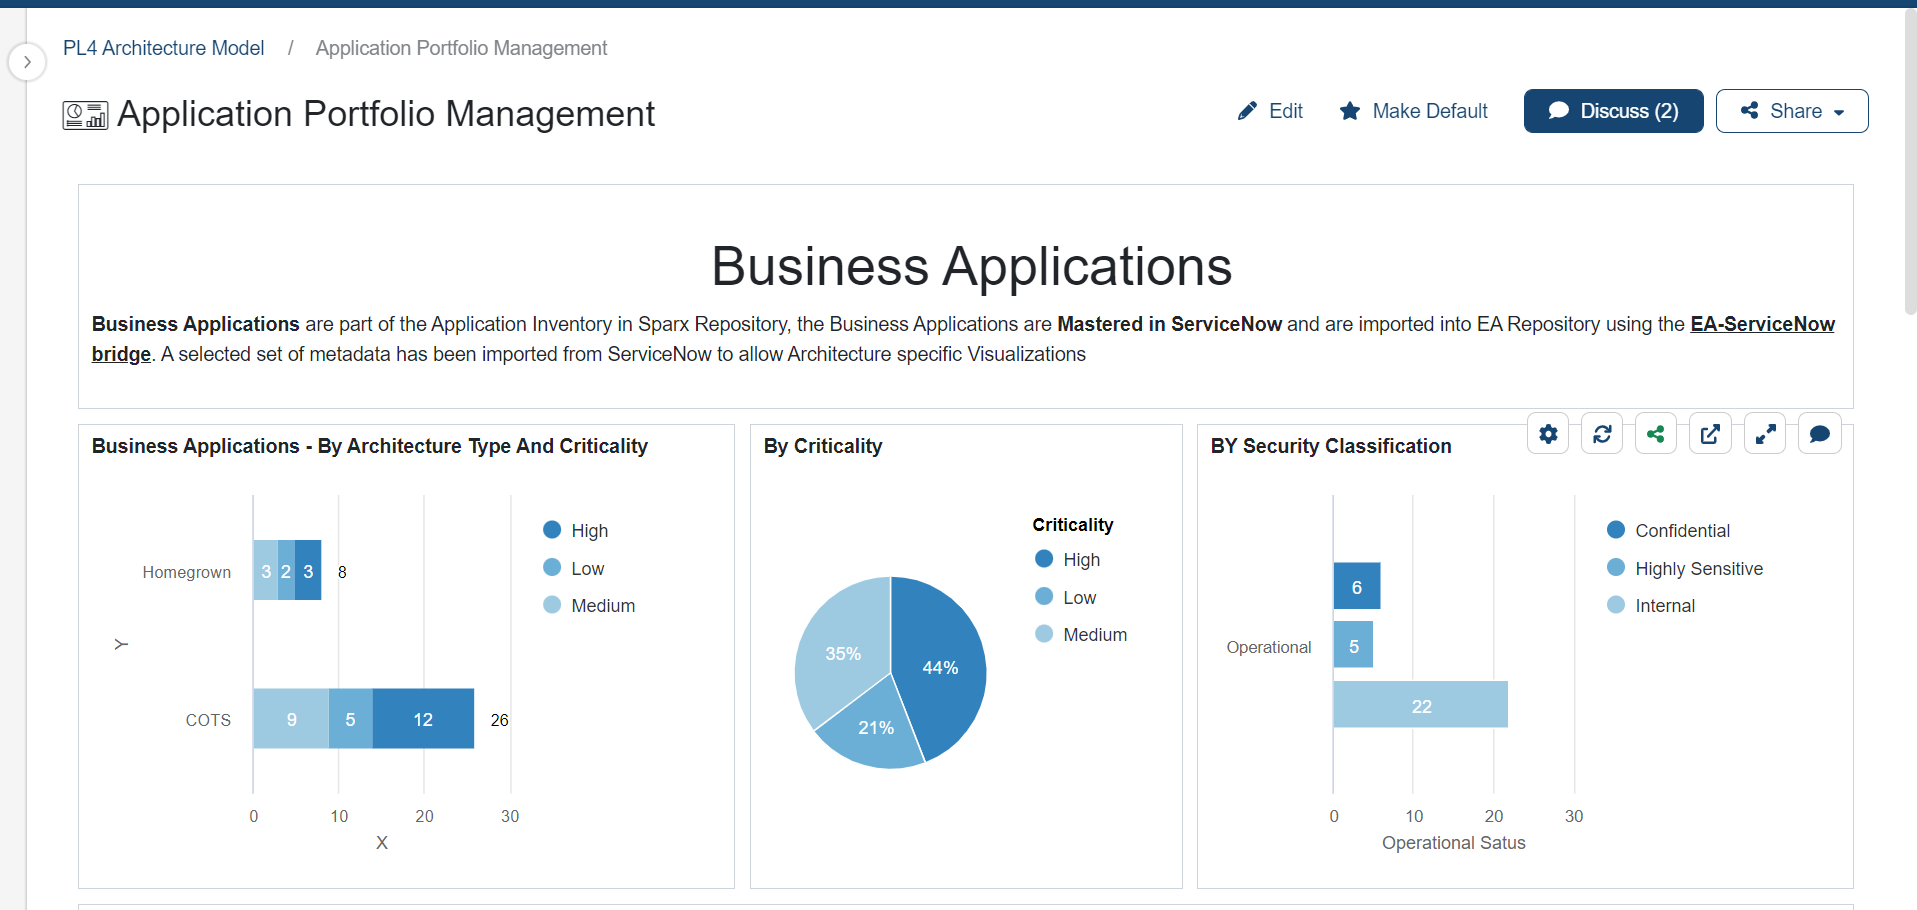
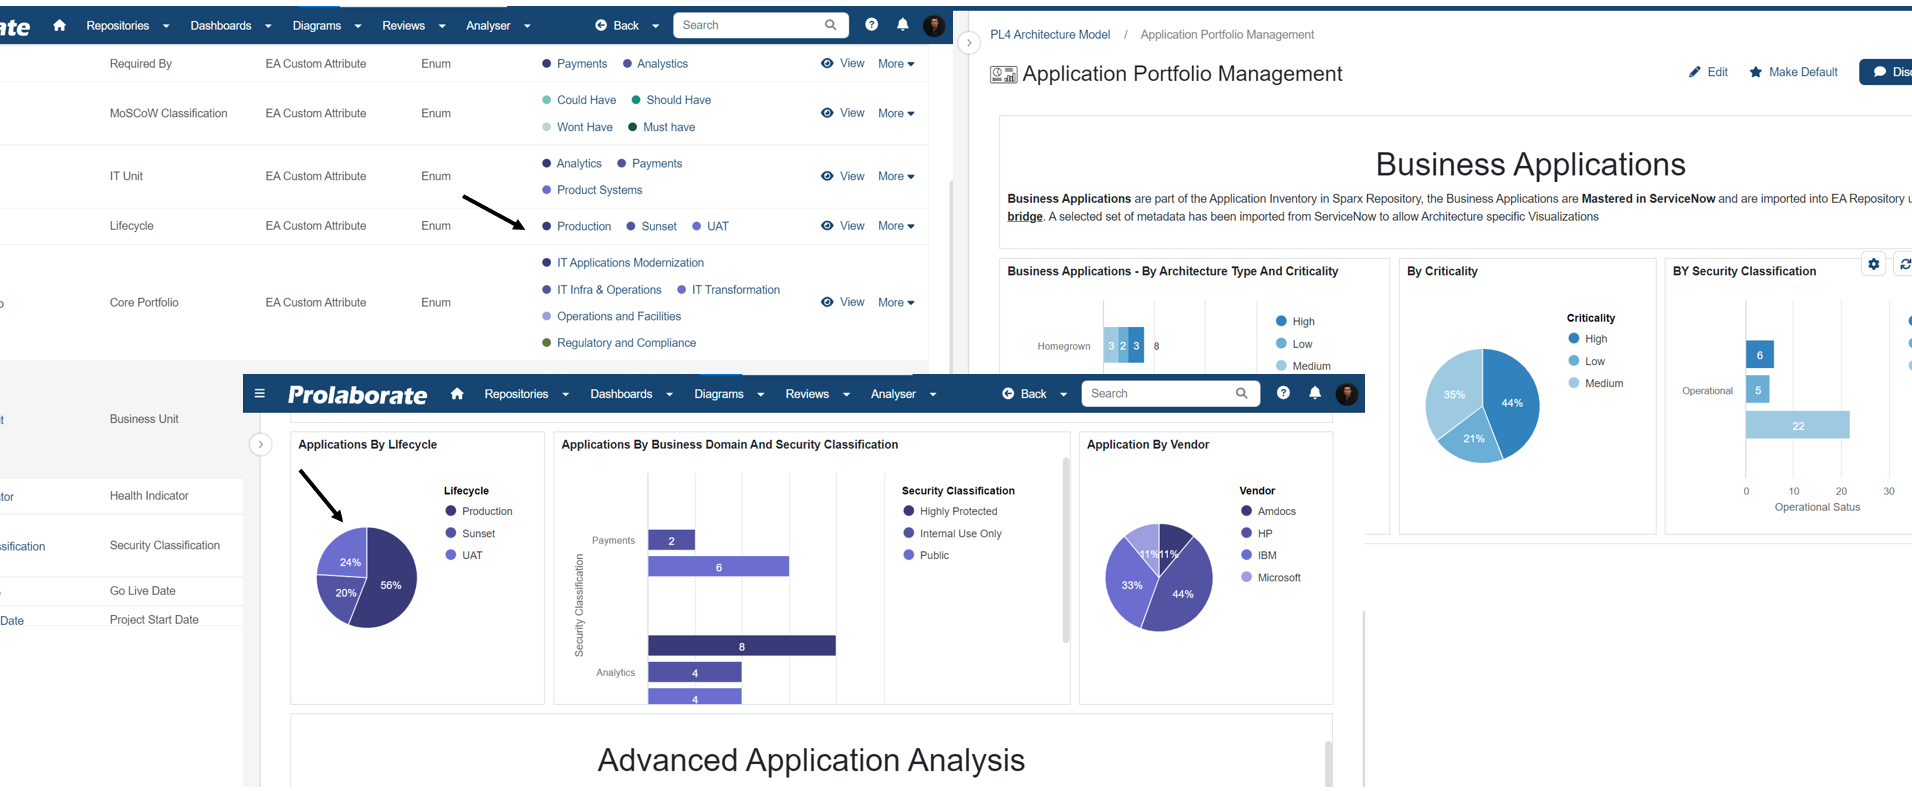
Below is a sample dashboard defined using MDG Color Configuration.
Problem Statement 3: Scale up uniform visuals across architecture dashboards
As we mature through the process, it becomes a necessity to define multiple dashboards that cater to different stakeholder groups. It is a mundane task for a person who is setting up these dashboards to refer across dashboards to find which color is for which property. This allows users to follow various colors across the repository. As a result, they end up creating dashboards in different colors.
Showcase uniform visuals across architecture dashboards
MDG color configuration comes very handy in applying the uniform color for the tagged values across models. This helps us in creating various dashboards for diverse stakeholder groups with matching standard colors. In the below example we have shown multiple dashboards and the colors for the properties used in these dashboards at one place.
Note:
- Please click the following link to read more on how to configure MDG Color Configuration