
Design charts and reports quickly by using predefined reports
Design charts and reports quickly by using predefined reports
Feature Spotlight: Report Configuration
Creating charts and reports from scratch can be a tedious process. More often, there is a need to generate them quickly. With this in mind, Prolaborate has introduced a new feature called “Report Configuration” which allows you to predefine and store charts and reports configurations as a report to reuse them later. Report Configuration reduces the users time and effort to create new chart and report widgets in Prolaborate.


Benefits of Report Configuration
- Quickly generate reports and store them
- Simplified creation process
- Saves time by reusing these reports when creating new Chart and Report widget
- Reduces user efforts by eliminating the creation process from scratch
- Reports can be used for all chart and report widget types
Features of Report Configuration
- Query creation with Placeholders to generate dynamic reports
- Simplified creation process
- Transfer configured reports from one instance to another using import/export
- Save existing configuration as a report
Let us understand how to use Report Configuration with an example
A user who has to create chart and report on a regular basis will benefit from Report Configuration. As mentioned earlier, creating charts and reports from scratch every time can be a tedious process
Here, we have covered a simple use case, wherein a user can create and use the predefined Report Configuration in Prolaborate.
Let us see how we can achieve this.
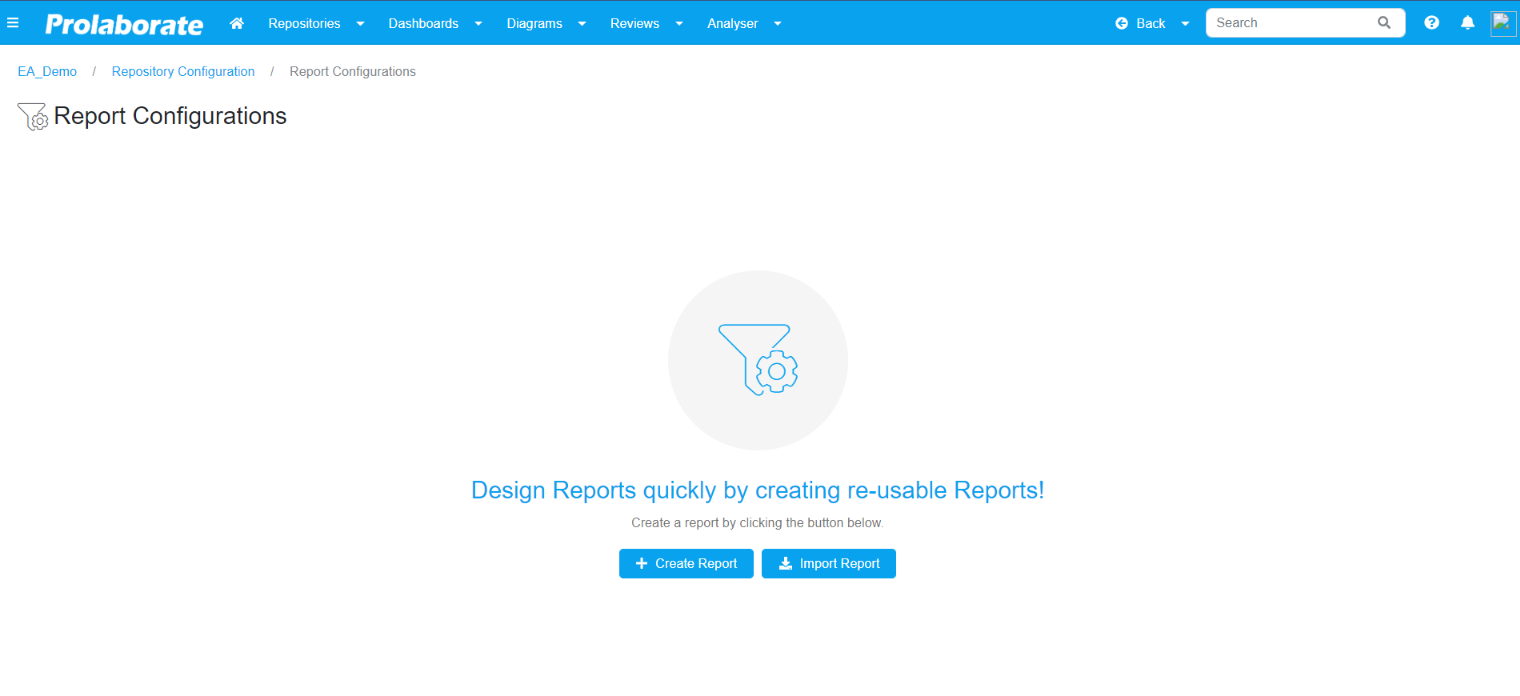
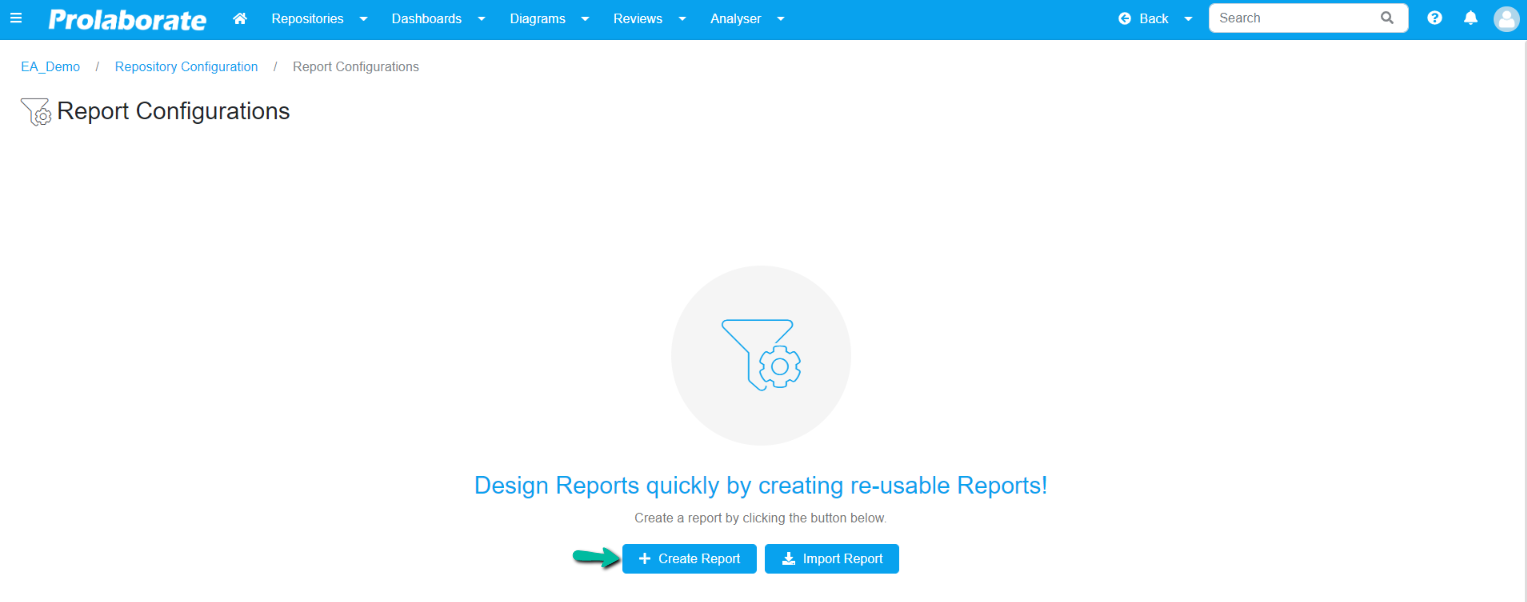
Step 1: Click Create Report in the Report Configuration page.
Step 2: Enter a suitable name and other required details. Enter the Query based on your requirement.
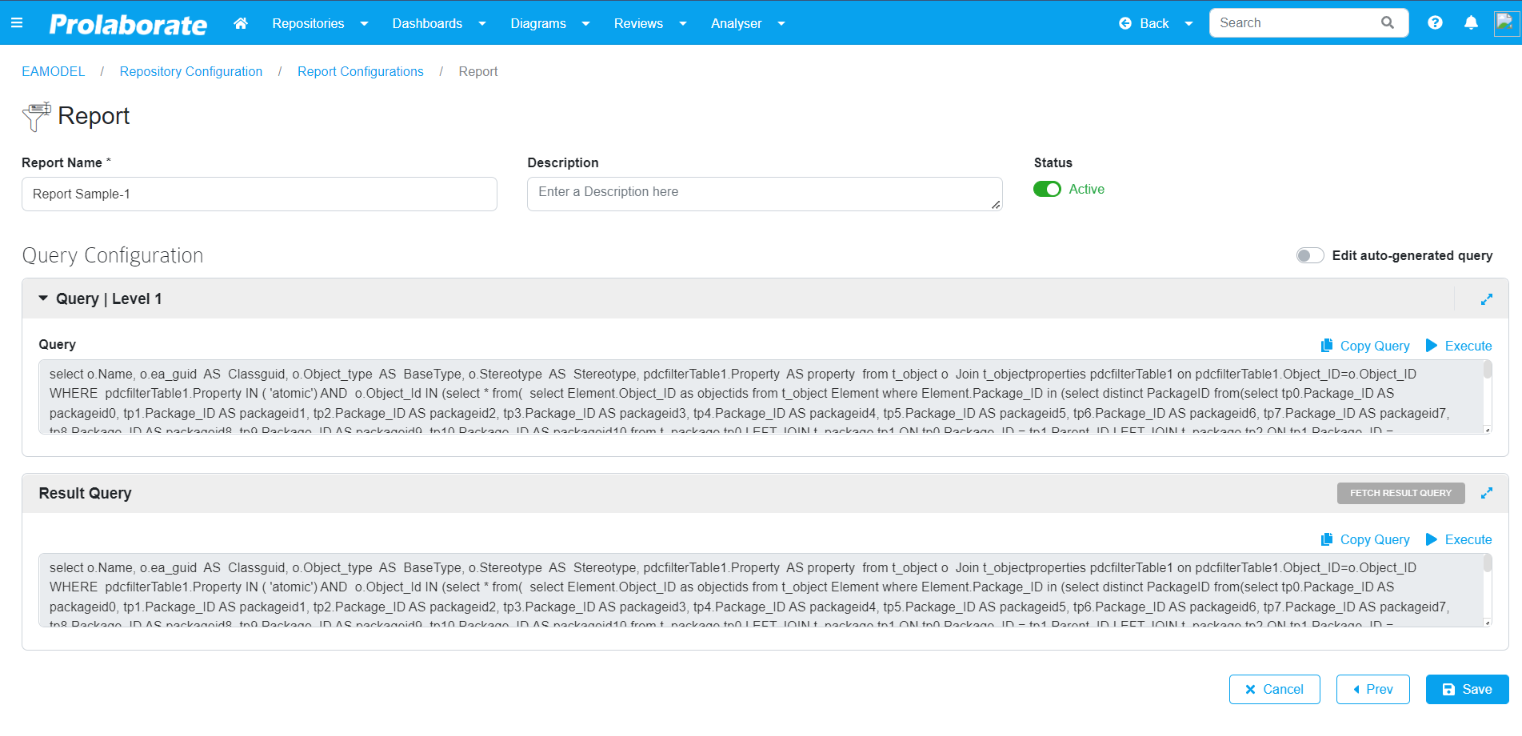
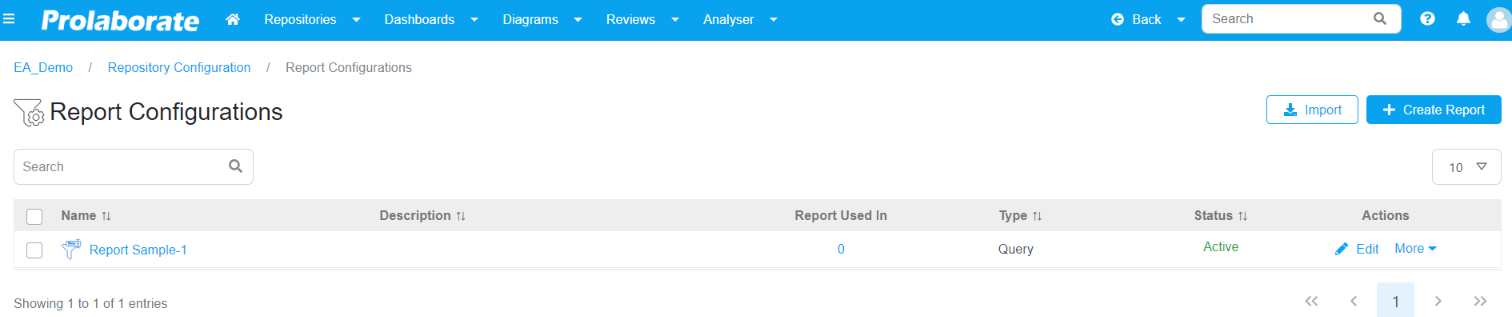
Step 3: Click Save. User will be redirected to the listing page once it the report is saved successfully.
Step 4: Create Dashboard and ‘add chart’ or ‘report widget’. In this example, select a chart widget. A popup window will then appear containing the list of reports created using report configuration.
By simply selecting a report, you can create the chart.
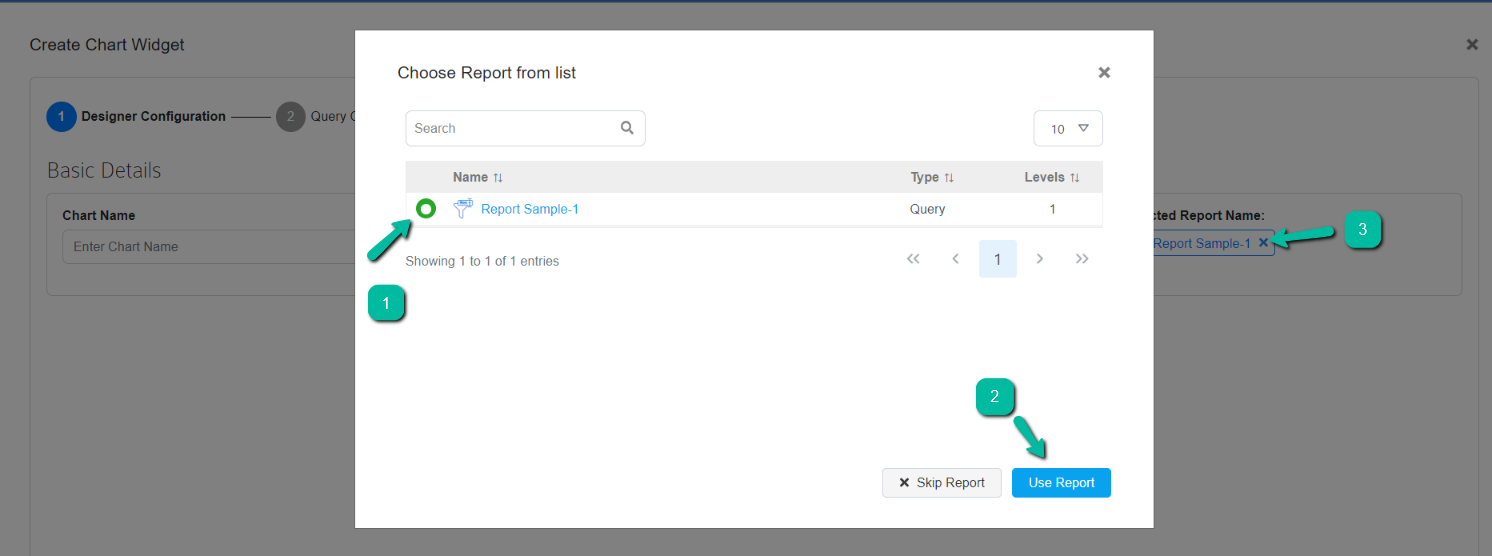
Step 5: Click Use Report to use the report to configure the chart.
Step 6: Choose a chart type as required.
Step 7: A popup will appear displaying the list of Placeholder if entered in the query. Enter the Placeholder Value in the respective fields. To know more about placeholders, click here.
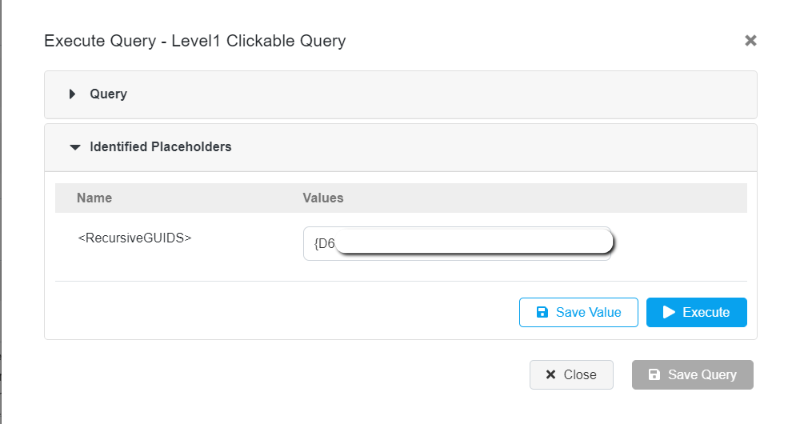
Step 8: After saving the placeholder values, user automatically gets redirected into the query configuration. The previously configured query is reused in this section.
Step 9: Click Next.
Step 10: User can make changes in the Chart settings and Click Save to apply the chart settings.
Step 11: Click “Save” to apply the configuration in the dashboard.
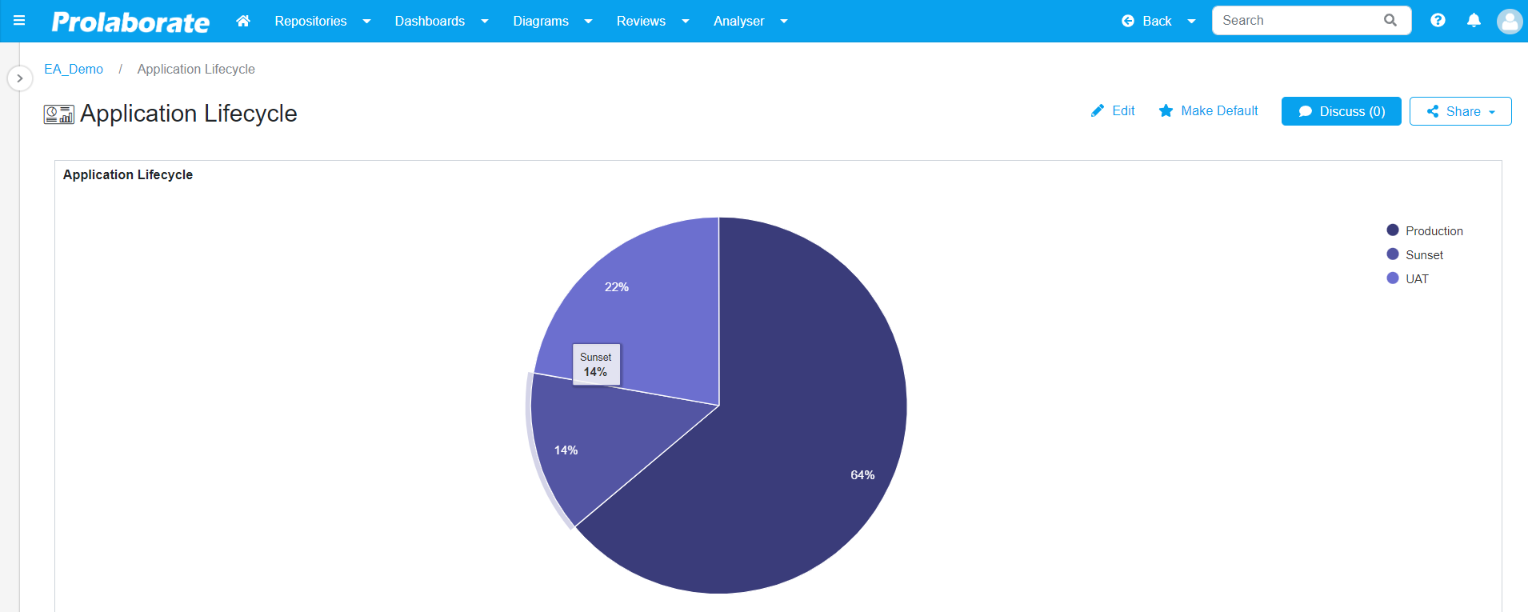
Sample Chart created using Report Configuration
To learn more about Report Configuration, click here.