Subreport in Charts
Subreport in Charts
In Prolaborate, Subreport displays filtered information in a table view when a dissection of the chart is clicked. The sub-report can be rendered in two ways,
- MDG Based Subreport
- Clickable Query
MDG Based Subreport
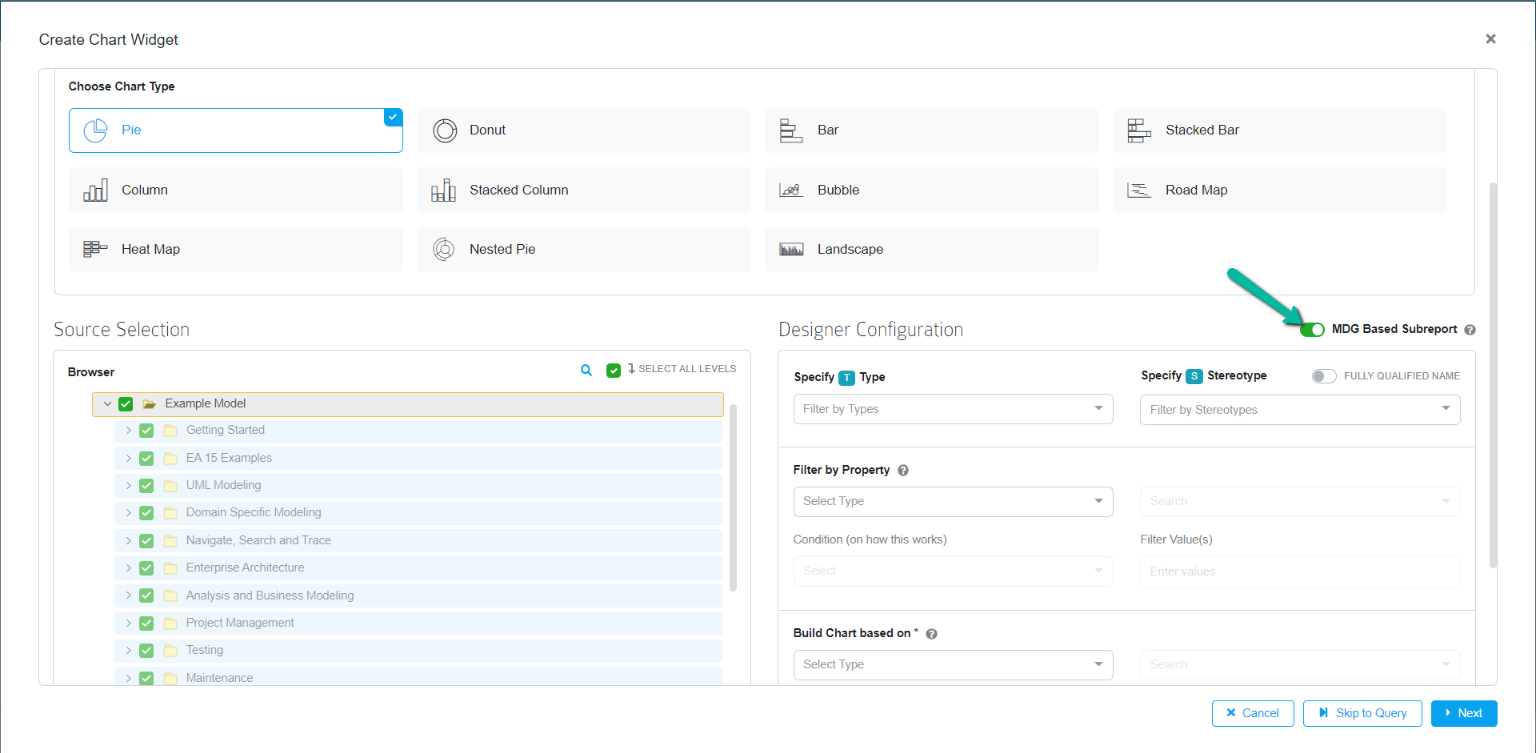
The new MDG based sub-reports feature in charts allows users to pre-configure column names on a report. The configuration must be set at stereotypes using MDG Form Designer. Based on the pre-configuration, Chart Widget populates column and data automatically on a table. Users can simply click on any dissection of a chart to view its information in an expanded view, and filter the data based on stereotypes, as needed once the option is enabled.


Note:
- MDG Based Subreport option will be available when creating a chart widget. This feature is available for all types of charts except Roadmap, and it is auto enabled during creation of chart widget.
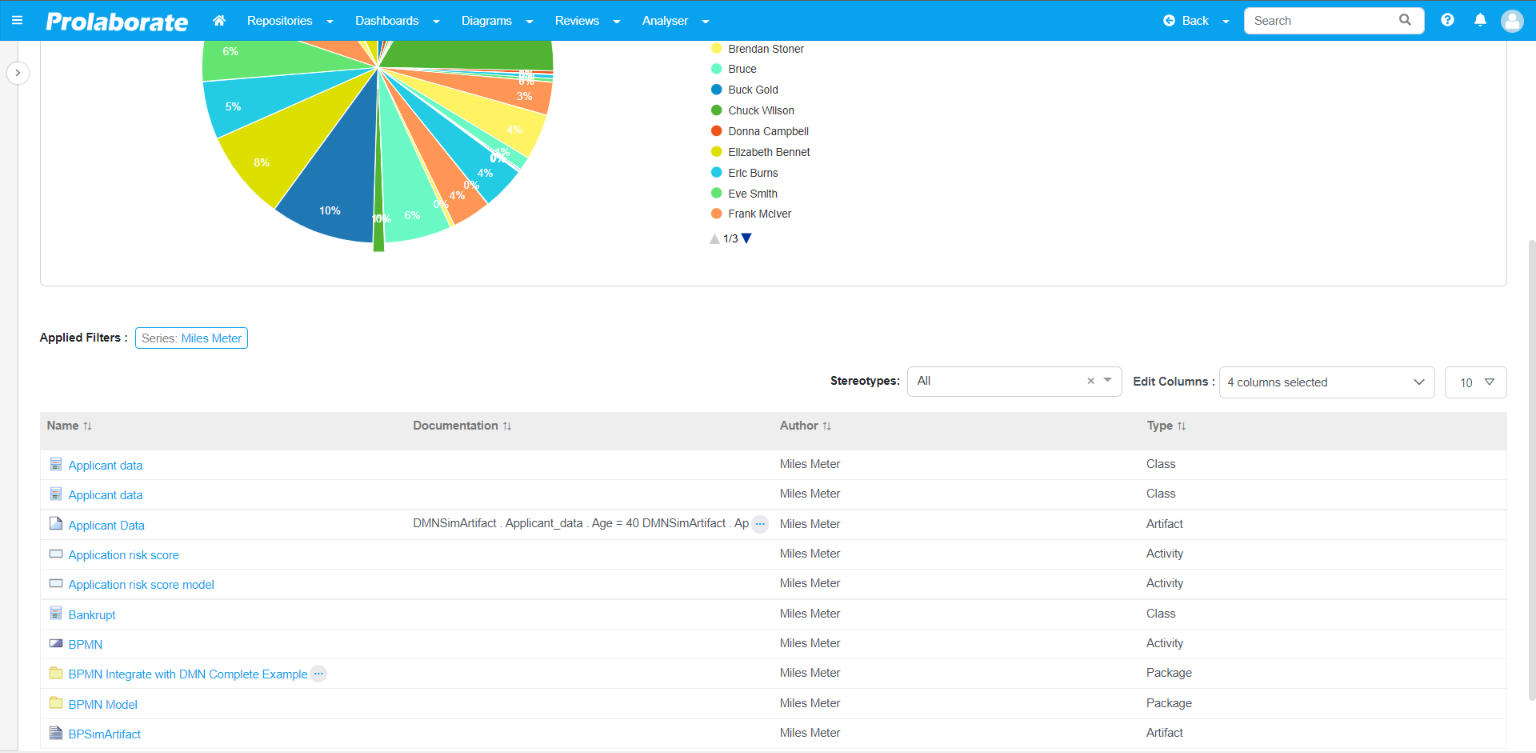
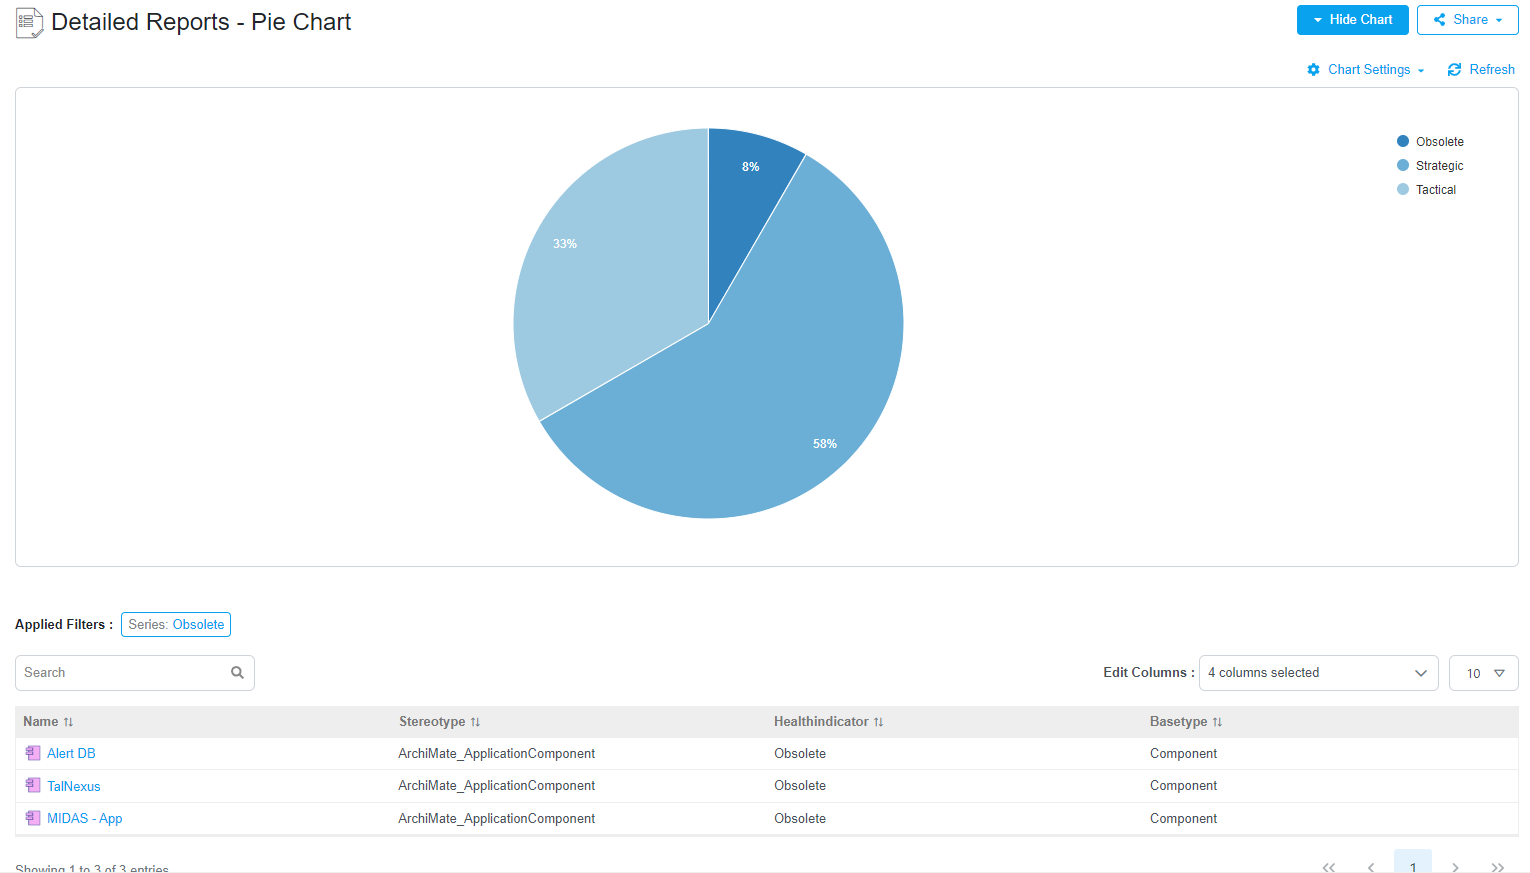
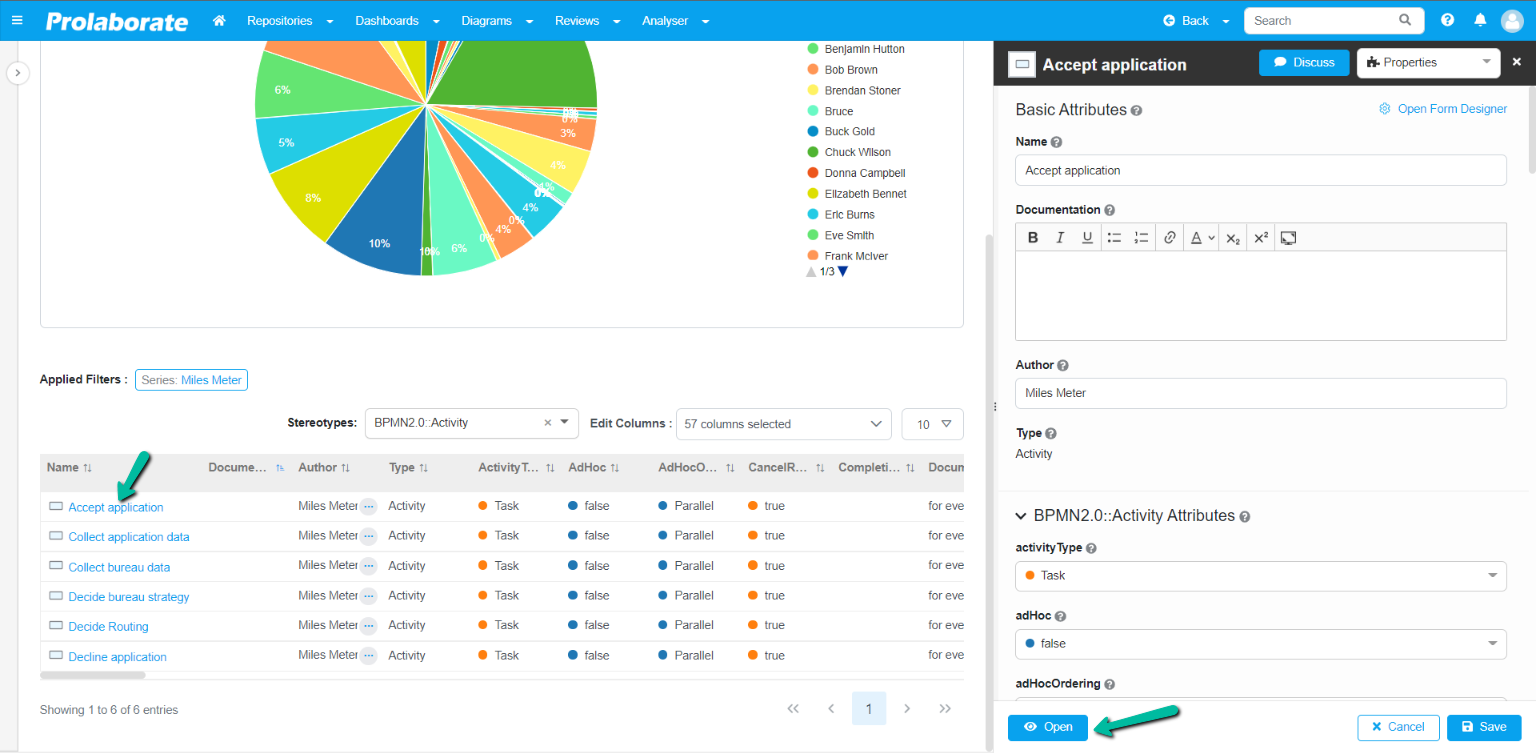
With the MDG Based Subreport option enabled, a filter named Stereotype will be available at the top of the table. By default, ‘All’ option will be selected and the report lists all the stereotype as per Source & Configuration. Click the drop-down menu to see the list of stereotypes available based on the configurations made earlier.

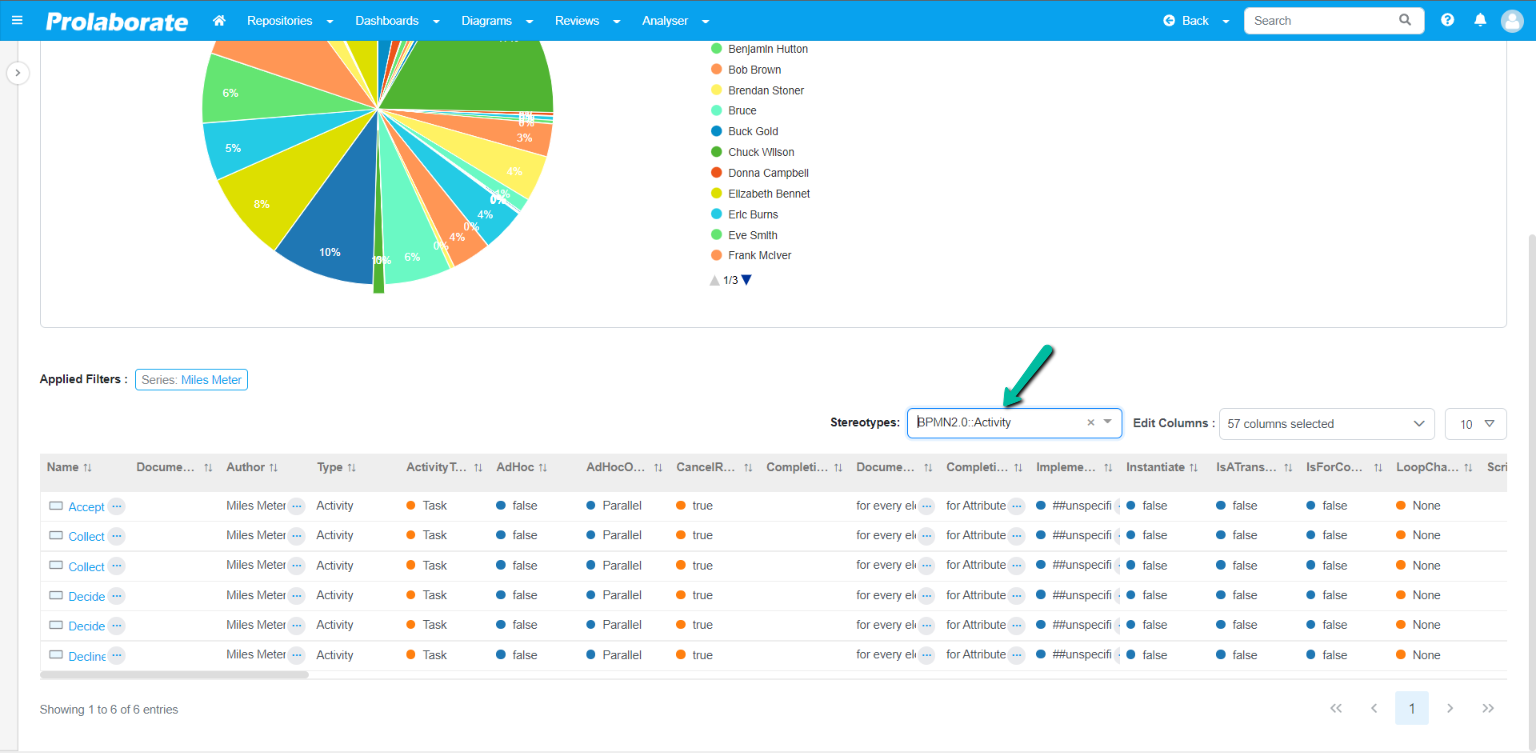
Choose the required Stereotype available from the list to apply the filter and display information in the following report table. Note that the columns rendered in the report will be based on the properties configured for that stereotype in Form Designer window.
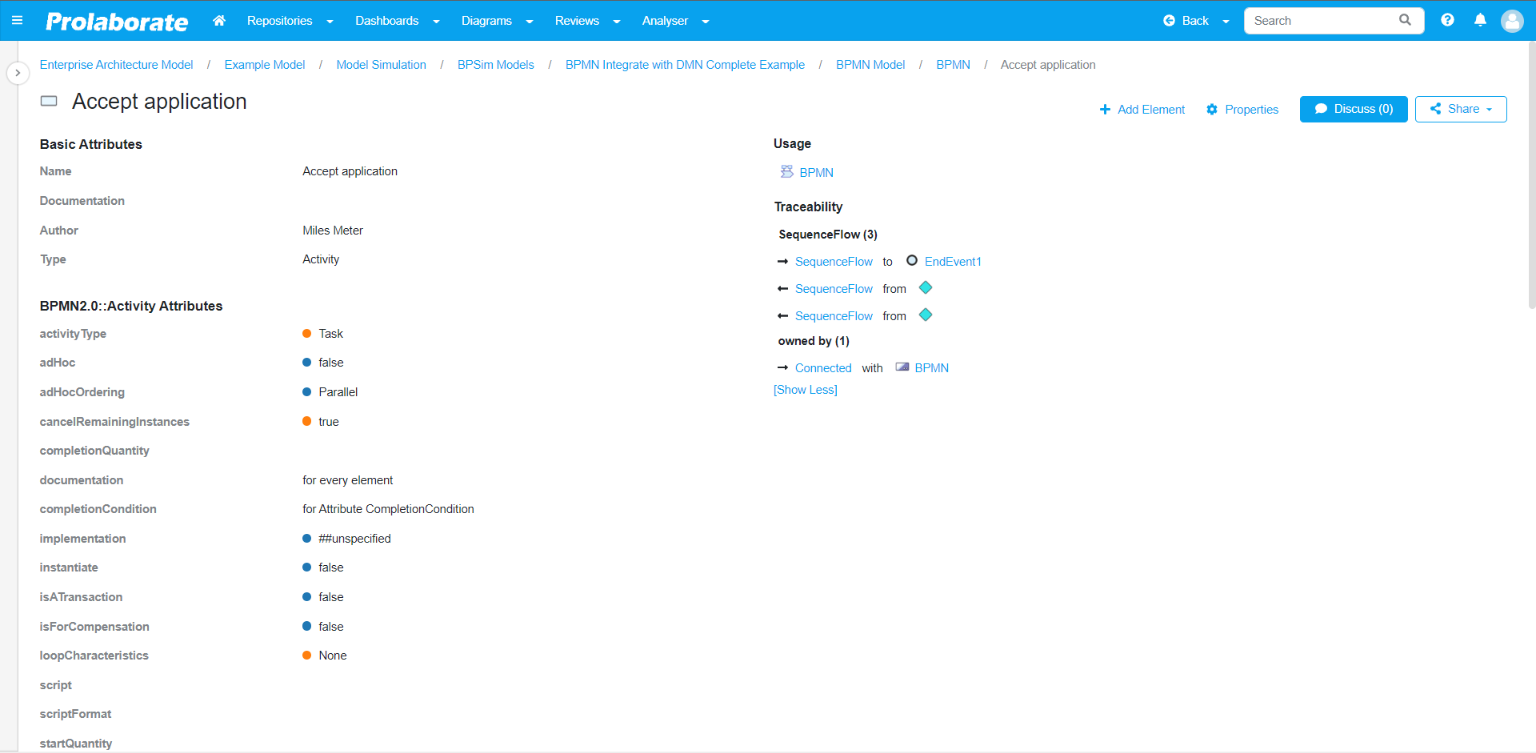
Click on the artifact name to open the properties tab where one can edit the attribute details if required. Click open to open the overview page of the artifact.
Clickable Query
Users must give specific keywords to make a query into a clickable query A clickable query also makes the dissections of the chart clickable. When a dissection is clicked, a report is rendered below. The report displays filtered information with additional details about each artifact based on the column names written in the query with aliases. Do follow the below points to enable clickable query.
- Add alias “classguid” to the GUID to open the properties tab of the artifact when clicked on it in the report.
For example: - Add aliases – Base Type and Stereotype to Type and Stereotype respectively to see appropriate EA icons n the report.
For example:
select name,ea_guid as classguid from t_object where object_type = '< series >'
- Add prefix “hide_” to alias in order to not see a column in the report even when used in the query.
For example:
select name, object_type as basetype, stereotype as stereotype from t_object where object_type = ‘< series >’ and stereotype= '< groupname >'
Disabling MDG Based Subreport option will enable ‘Enable Clickable Query’ and ‘Query field’ in Query Configuration page. For a clickable query, users need to key in the query with the keyword in the ‘Query field’.
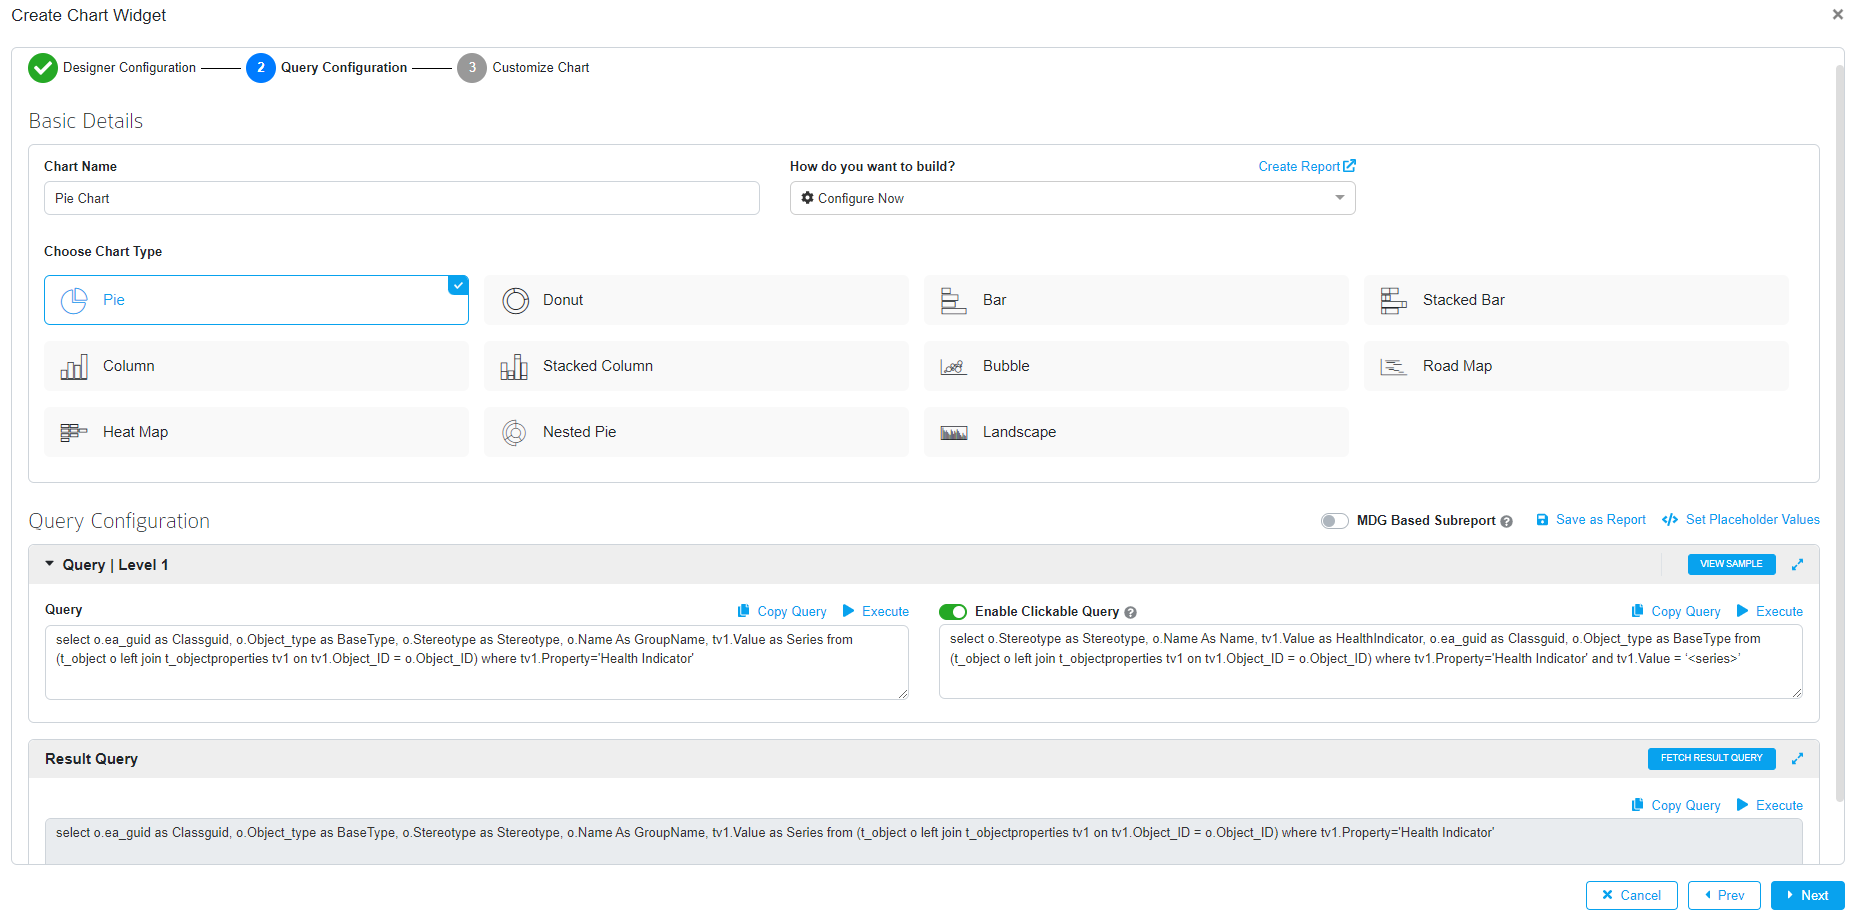
The below screenshot shows the how filtered information in a report based on the columns mentioned in the clickable query field is displayed in a pie chart.