Do Impact Analysis
Prolaborate’s Impact Analysis feature helps you visualize relationships and dependencies between elements in your Enterprise Architect (EA) models and make better decisions.
This guide provides an overview of how you can create and customize Impact Analysis views and save them for easy access.
Create Impact Analysis Views
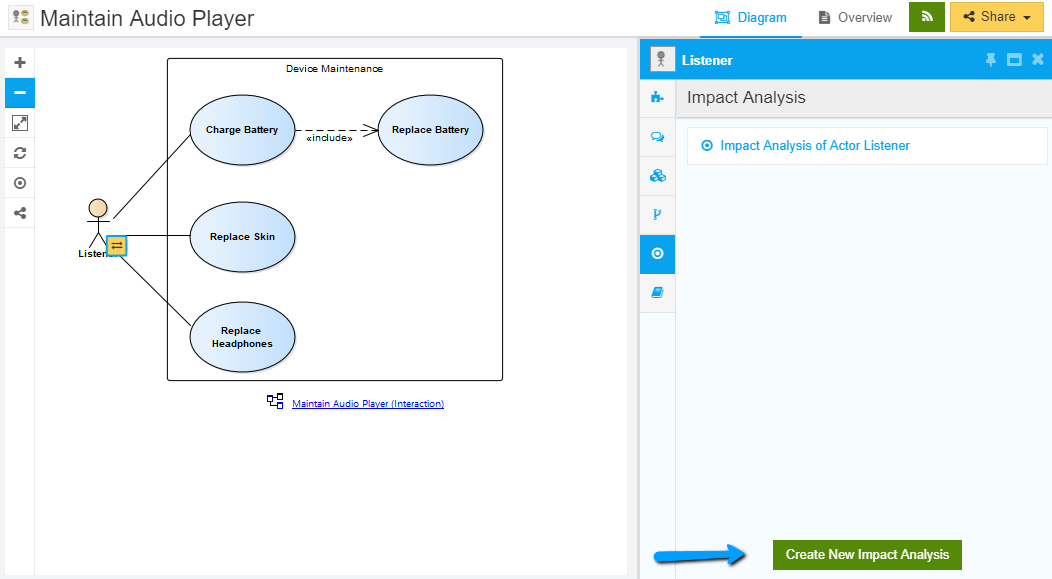
From the Properties window, click on Impact Analysis tab. The list of Impact Analysis views created for that element will be shown. Click on Create New Impact Analysis.


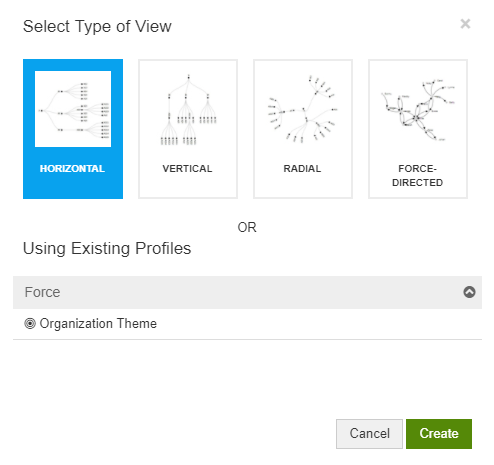
A popup will be shown to choose the type of Visualization. You can choose any one.
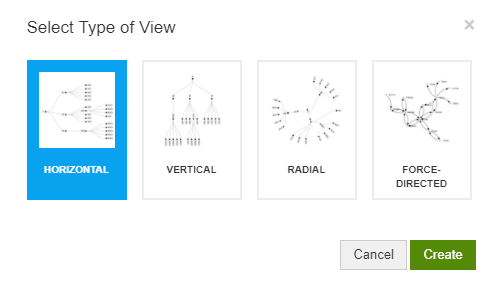
Let’s see how the same element is represented in these visualizations.
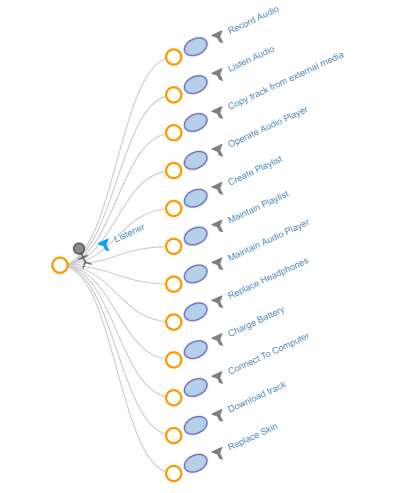
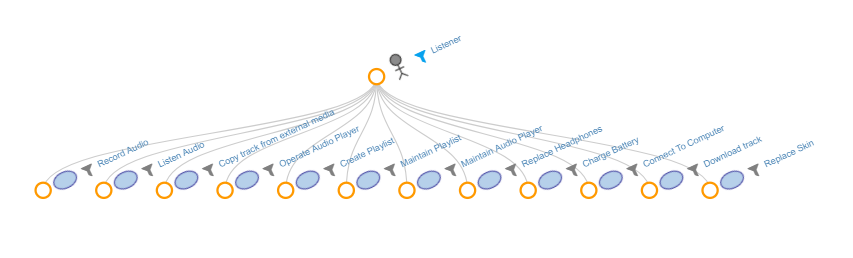
Horizontal
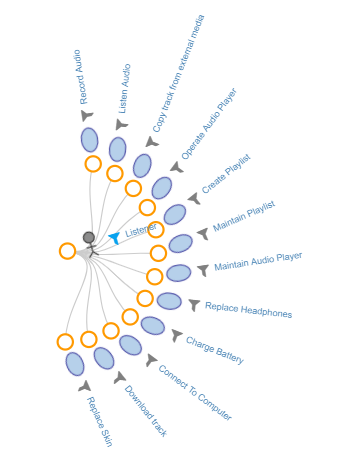
Vertical
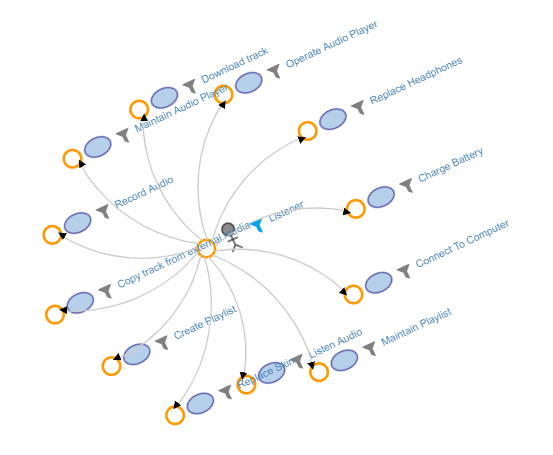
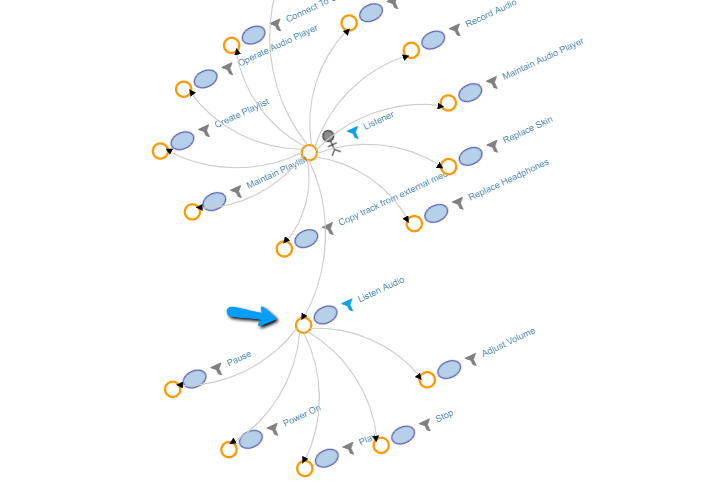
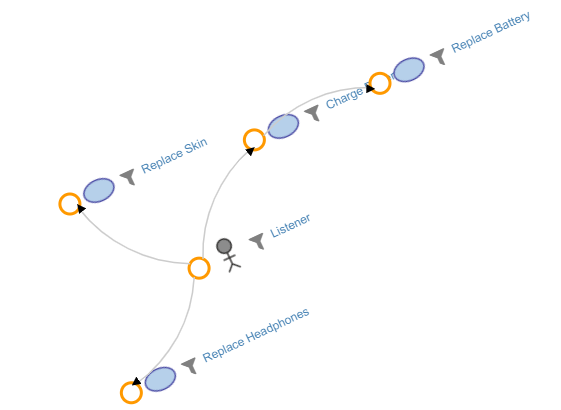
Radial
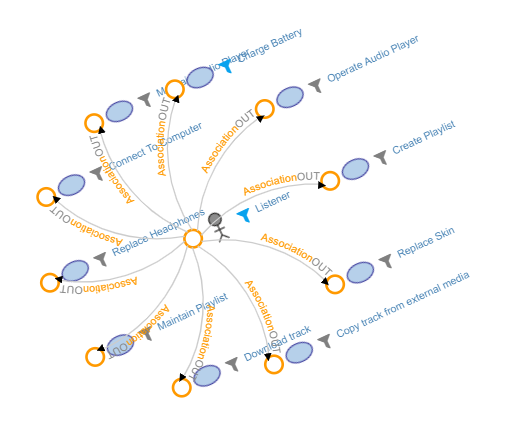
Force-directed
View Relationships
At first, the view shows the elements which are connected to the root node i.e., the element from which you created this view.
Click on a node to see the elements it is connected to. Node level filter will show up and the details of elements, connectors and flow direction will be shown.
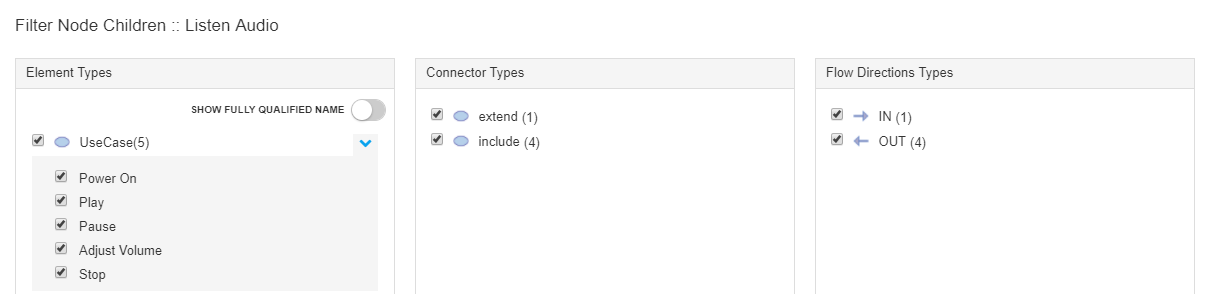
Select or deselect the items you want to filter out and click on Apply. All the connected elements will show up.
If in case, there are no elements connected to this element, you will get a message saying “Leaf node reached”.
Filtering out Tree Nodes
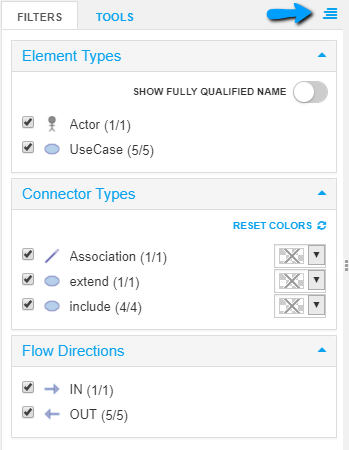
Apart from the node level filters, you can also choose to filter out elements from the view using view level filters.
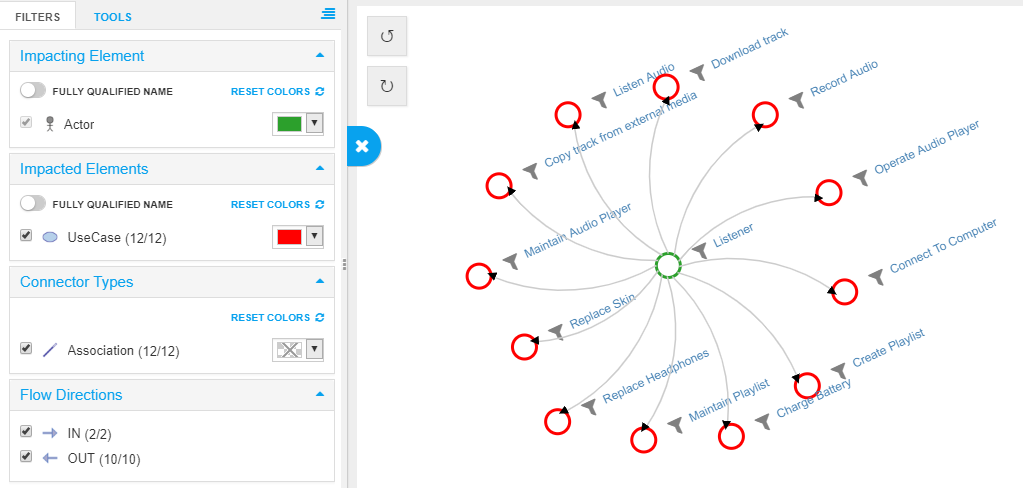
Filters also provides a summary of elements. Number of elements shown / Total number of elements will be shown alongside the filters.
While using filters in “Diagram as Impact Analysis” and Force-directed views, unchecked elements will be available in view till all the destination elements are unchecked from the filter list. Only the connectors will be removed.
For example:
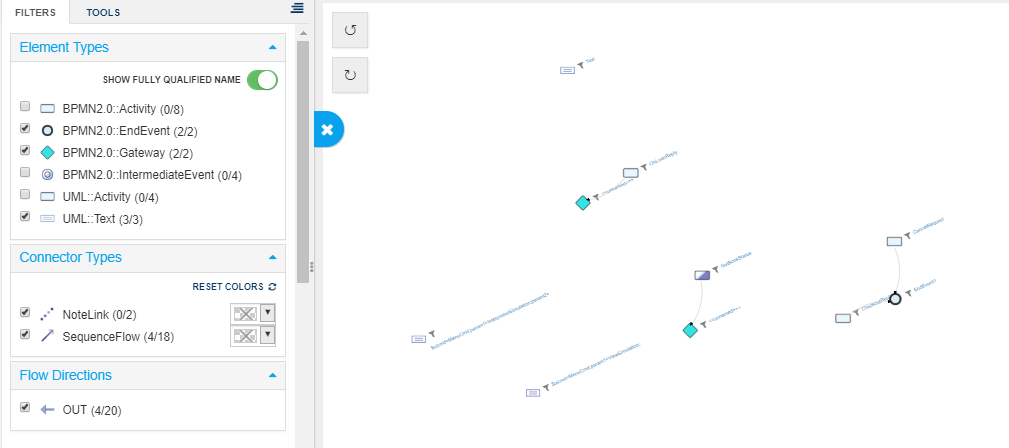
This is the Diagram as Impact Analysis view of Book Lending example from EA Example:
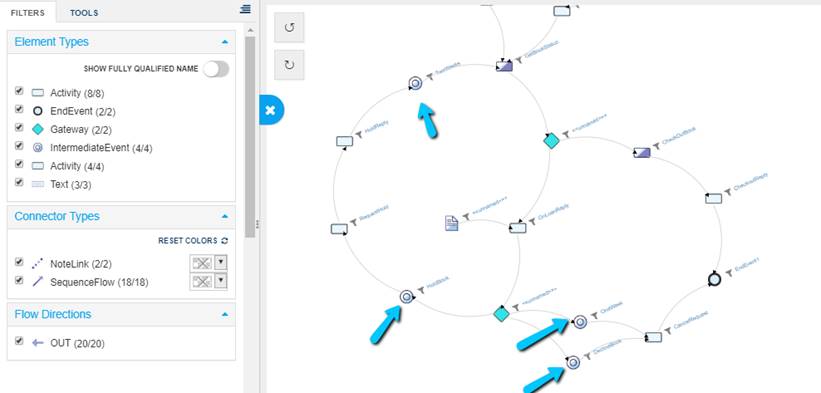
When I uncheck IntermediateEvent,
- all nodes of IntermediateEvent will still be available in the view until their destinations (E.g: CancelRequest is the destination of DeclineBook) are not filtered out
- Only connectors will be removed
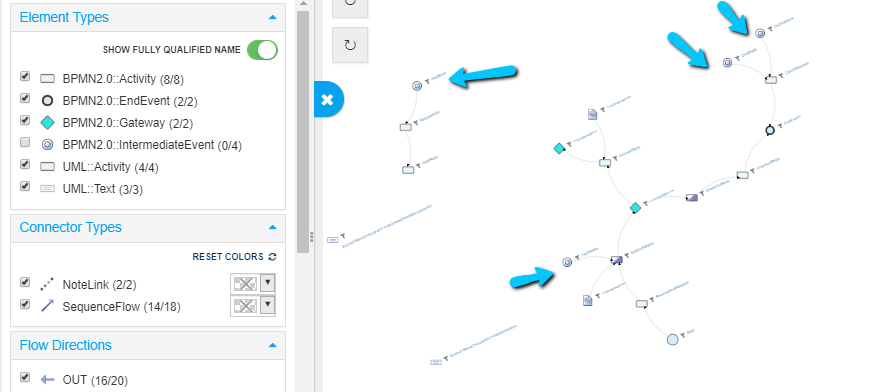
Intermediate Event nodes will go away once its destinations are filtered. The destinations were Activity nodes from BPMN and UML. I have filtered them.
Note: “Hide” takes higher priority than “Show” i.e., if an element is hidden in any one of view or node level filter, it will be hidden in the view.
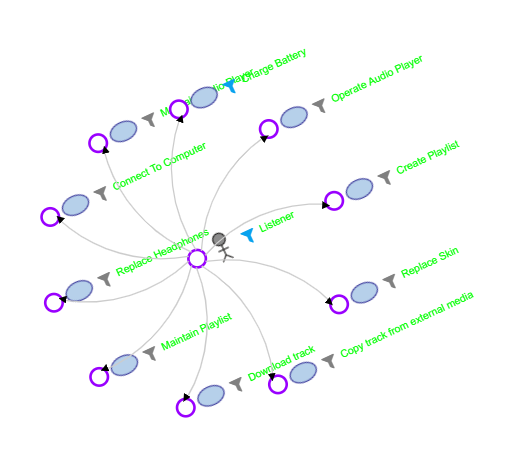
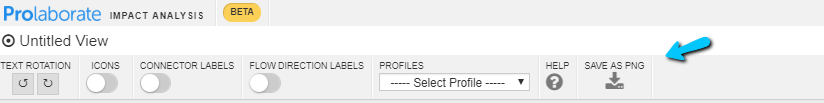
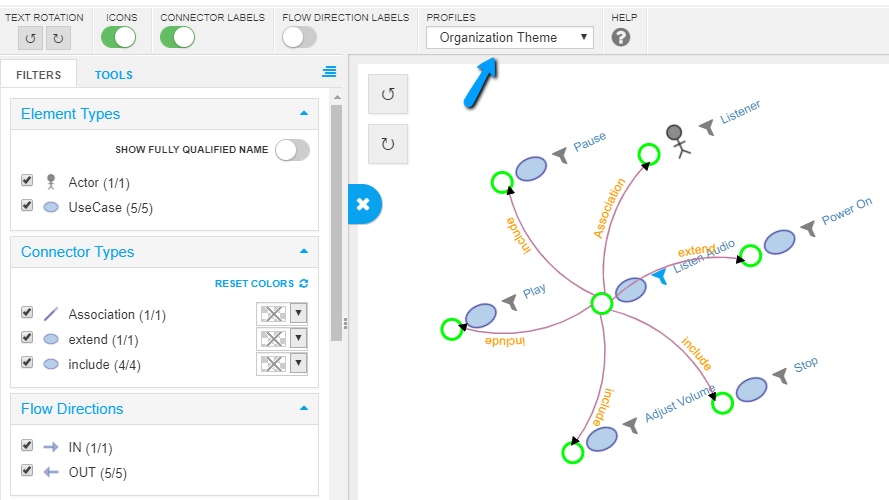
Changing Visibility of Icons and Labels
You can adjust the visibility of the view’s details using the following settings.
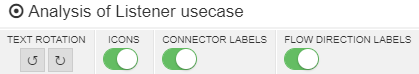
- Icons – Replace the circle icons with Element icons
- Connector labels – Shows the names of the connectors
- Flow direction labels – Show you the direction of flow of data
Note: Text rotation option helps you rotate the labels of the nodes
Customize the Look and Feel of Nodes
You can change the appearance of the nodes from Filters tab.
Or from Tools tab:
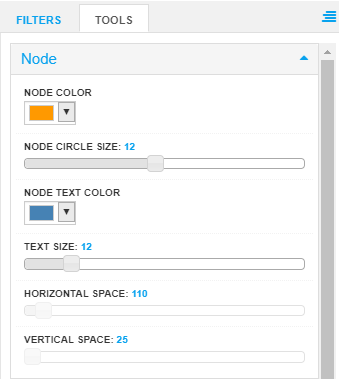
You can change:
- The colour and size of the nodes
- The color of a specific type or stereotype
- The colour and size of the text in the nodes
- The horizontal or vertical spacing between the nodes
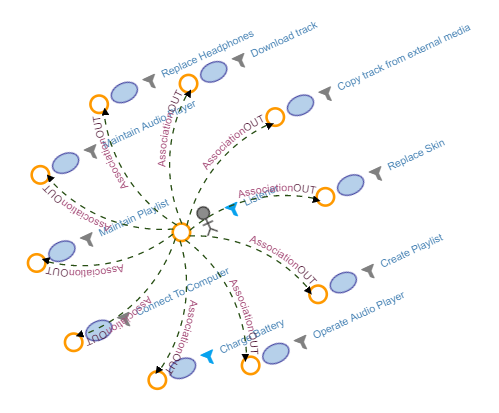
Change the Style of Connectors
The style of the connectors can be changed to straight lines or dashed lines.
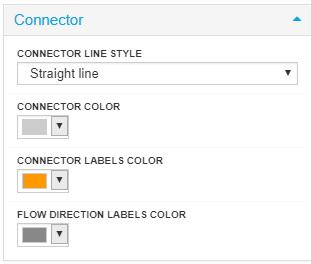
You can also change:
- The colour of the connector
- The colour of the connector label and
- The flow direction label’s colour.
Increase or Decrease the Size of the View
You can zoom in or out either by using mouse scroll or by using CTRL, + and CTRL, –.
Change the position of Filter and Tools
Click on this icon to move the Filters section to the right of the screen.
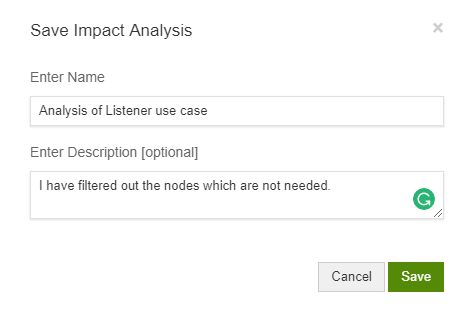
Save the Impact Analysis Views
Once you are done with all the changes in the view, you can save it to work on it later or to share it with your peers.
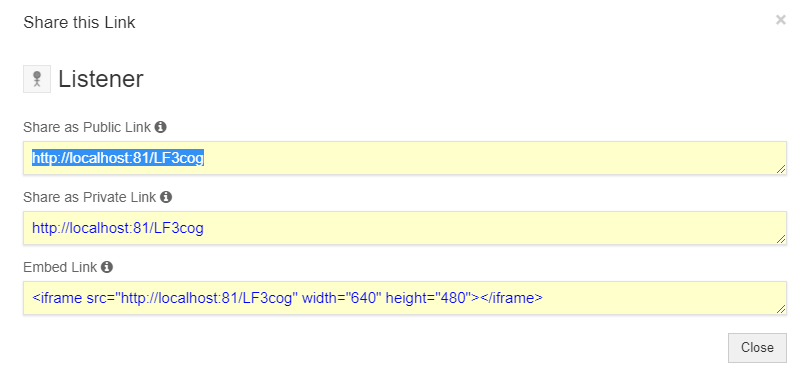
Share Impact Analysis Views
Once your analysis is done, you can share it with your peers using the Share link. They can see the views with just a single click.
You can also download the views as PNG image and share it with your peers.
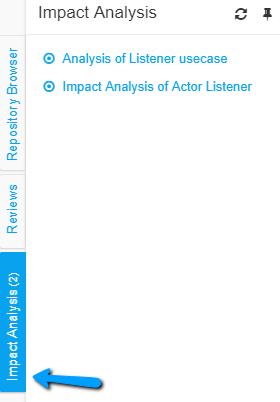
View saved Impact Analysis Views
Once you save the view, it will show up in the side bar as shown below:
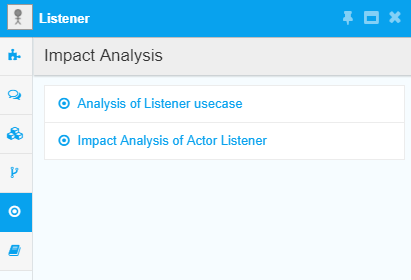
You can also view the created Impact Analysis views from Properties window.
Create a Diagram as View
This helps you view a complete diagram as an Impact Analysis view. Once the view is created, you can click on the nodes to see the element they are connected to. Open a diagram.
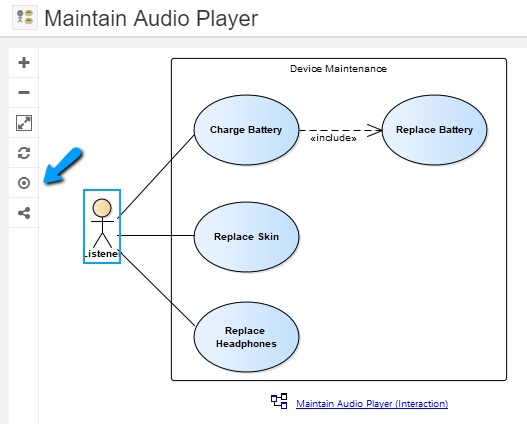
And click on View Diagram as Impact Analysis icon on a diagram.
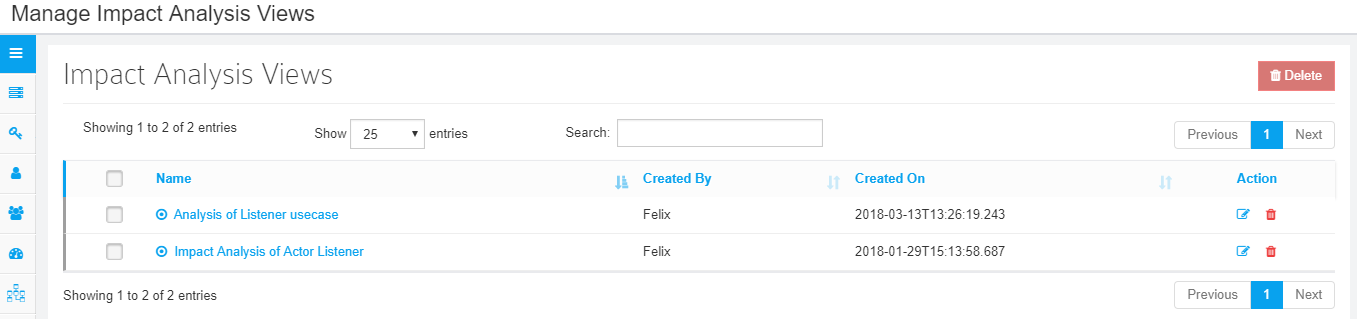
Manage saved Impact Analysis Views
Click on Menu > Impact Analysis Views to see the list of views that are created by all the users. You can edit or delete the views.
Create Impact Analysis Profiles
Impact Analysis profiles lets you save all your settings options so that it can be reapplied to other views.
After you have worked on the settings, click on Save > Save Profile.
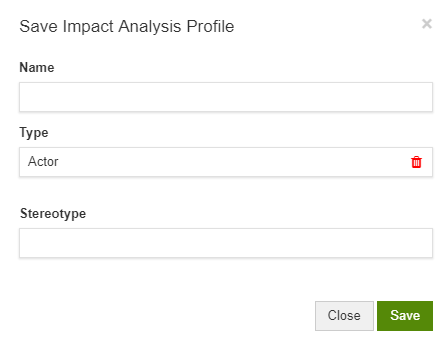
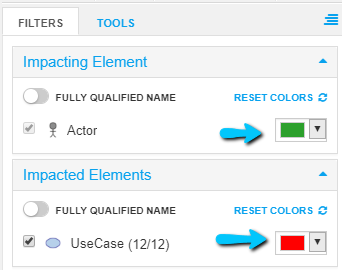
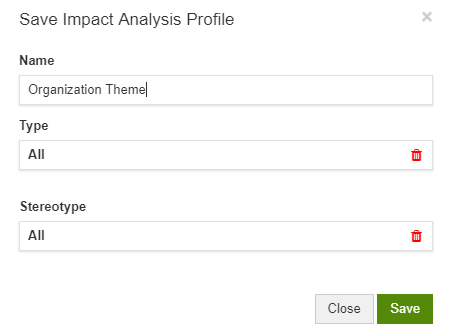
Give a Name to the profile.Type and Stereotype signify the type and stereotype of elements to which this profile is allowed to be applied. As per the setting in the screenshot, this profile can be applied only to elements of Type Actor ignoring its Stereotype. If you want this profile to be reused across any type of element, choose options as All and All.
Apply Saved Profiles
Once the profiles, it can be applied to views in two ways. One way is to apply a profile while creating a view. You can choose the profile you wish to use and click on Create.
Another way is to choose a profile from Profiles when working on the view.
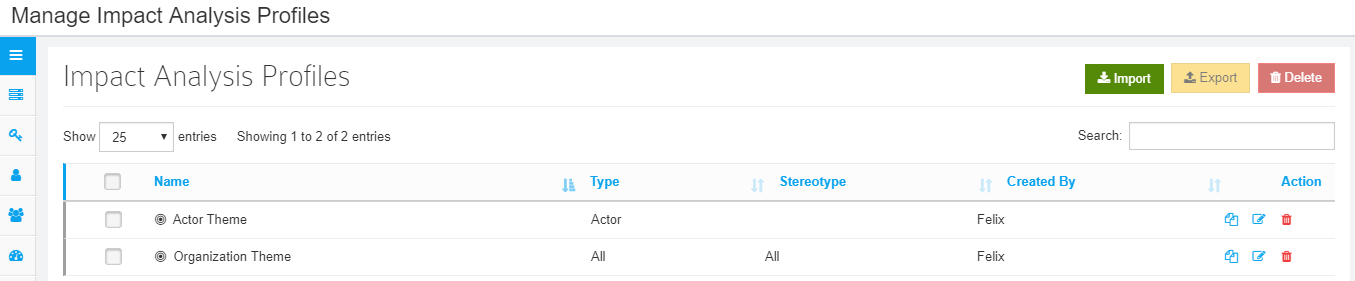
Manage Profiles
Click on Menu > Impact Analysis Profiles to see the list of profiles that are created by all the users. You can edit, duplicate or delete the profiles.