
Build EA Reports
Prolaborate allows you to generate dynamic reports faster by using information from your EA model. In this guide, we will look at how to build live reports. To know about the dashboard’s general features and how to create it, click here.
Create a list style report
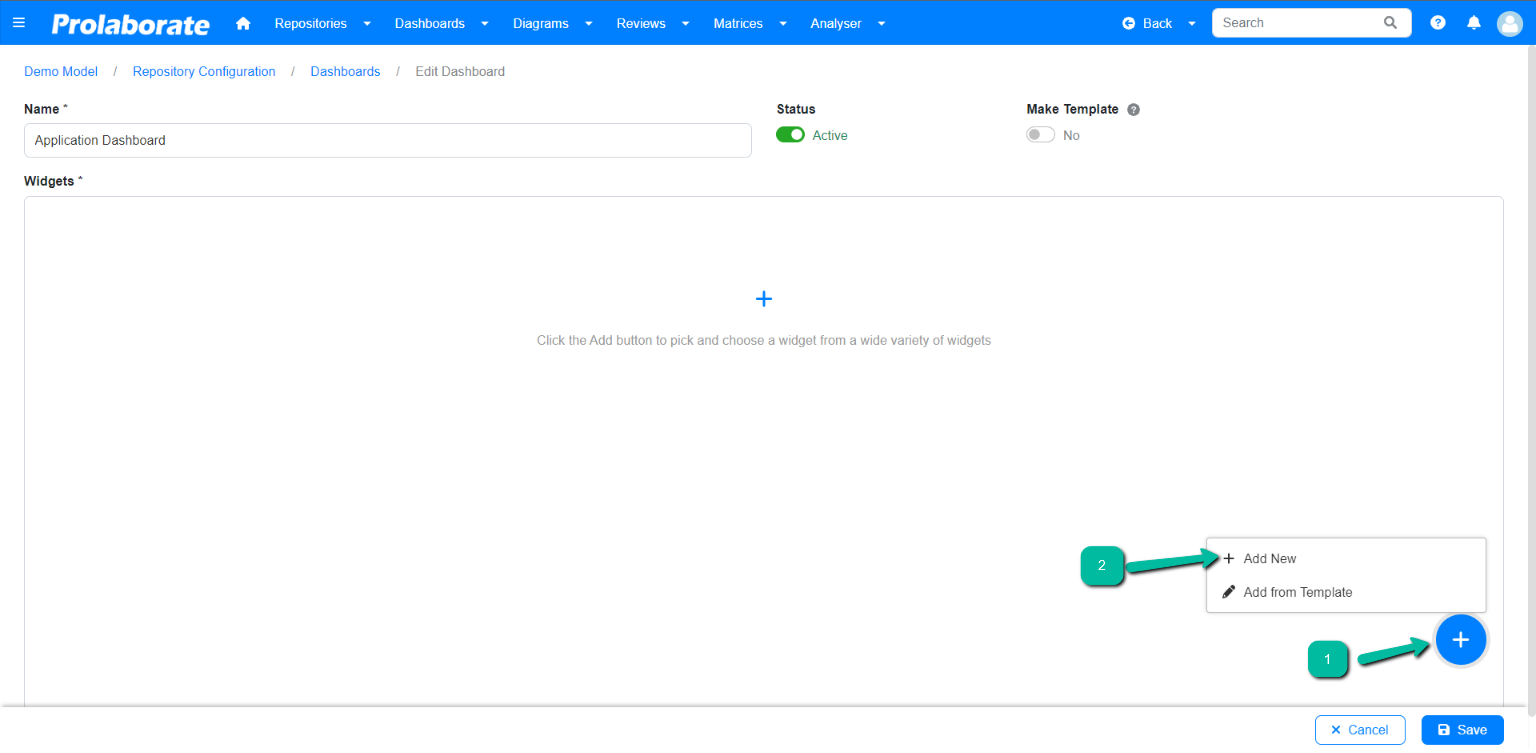
To add a report widget to a dashboard, click the Add Widget > Add New.


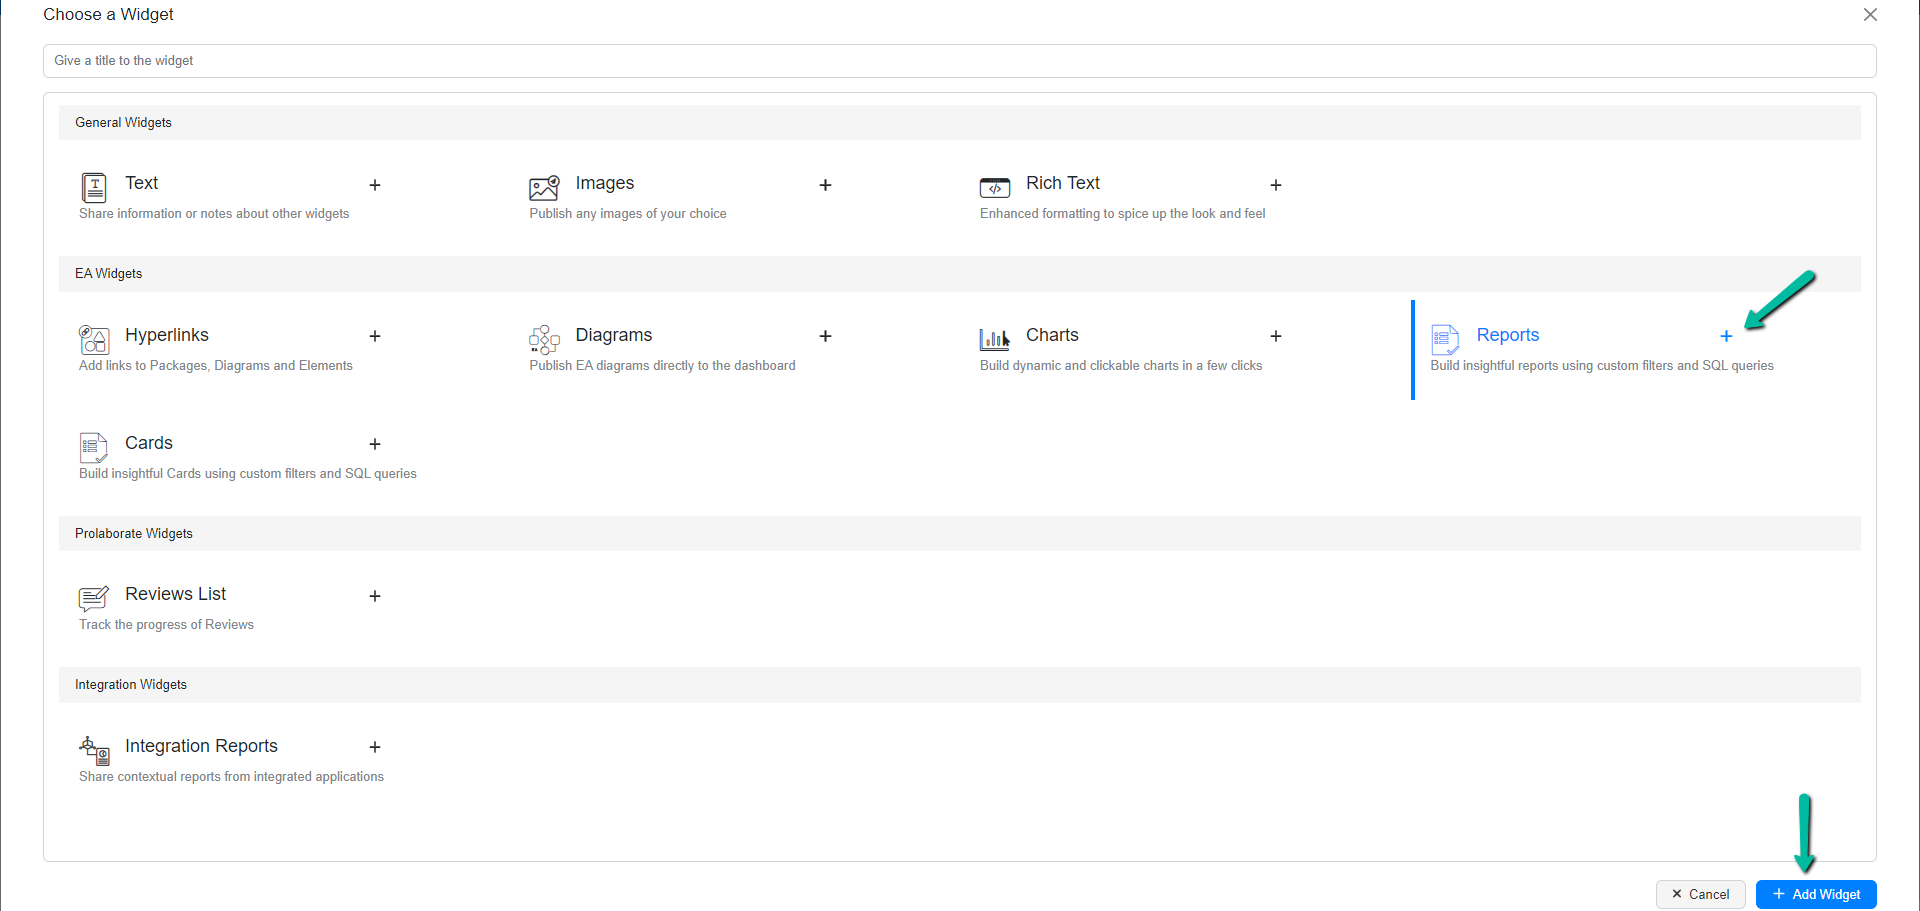
In Choose a Widget window, select the Reports Widget and click Add Widget
Stop creating reports widget from ground. Instead, reuse ‘Reports’ from Report Configuration
By default, existing reports from Report Configurations page are listed in a popup window. Both designer type and query type report of single level are listed. Users can either apply reports or create a report widget from scratch by selecting details.
Click here to know more Report Configurations.
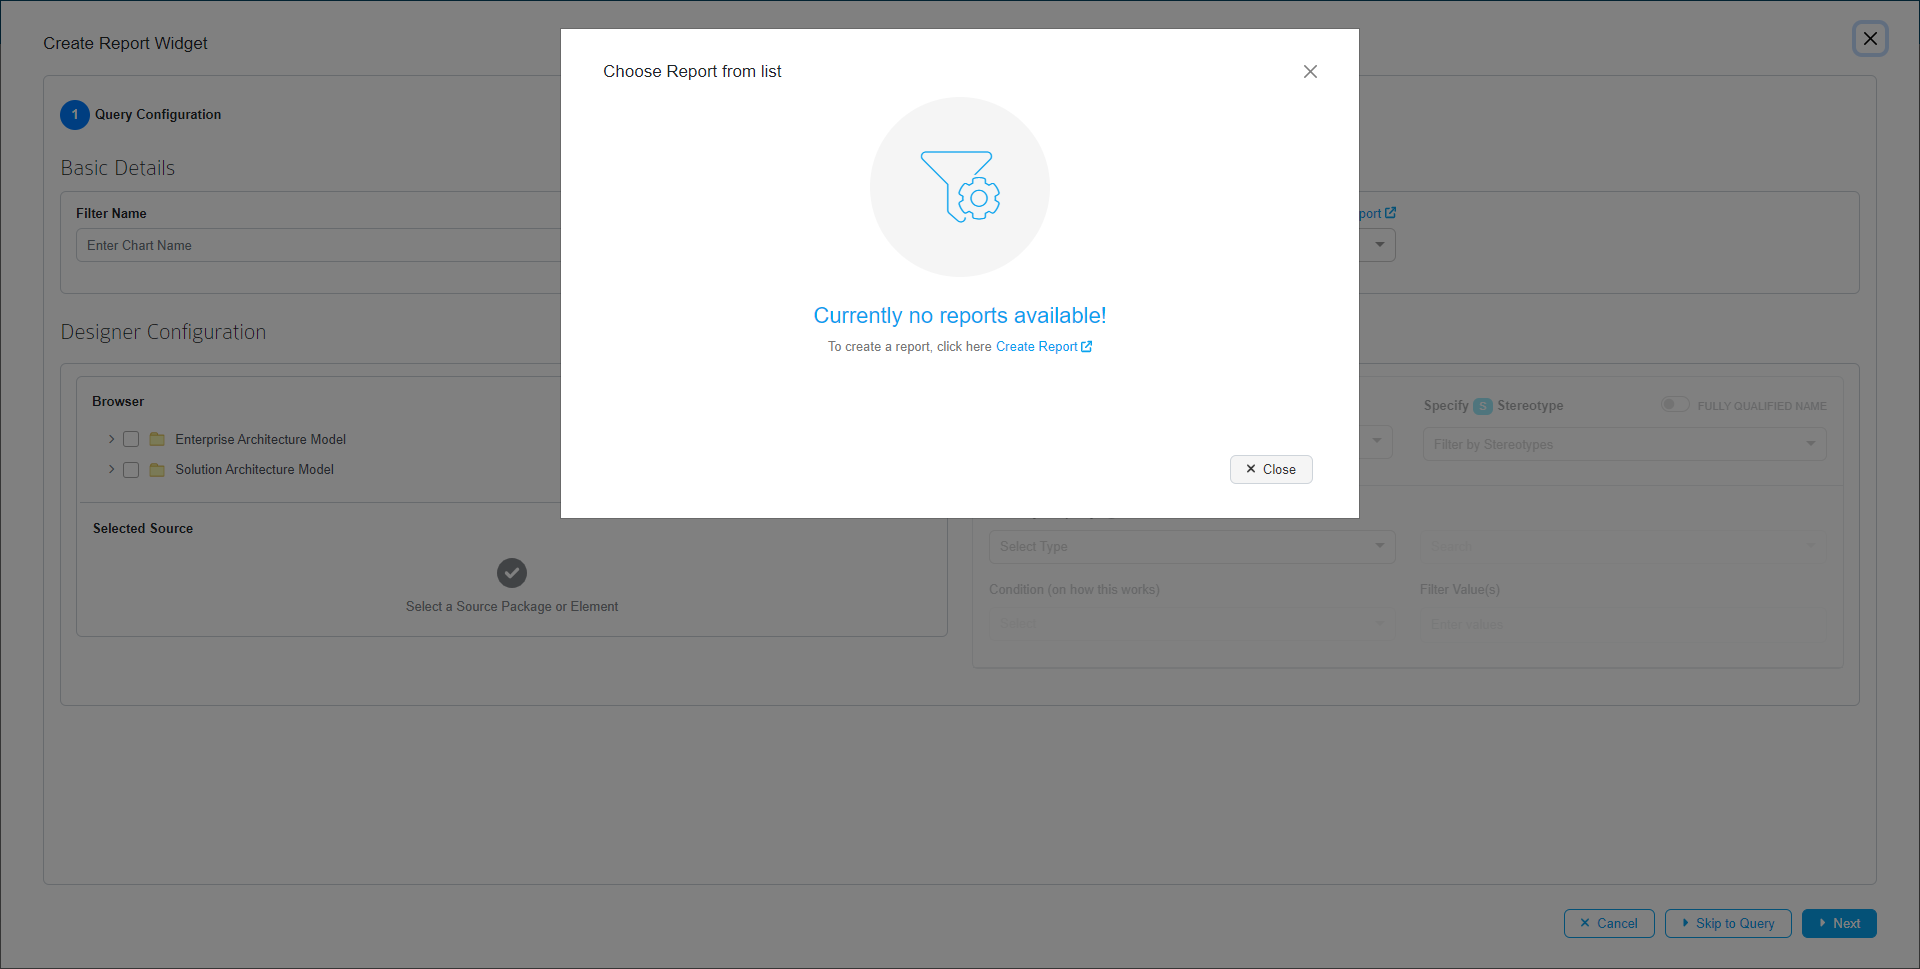
Click Skip Report to land on the designer configuration section of EA Report Widget
Build Report Widget using Designer Configuration
Designer allows users to build reports widget with a few configuration steps without using queries. Using designer, reports can be configured simply by selecting the filters.
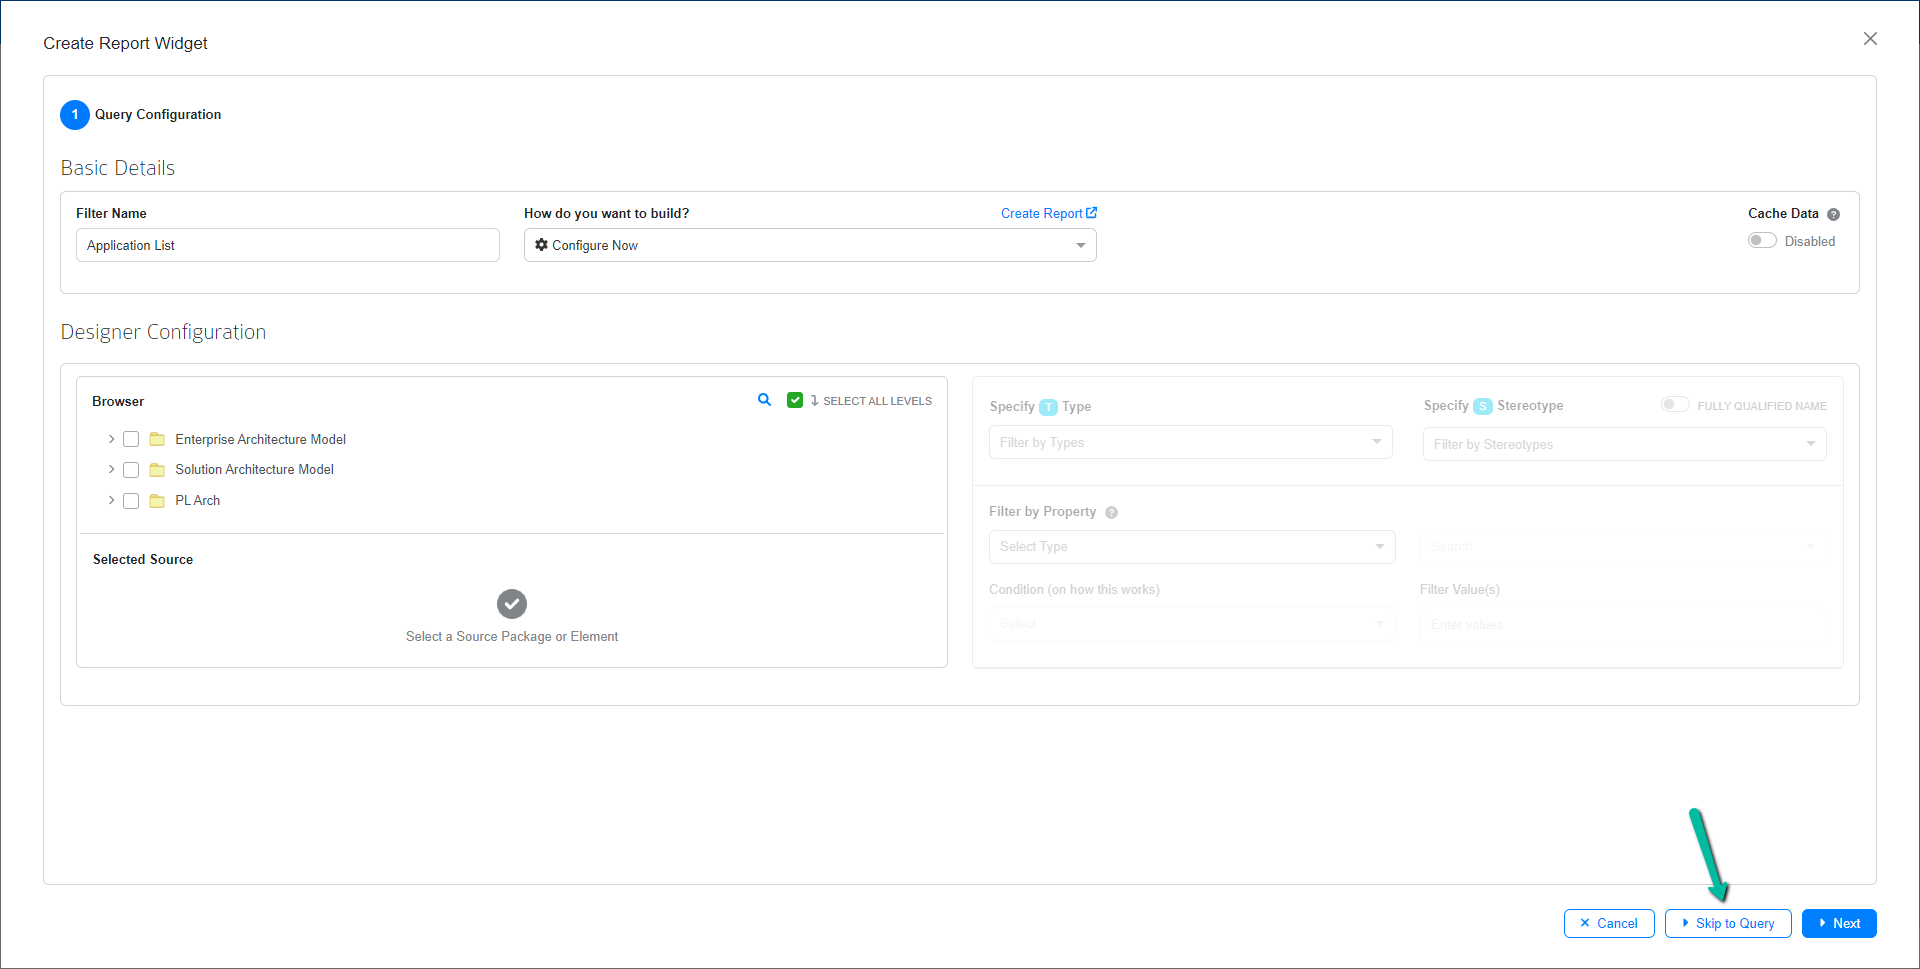
Follow the below steps to create a Report Widget using designer configuration
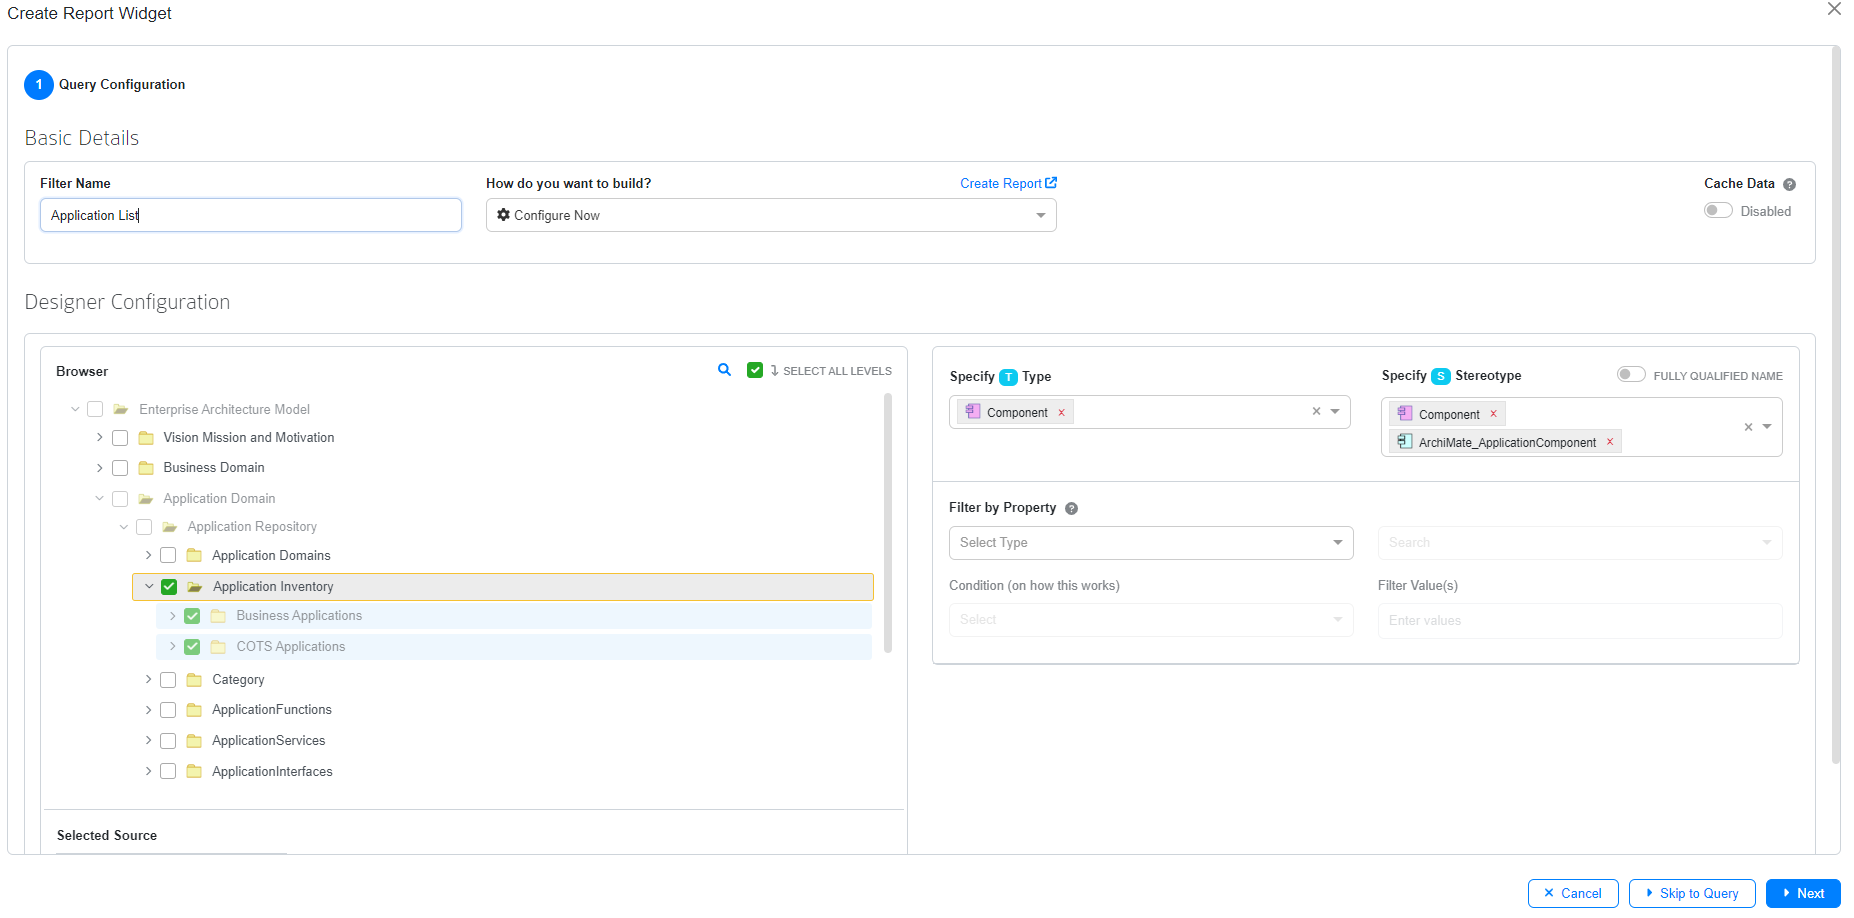
Basic Details:
Name: Enter a suitable name for the report.
How do you want to build: Users can select existing report from Report Configurations page.
Cache Data: Enable this option to improve report performance by loading data from cache. click here to know more.
Designer Configuration:
Browser: It displays the list package that the user has access to.
Search Repository: It aids in the search for packages and elements. Click on the Search icon to open the repository search page, where the user can search for elements by name or the user can choose object type, type, and stereotype from the dropdown menu.
Select All Levels: When The option, Select All Levels, is ticked, the sub packages and elements within a selected package get selected automatically.
Specify Type: From the dropdown list, choose the Object types from the package.
Specify Stereotype: Choose the stereotypes from the dropdown.
Fully Qualified Name: Enabling this option allows the user to see the complete name of the Stereotype by combining technology name and Stereotype name. If not, the user will only be able to see Stereotype name in the dropdown.
Filter By Property: Users can filter the elements based on the basic properties such as Name, Stereotype, Status, Notes, etc, and also tagged values.
After choosing all the filters, click Next.
On the query configuration page, the query is auto generated based on selection chosen from previous page. Users are freely allowed to modify the generated query by enabling Edit auto-generated query.
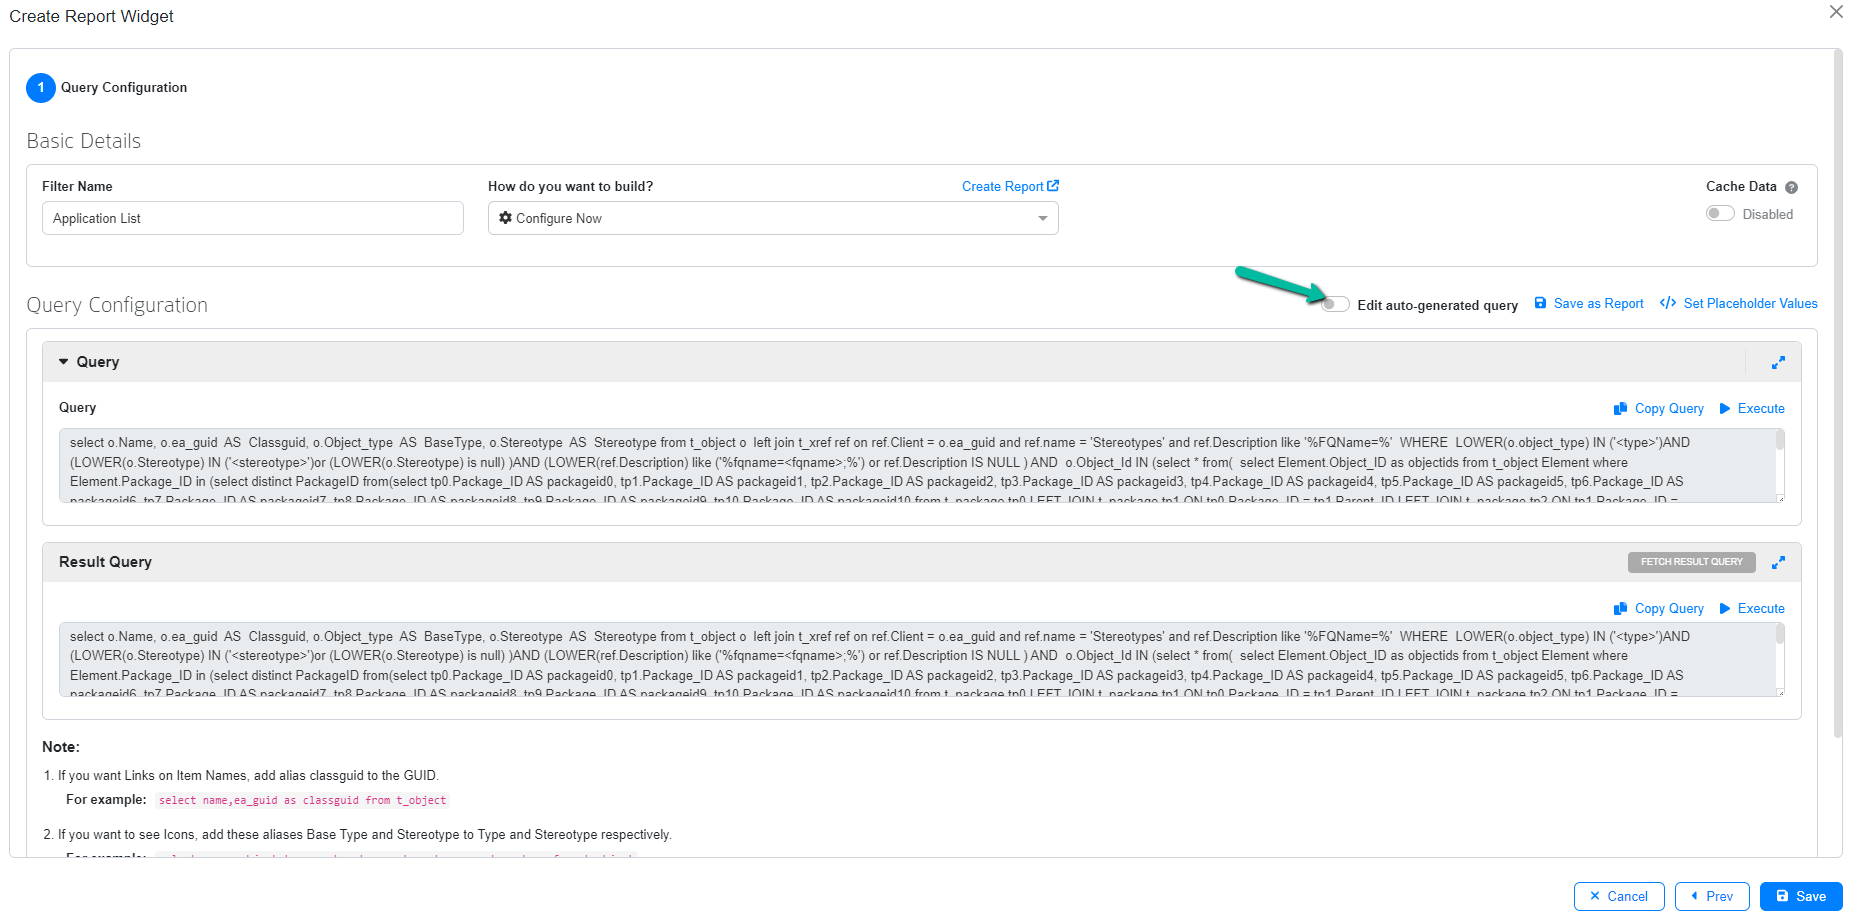
Note:
- Enabling this option will result in loss of traceability between the selected designer configuration from the previous page and the query will be lost.
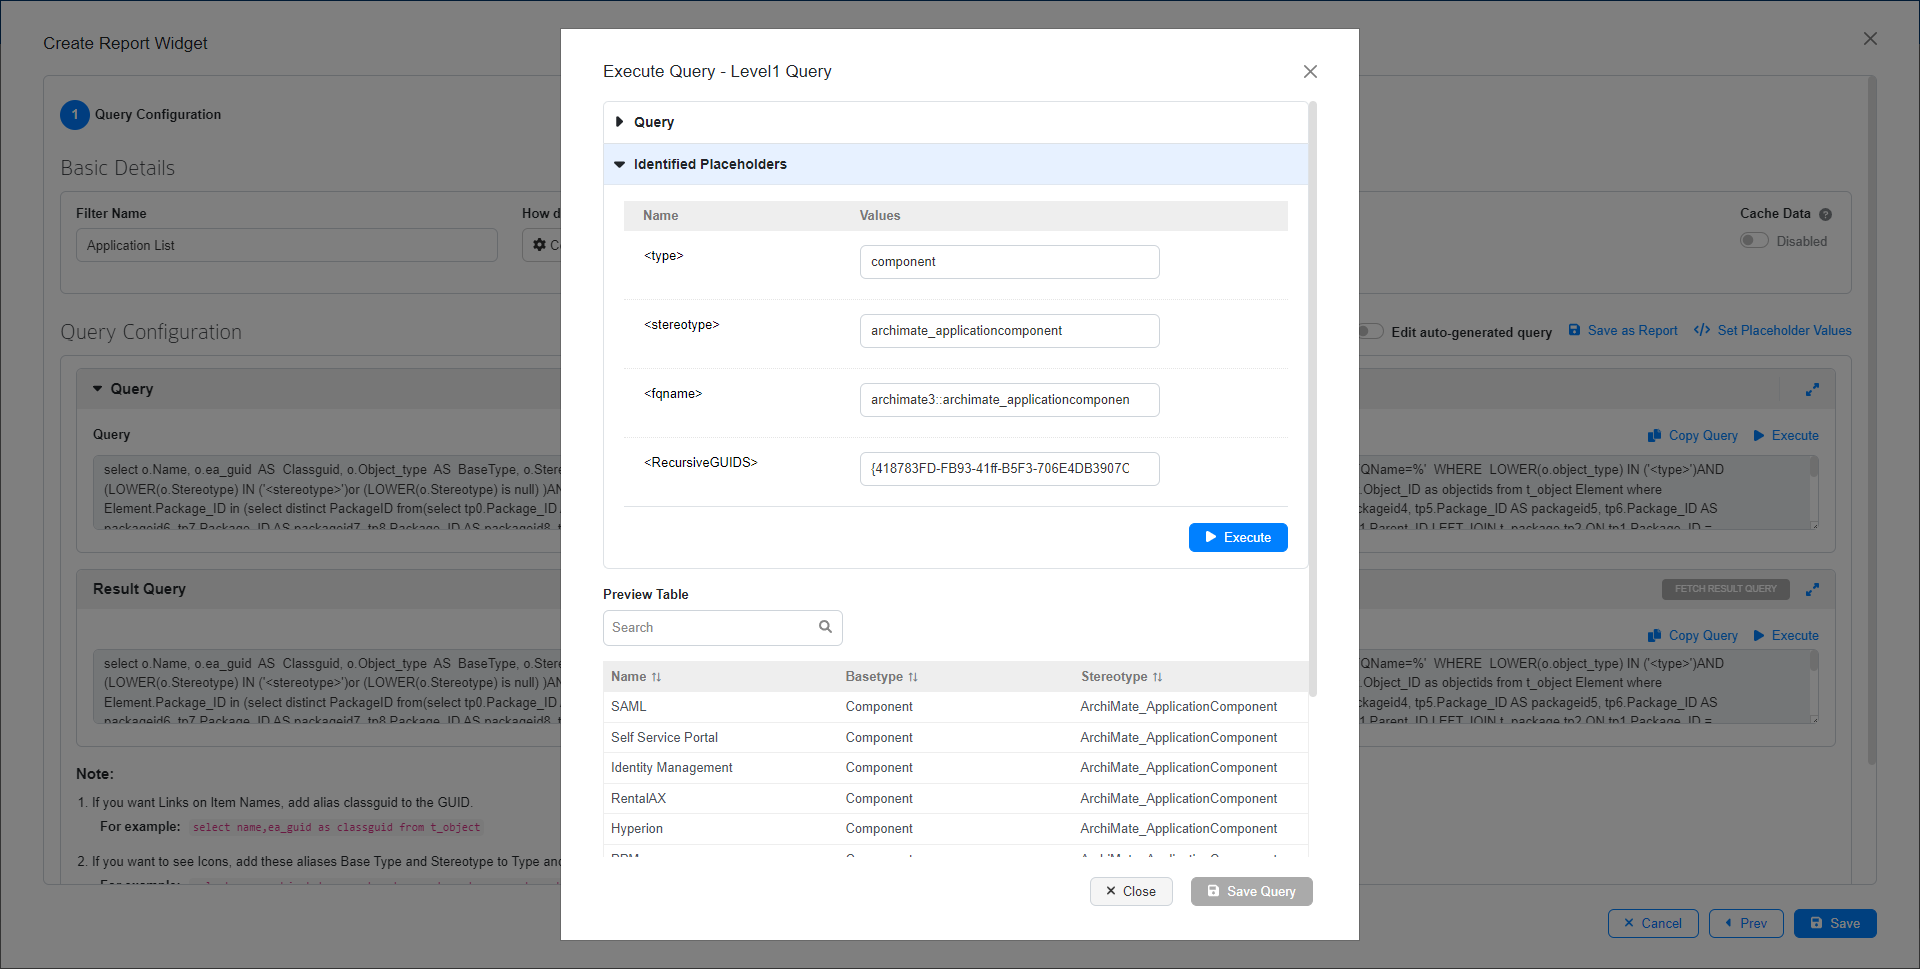
Click Execute to open the Execute Query window and preview the results. Placeholder values and query syntax can be changed to view different result outputs in this window, if required.
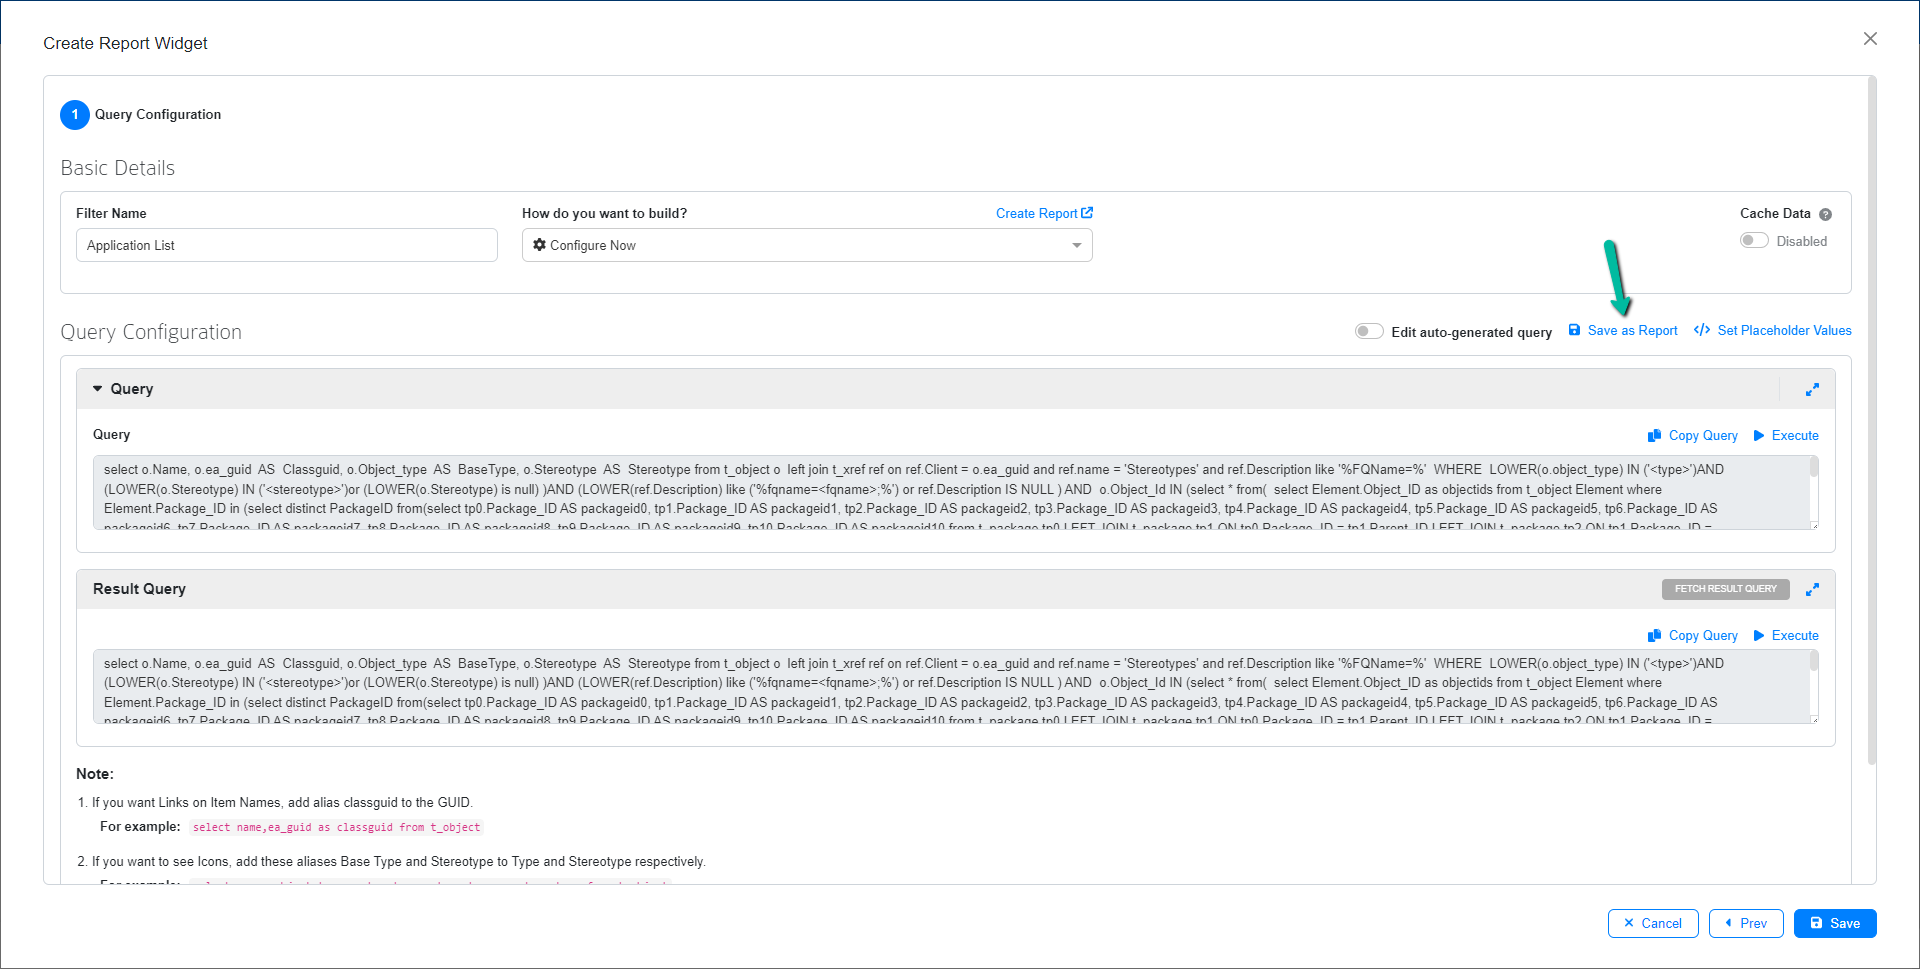
Click Save as Report to save the report as a designer type report in report configuration. The same can be reused when creating a different EA report widget.
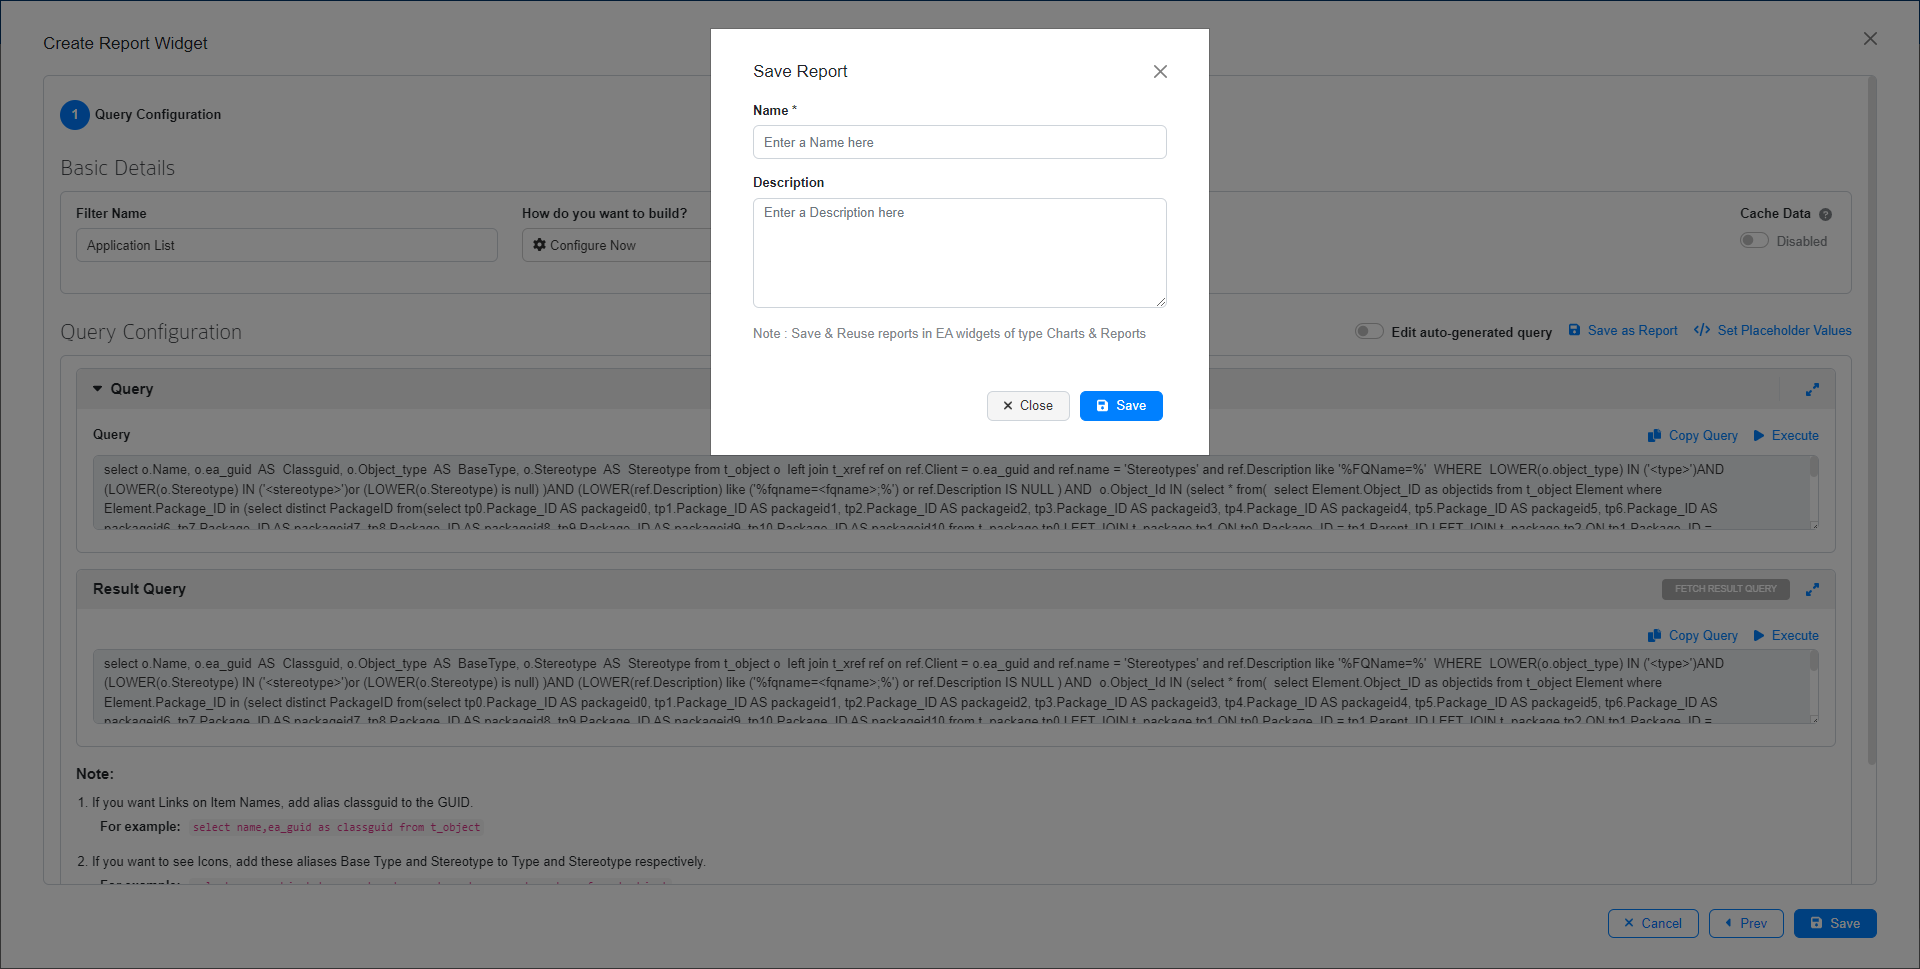
A pop up window will apppear. Enter a suitable name and give a brief description. Click Save to save the report. The saved report will be listed in the report configuration page.
Click Save to create the Report Widget. Resize the widget as required and click Save to save the dashboard.
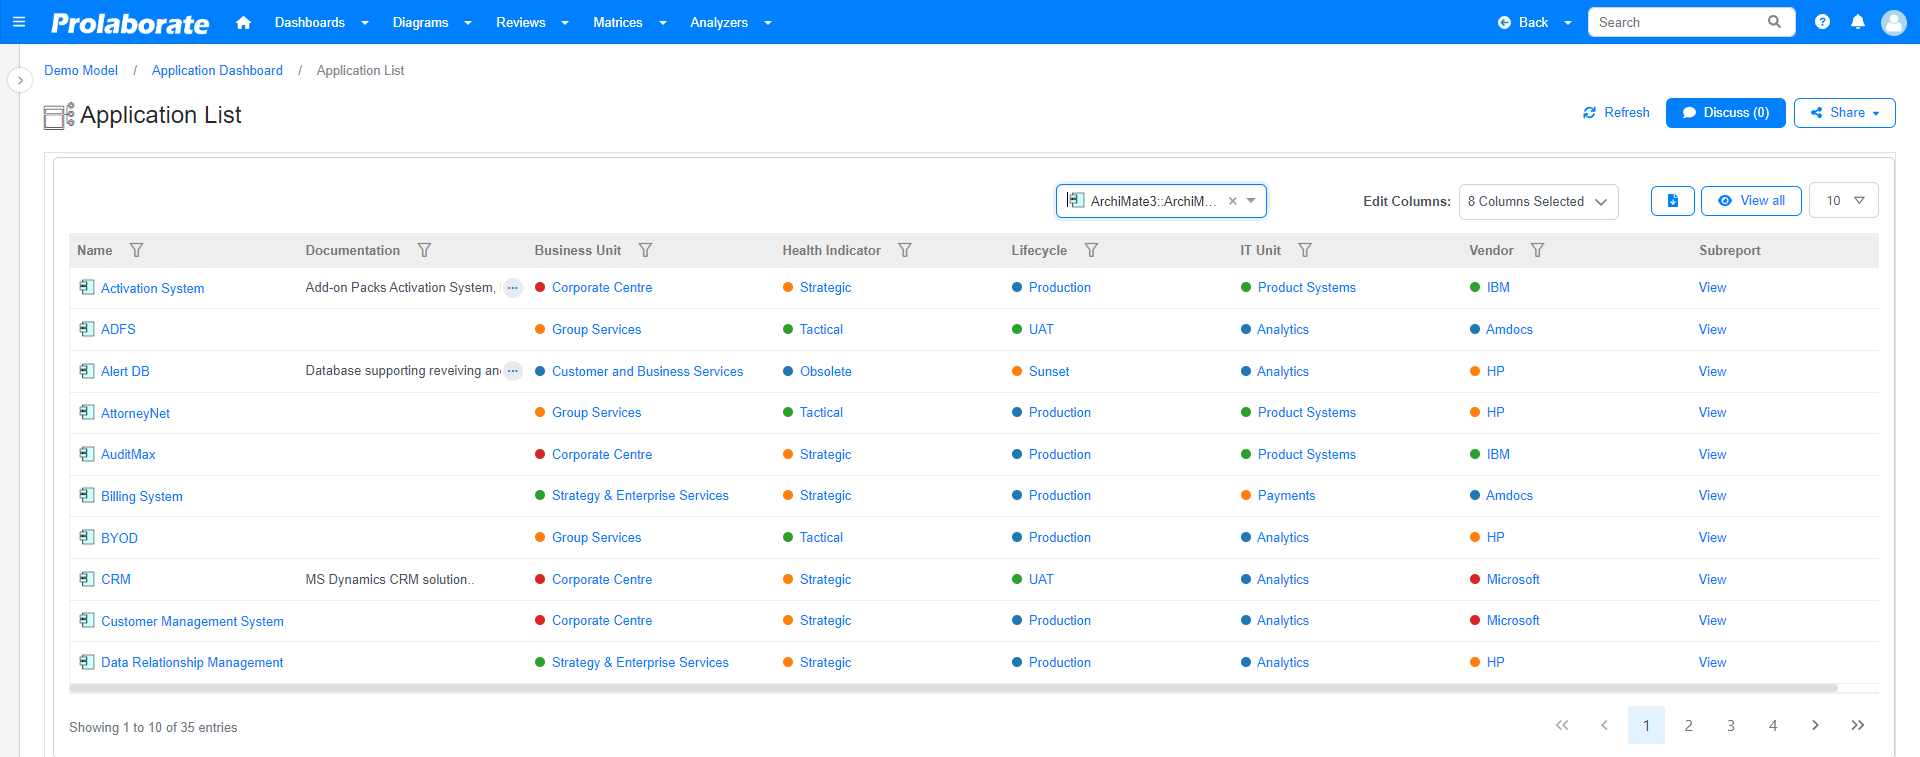
The below image shows the Report widget based on the configurations made using Designer.
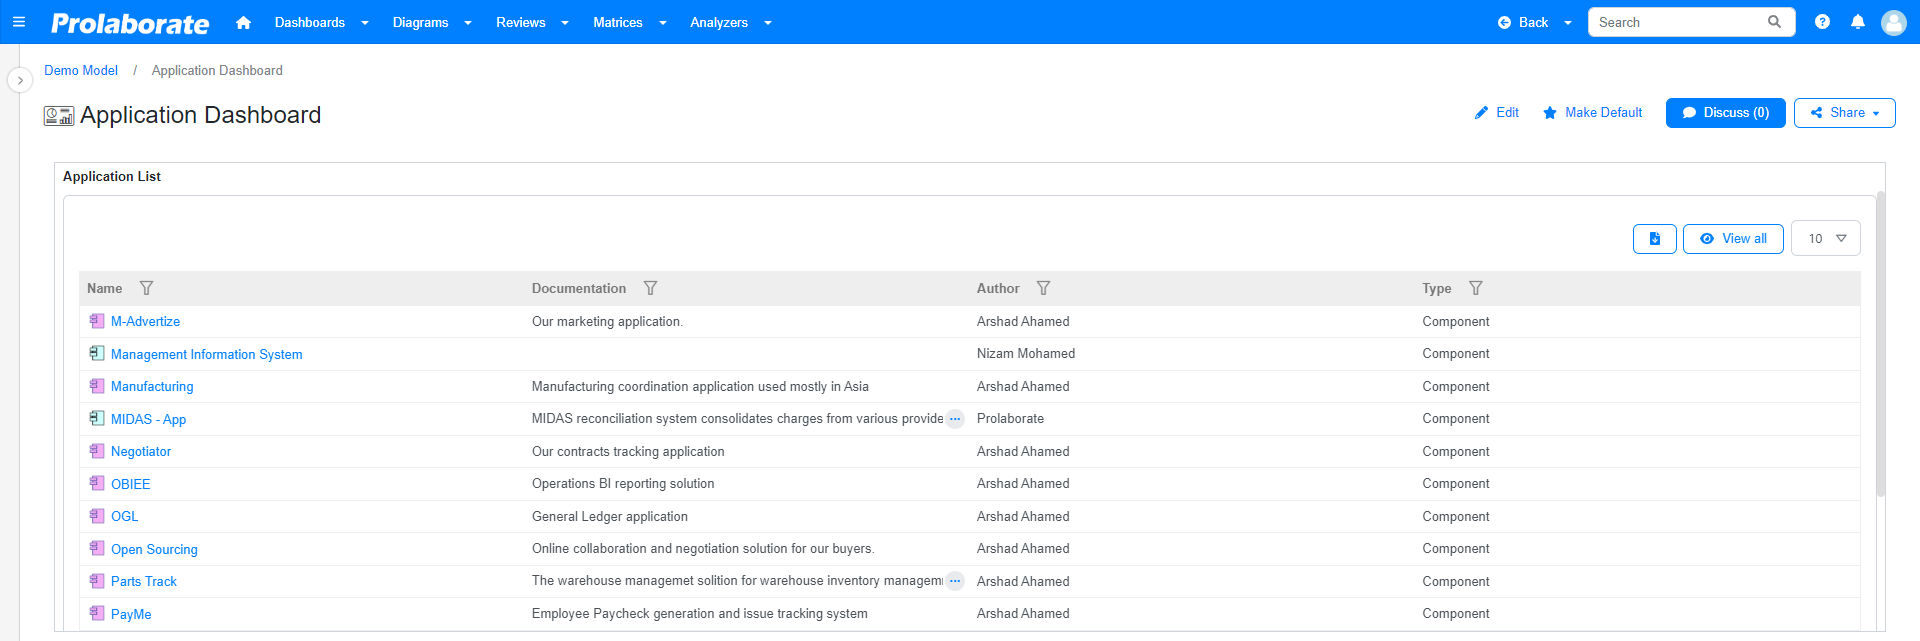
Open the widget in Maximize view or Detailed Reports view to display the stereotype and edit column dropdown option.
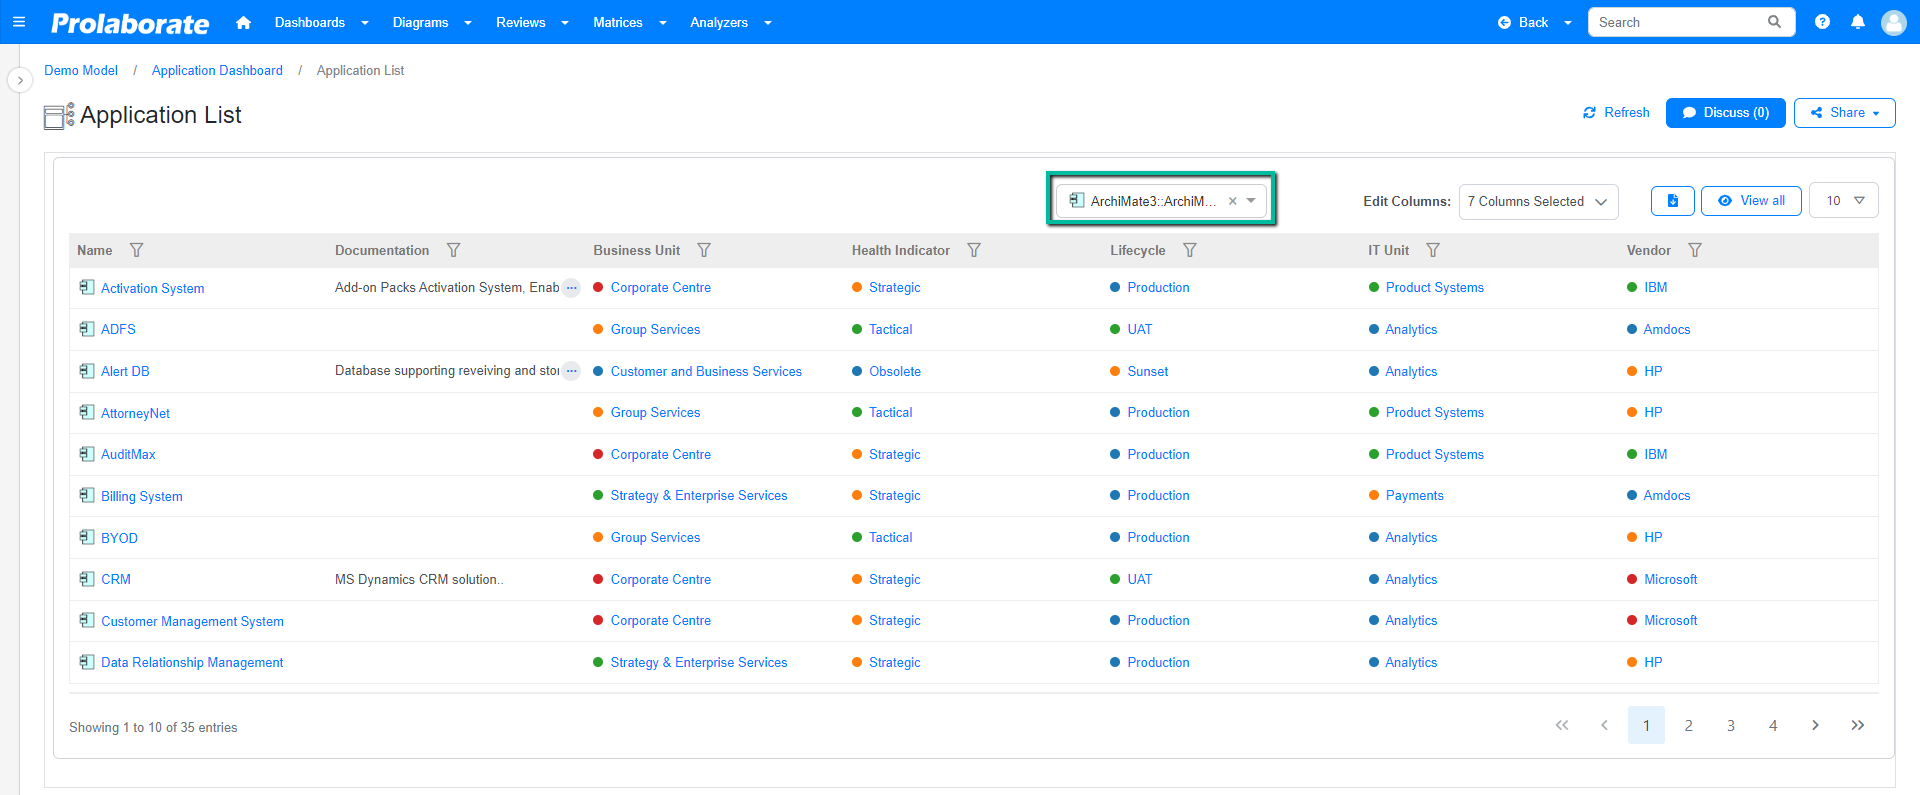
Clicking on the dropdown displays the list of stereotypes available in the report.
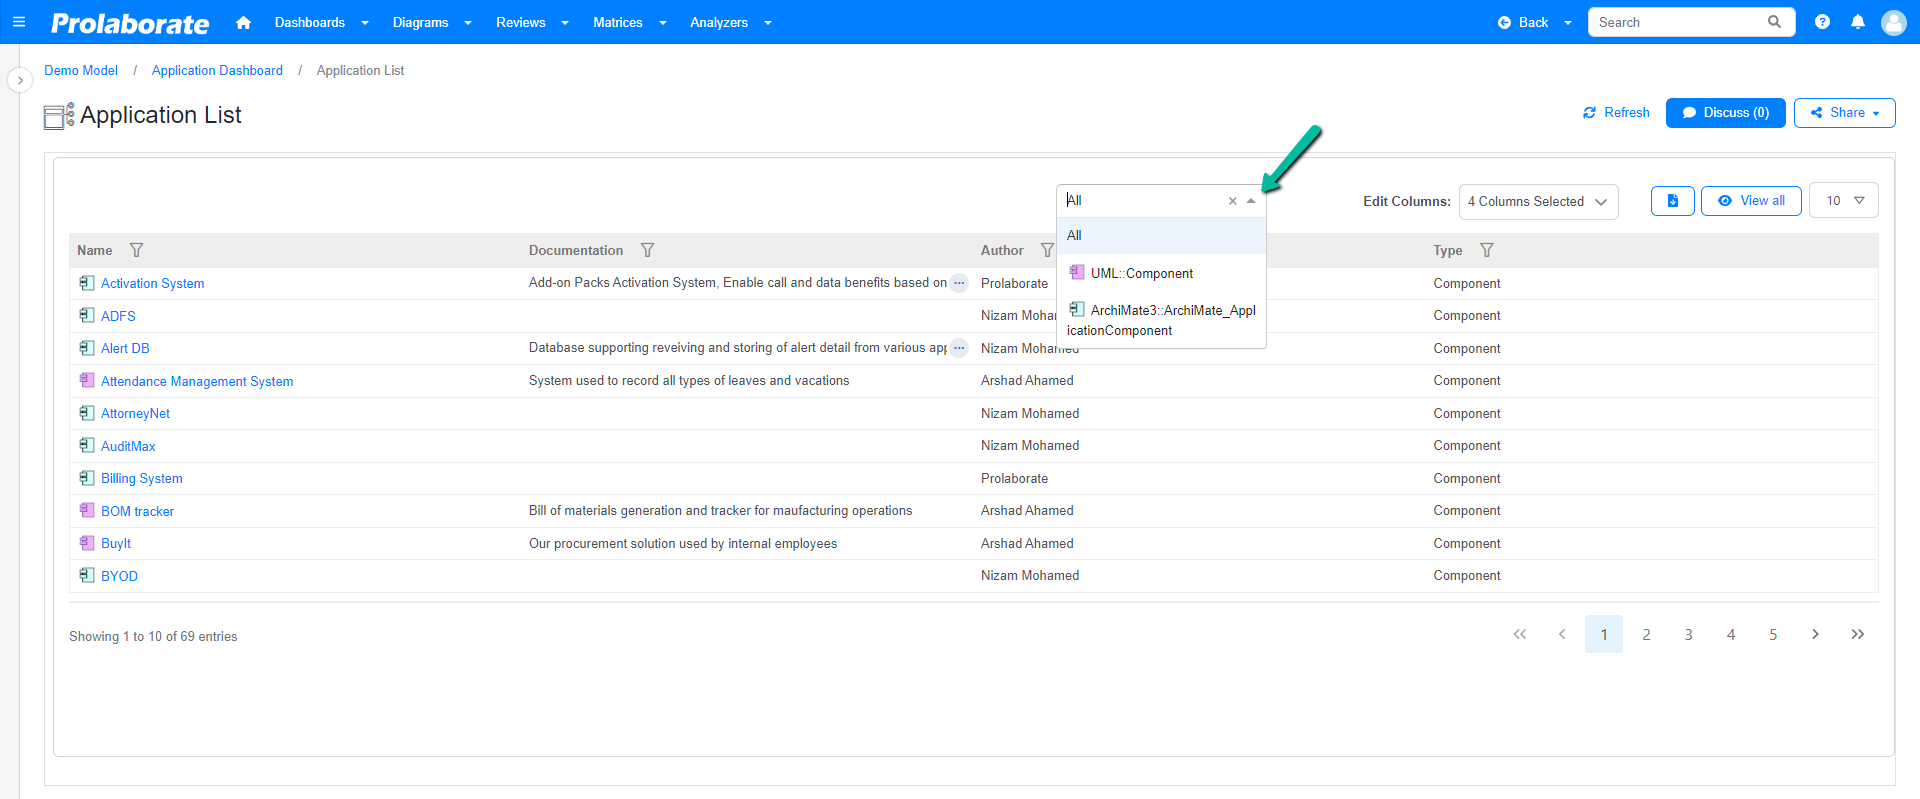
Apply filters to the report by selecting the respectiive stereotypes from the list. The columns displayed will be based on the form configured for the stereotype in the MDG profile assigned to the respective user.
To know more about other useful features in Reports, click here.
Build Report Widget using Query Configuration
Basic Details:
Name: Enter a suitable name for the report.
How do you want to build: Users can select existing report from Report Configurations page.
Cache Data: Enable this option to improve report performance by loading data from cache. click here to know more.
Click ‘Skip to Query’ to open Query Configuration page
Follow the below steps to create a Report Widget using Query Configuration (SQL Queries).
Query Configuration:
Query: Enter the query in the space provided based on requirements.
Copy Query: Click this button to copy the entire query, manual selection not required.
Execute: Click Execute to open the Execute Query window and preview the results. If ‘Placeholders’ are present, enter values for them and preview the results using the Execute option.
Subreport: By enabling this, the user can enter a Subreport name and query. A column will be displayed with the Subreport name in the widget. Click view to open the Subreport.
MDG Based Report: This option is enabled by default. Upon selecting a stereotype, it displays the columns name in the report based on the profile set as default in the Modeling Language. If disabled, the column names displayed will be based on the aliases mentioned in the query syntax.
Set Placeholder Values: Displays the list of placeholders in the query, if there is any. Enter values for the respective placeholders and save them.
Save as Report: Save the report as reused later when creating a new report. A popup window will apppear. Enter a suitable name and brief description. Click Save to save the report. The saved report will be listed in the report configuration page as type query.
Fetch Result Query: Clicking this button will fetch the result query.
Result Query: This text box will display the result query upon clicking on the Fetch Result Query and preview the results using the Execute option.
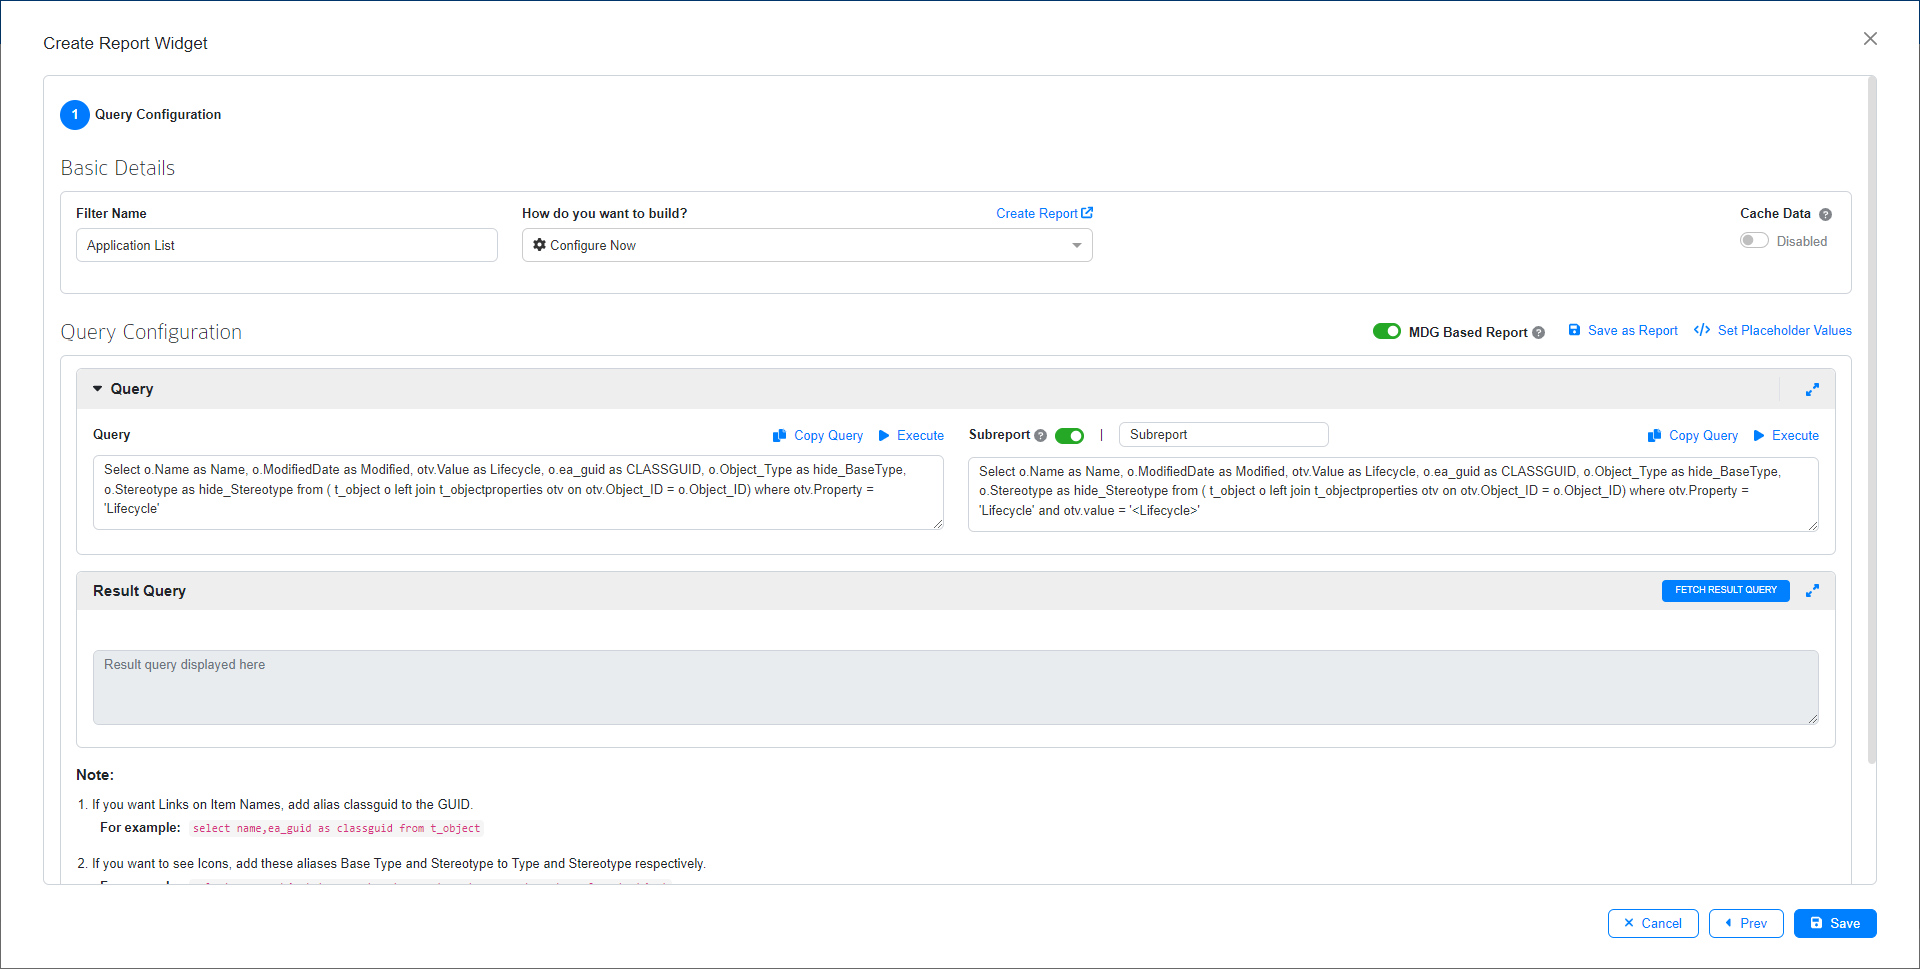
Sample Report Query:
Select o.Name as Name, o.ModifiedDate as Modified, otv.Value as Lifecycle, o.ea_guid as CLASSGUID, o.Object_Type as hide_BaseType, o.Stereotype as hide_Stereotype from ( t_object o left join t_objectproperties otv on otv.Object_ID = o.Object_ID) where otv.Property = 'Lifecycle'
Sample Subreport Query:
Select o.Name as Name, o.ModifiedDate as Modified, otv.Value as Lifecycle, o.ea_guid as CLASSGUID, o.Object_Type as hide_BaseType, o.Stereotype as hide_Stereotype from ( t_object o left join t_objectproperties otv on otv.Object_ID = o.Object_ID) where otv.Property = 'Lifecycle' and otv.value = 'Lifecycle'
Click Save to create the Report Widget. Resize the widget as required and click Save to save the dashboard.
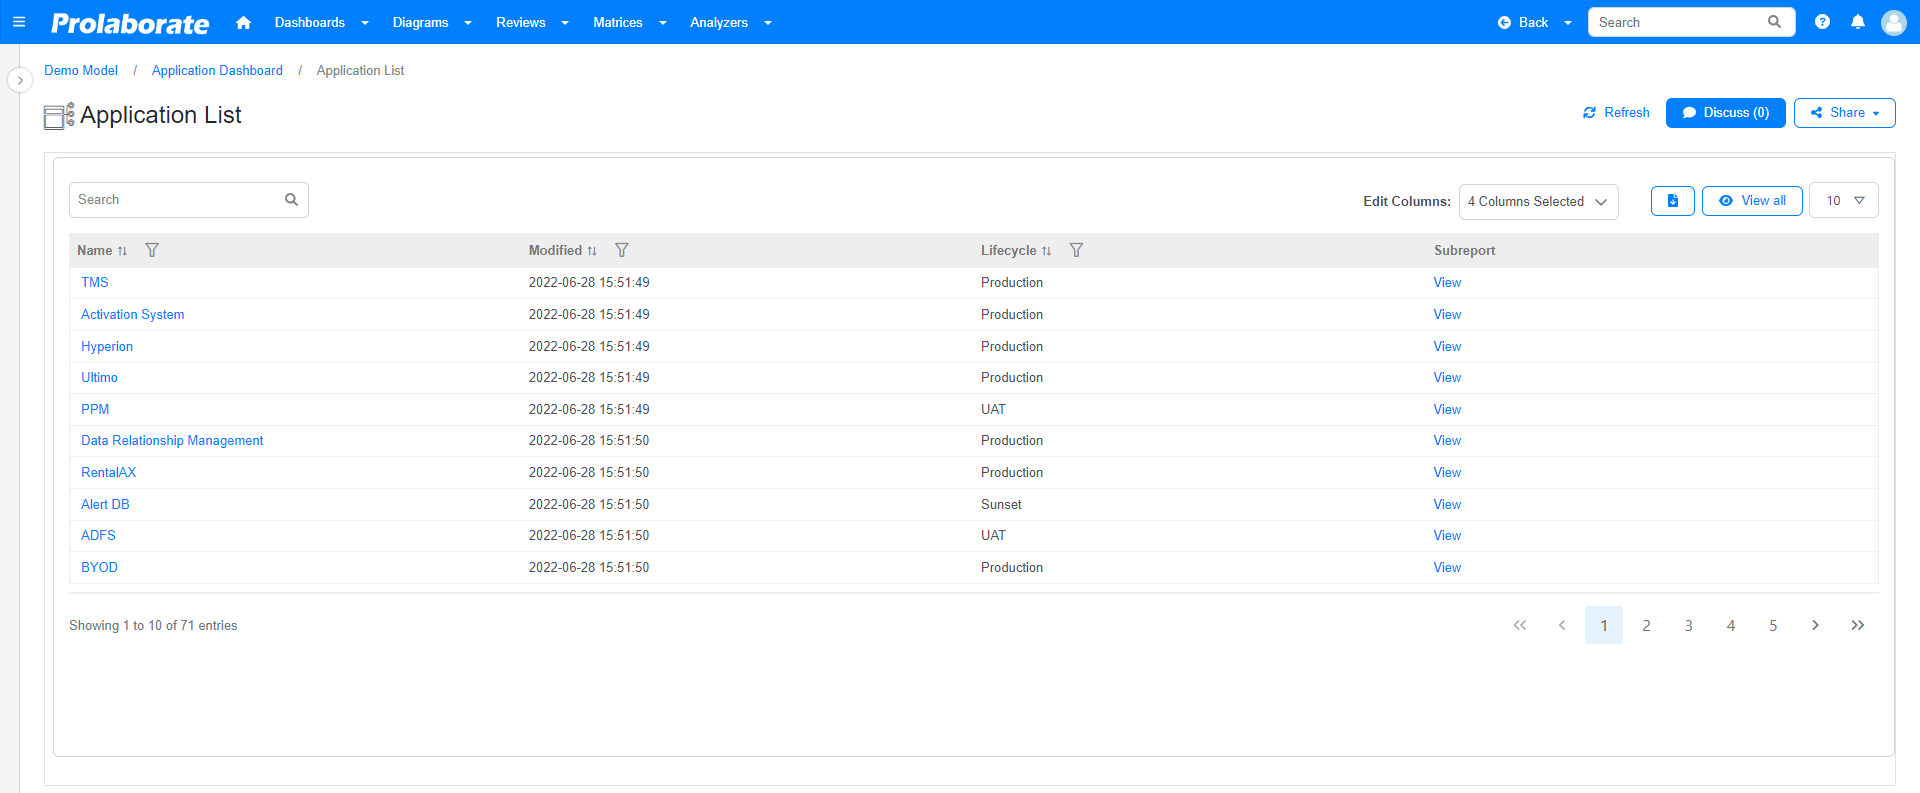
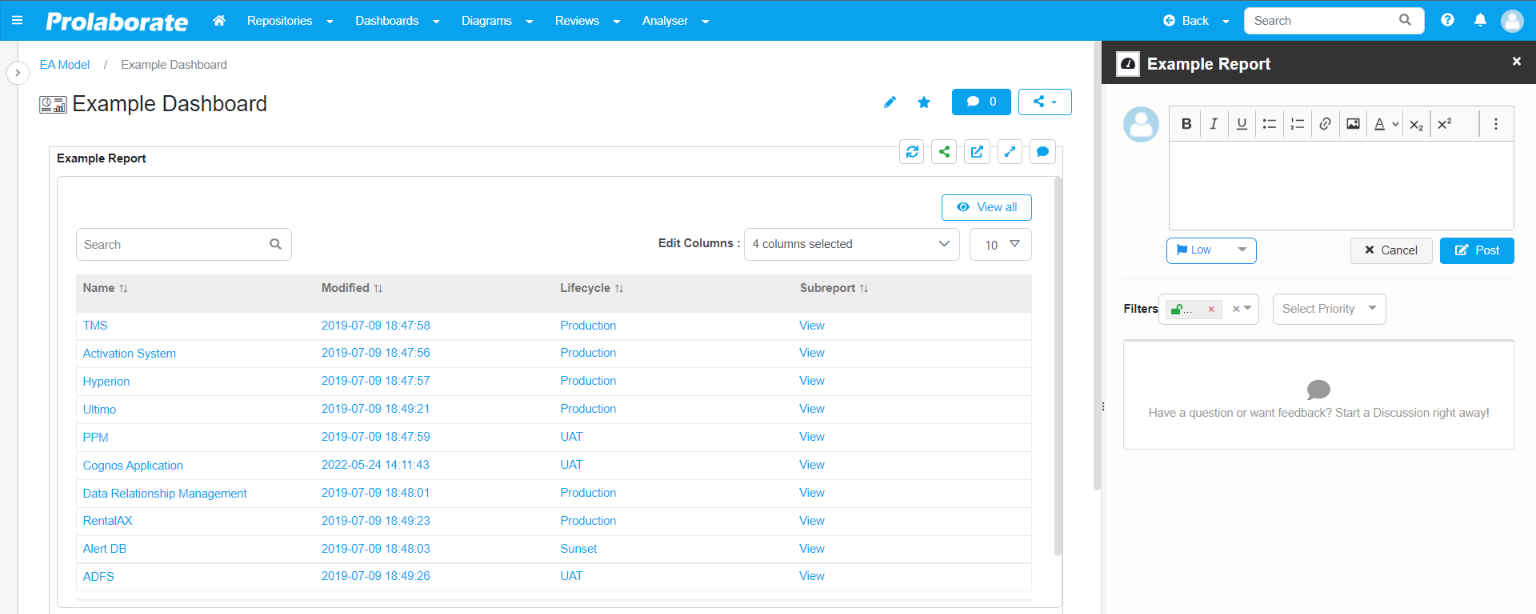
The below image shows the Report widget based on the configurations made SQL Query with MDG Based Report ON.
The below image shows the Report widget based on the configurations using the same SQL Query with MDG Based Report OFF.
A new column with the name of Subreport will appear in the configured report widget. Click View to open the configured subreport.
The subreport will be rendered at the bottom of the page based on the query entered while creating the widget.
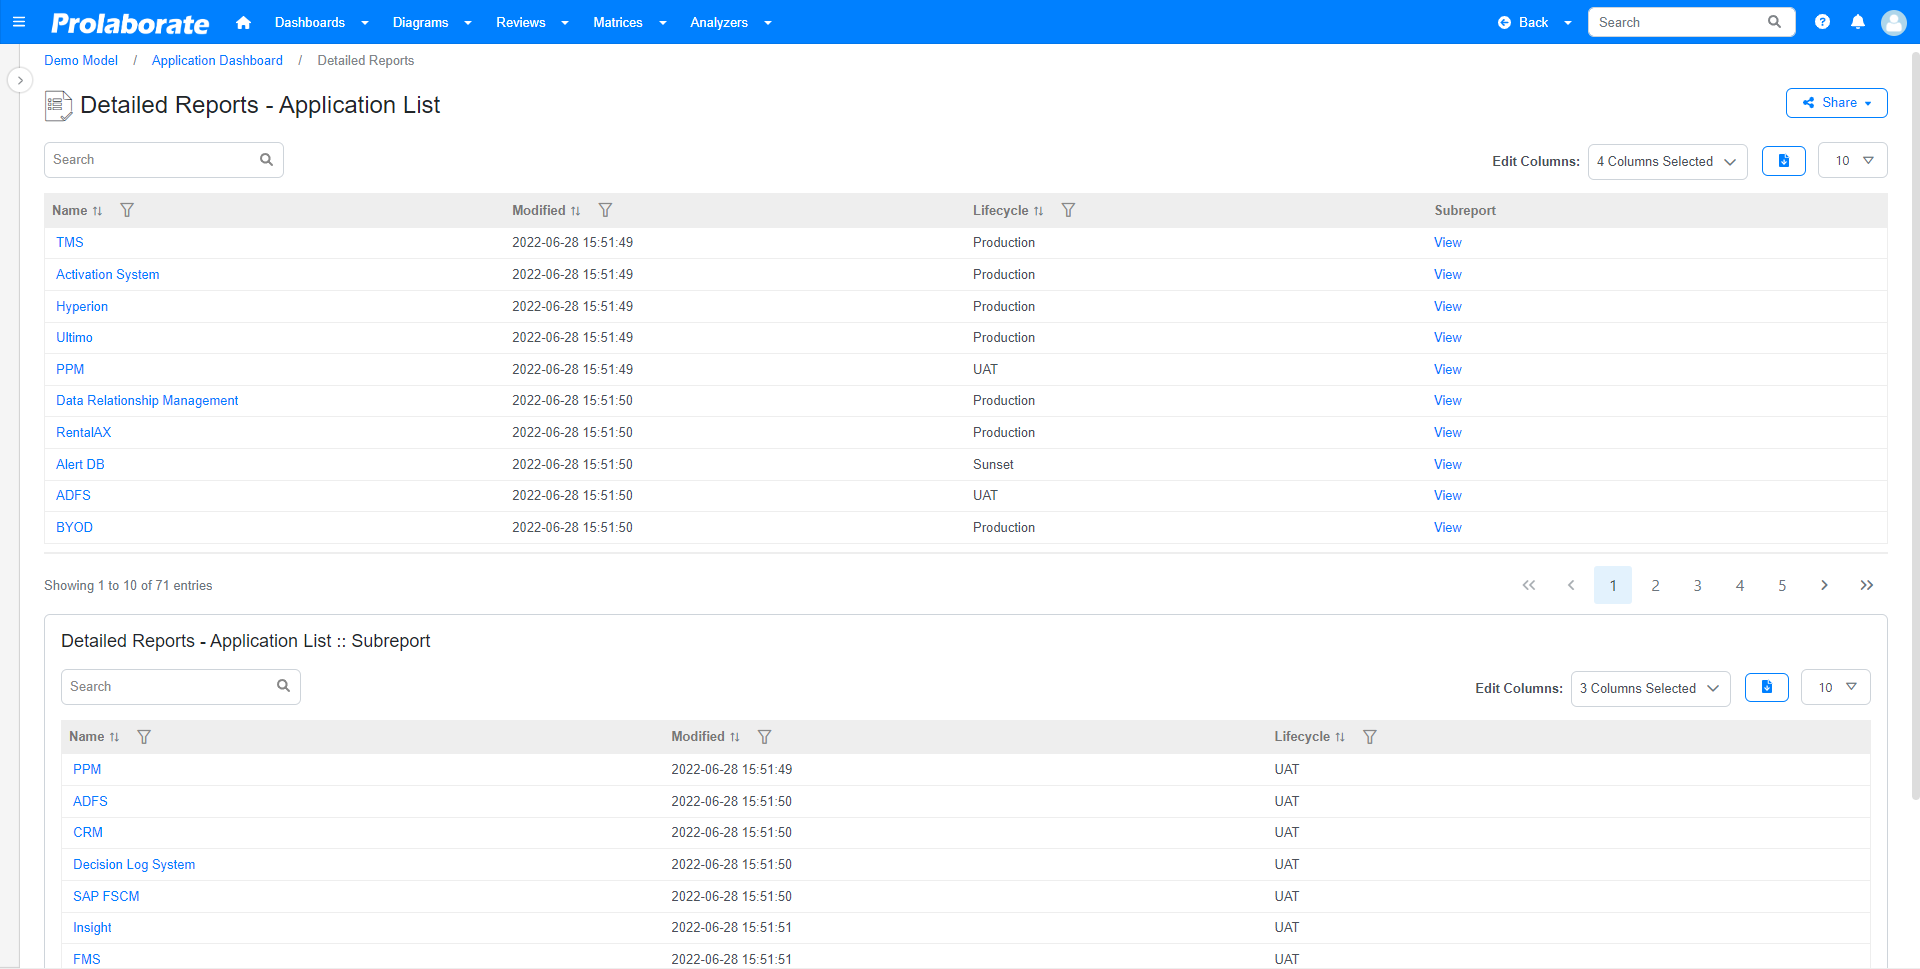
Scroll up to navigate back to the detailed report.
Click on the Artifact Name to open the properties window. Multiple columns can be made clickable in the table view by adding the prefix ‘clicable_’ followed by the column name in the query.
Example Query:
select o.Name as Name, o.ModifiedDate as clickable_Modified, otv.Value as clickable_Lifecycle, o.ea_guid as classguid, o.Object_Type as Basetype, o.Stereotype as Stereotype from ( t_object o left join t_objectproperties otv on otv.Object_ID = o.Object_ID) where otv.Property = 'Lifecycle'
To know more about other useful features in Reports, click here.
Manage Report Widget
Edit Widget
Click Edit to open the dashboard in edit mode.
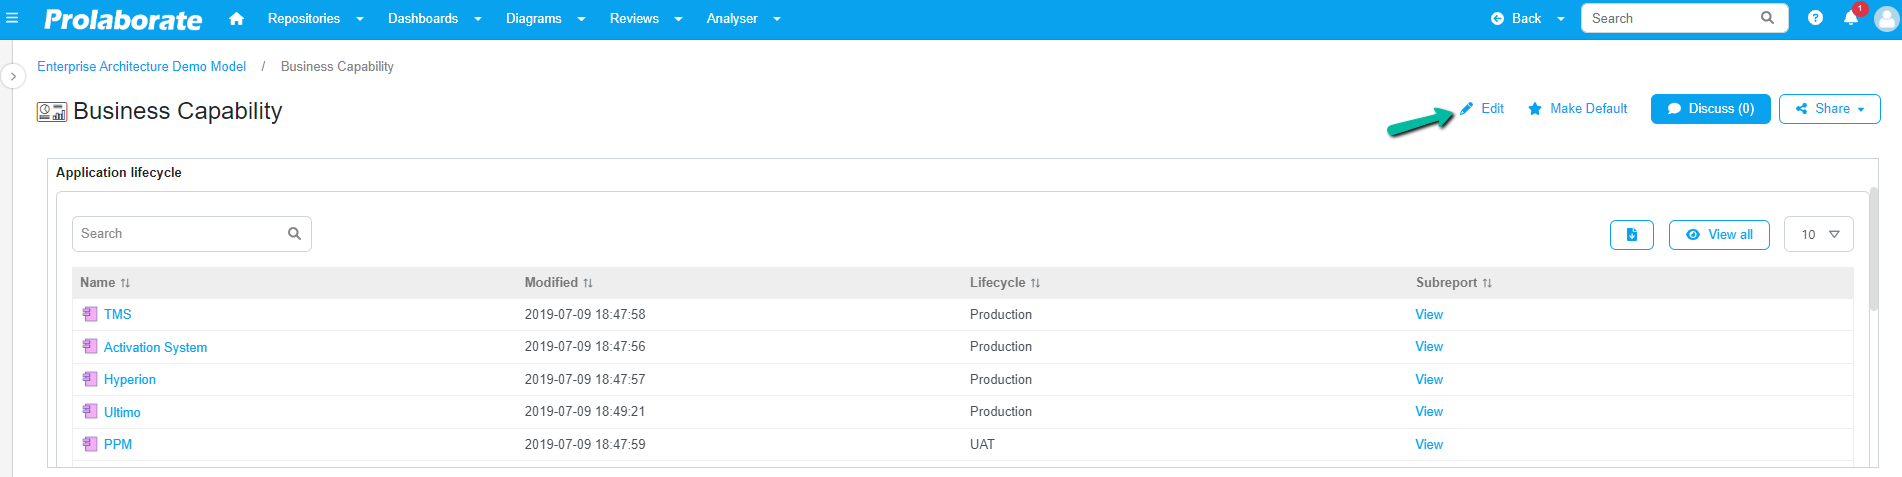
Click Configure icon to open the widget.
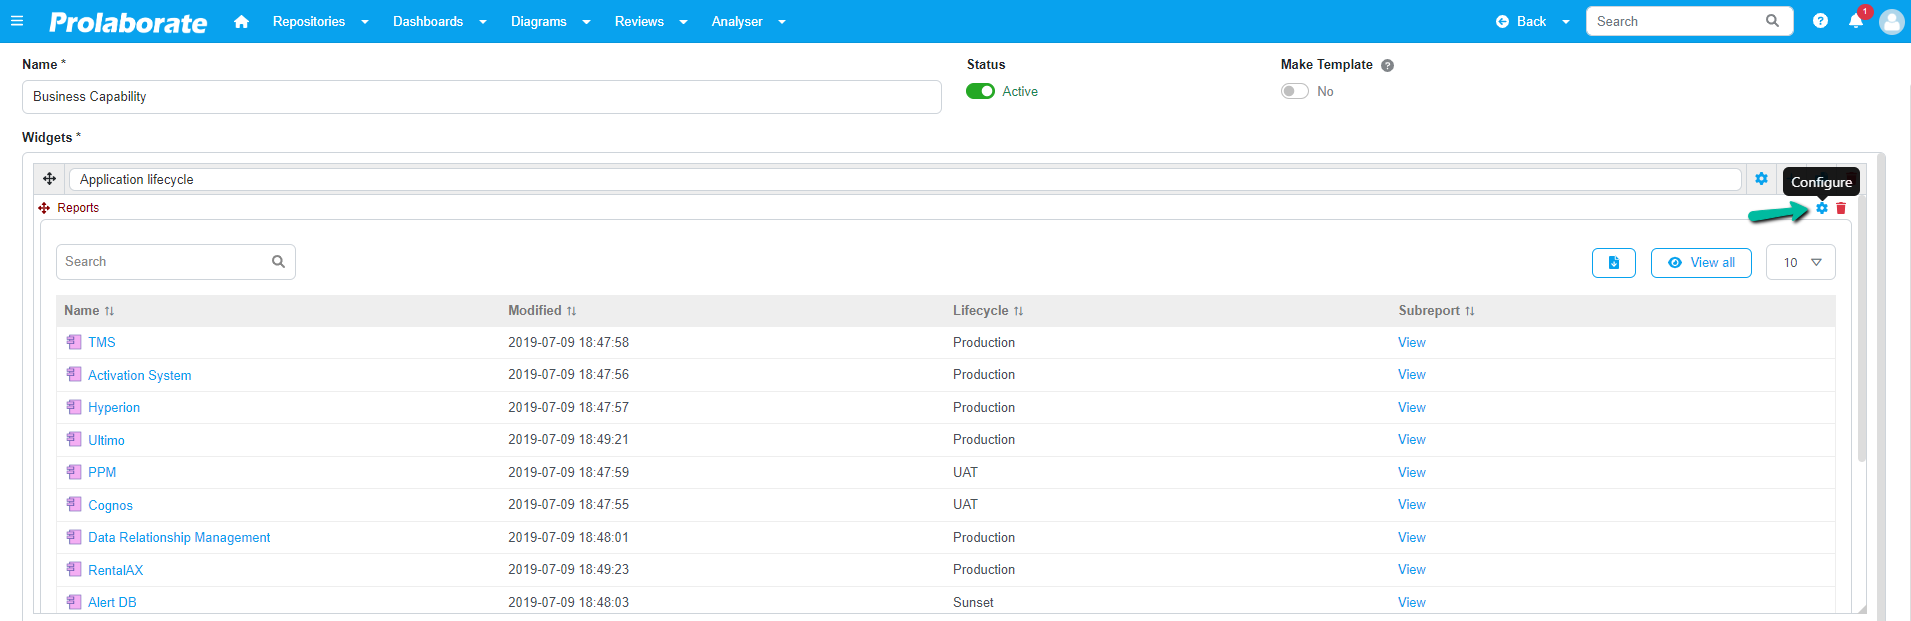
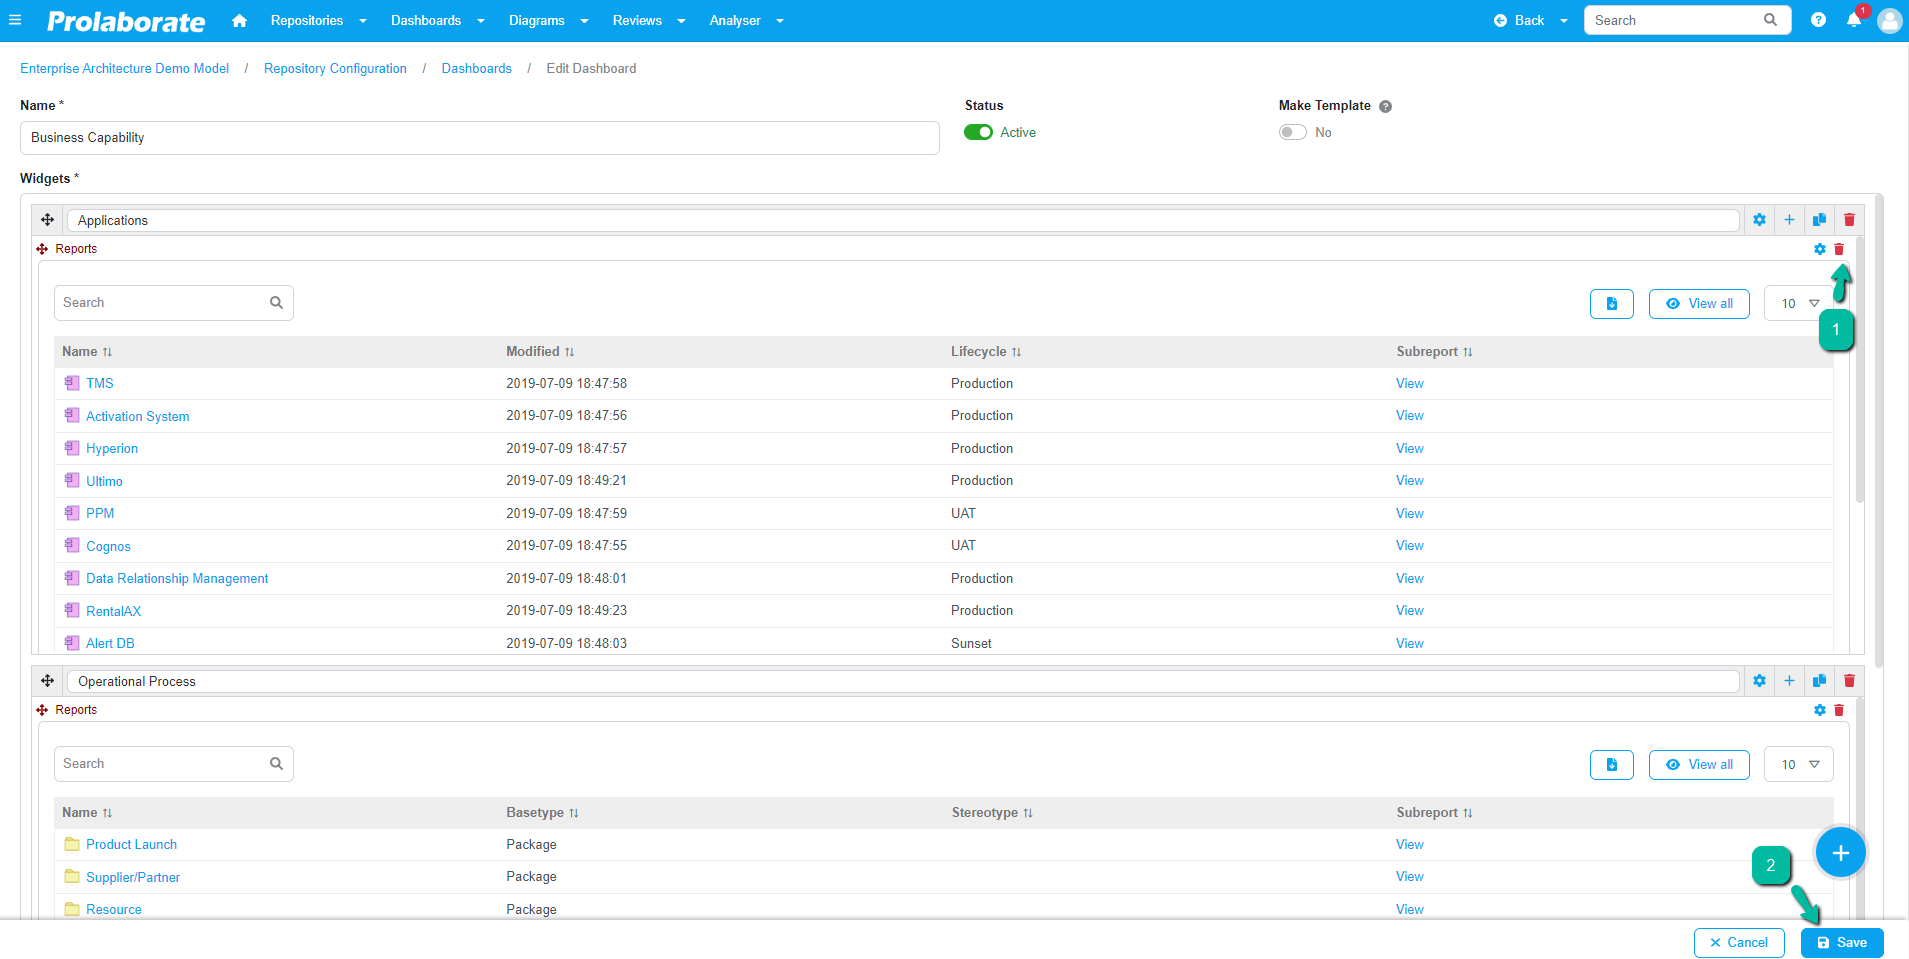
Make changes to the widget as required and click Save to save the changes.
Delete Widget
Click Delete icon to delete the widget from the dashboard and then click Save to save the changes.
Share Report
Report can be shared as a Public, Private or Embed URL link in three ways,
- Hover on the widget to display the icons. Click Share icon to share the report along with the widget.
- Hover on the widget to display the icons. Click View icon to open the report in a separate page. Click Share option to view the URLs to share.
- Click View All option in the report to open the detailed report page. Click Share option to view the URLs to share.
To know more about Share Settings, click here.
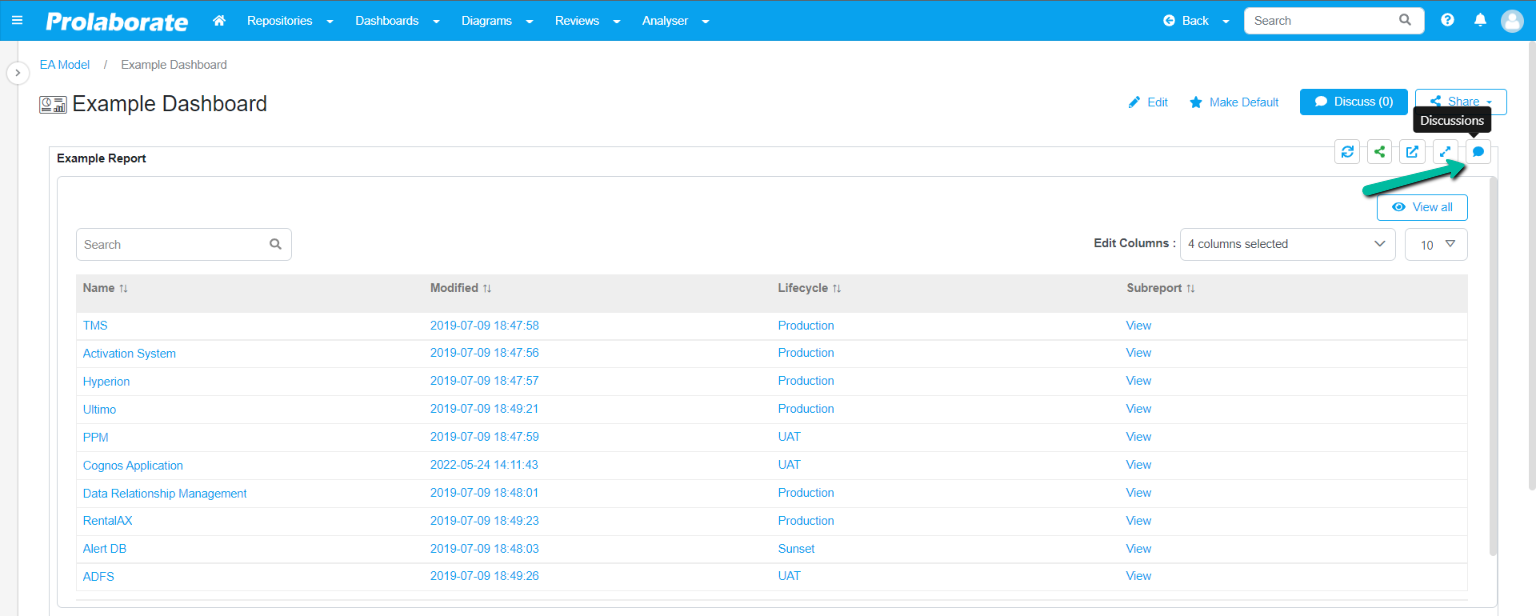
Discussions on Widget
Click Discuss icon to open the discussions tab for the widget.
Tag users, set priority, etc for the comments entered in the discussion tab.
Download Reports via Excel
Click Download icon to download the Report from dashboard. click here to know more.
Refer the article Recently Modified Diagram via EA Report Widget to understand the usage of EA Report Widget for simple use case.