
Review Recently Modified Diagram in Prolaborate
Context
In Prolaborate, users such as reviewers can review diagrams that have been modified recently by their teams via Reports Widget.
Reports Widget is a reporting functionality of Prolaborate. Using this widget, users can fetch data from the model and display them in a table format. The Reports widget can be added to the dashboard for ease of access.
Though the Reports widget can be used in various scenarios, this article will focus on how the recently modified diagrams are reported and how users can view those diagrams by clicking on the name of the diagram on the report.
Create a Report for Reuse
Users can write a query and save it as a Report. They can then represent the same result in a different format by reusing the same report on different types of charts & reports.
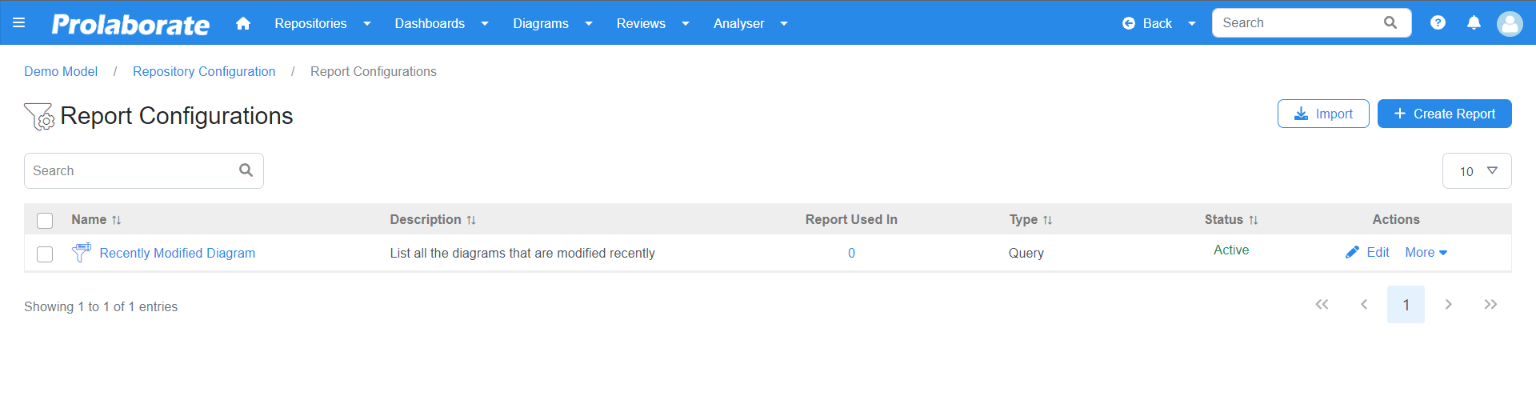
To create a profile, click on Menu > Report Configuration.
On the Report Configuration page click on Create Report.
Click Skip to Query to navigate to the query section. Enter the query and Save the Report.


Enable ‘Diagram name’ clickable
The clickable attribute allows the user to view the Properties of a specific attribute, from Properties window upon clicking on the attribute name. Through the Properties window, users can locate the diagram on the repository browser and more.
To enable Name attribute as Clickable attribute, add “ea_guid as classguid” in the query.
Query if you are using the MSSQL server
select top 10 name, ea_guid as classguid, 'Diagram' as type, ModifiedDate from t_diagram where ModifiedDate >= DATEADD(day,-7, GETDATE()) order by ModifiedDate desc
select top 10 name as clickable_DiagramName, ea_guid as classguid, 'Diagram' as type, ModifiedDate from t_diagram where ModifiedDate >= DATEADD(day,-7, GETDATE()) order by ModifiedDate desc
Query for MySQL server
select name, ea_guid as classguid, 'Diagram' as type, ModifiedDate from t_diagram where ModifiedDate BETWEEN CURDATE() - INTERVAL 7 DAY AND CURDATE() order by ModifiedDate desc limit 0, 10
The above query generates reports capturing the top 10 diagrams that have been modified, updated or newly added in the last 7 days. To increase the time, change the day count “7 Day” in MySQL server and “day-7” in MSSQL.
Apply Report on a Reports Widget
Apply the report to a widget to display the result.
Add Reports Widget
To add a Reports widget to a new dashboard, click on Create Dashboard > Create New on the Dashboards page
To add an EA widget to an existing dashboard, click on the Edit icon in the dashboard
Click on Add Widget Button > Add New
Choose Reports and click on Add Widget on the landing page
Choose a Report or Write a Query
To apply a report to a Reports Widget, click on Choose Report from the dropdown under How do you want to build.
The landing page will display all the existing Reports i.e., those that have already been created. Choose the report to be reused in the Reports Widget.
Note:
- Instead of choosing Choose Report Profile (existing report), user can choose Configure Now and enter the query instantly.
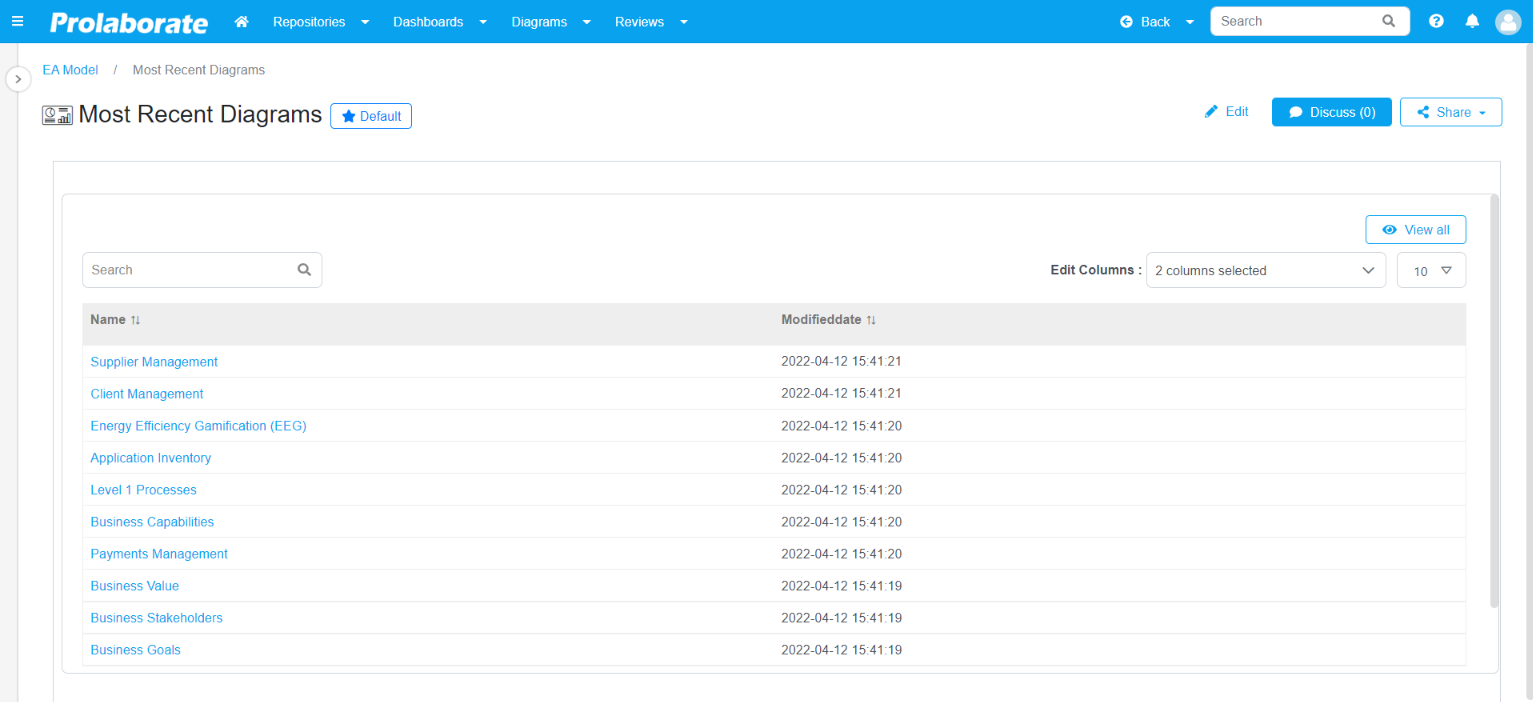
View the recently modified diagrams
Please find below the dashboard screenshot showing the recently modified diagrams report.
Navigate to Diagrams from Reports
Upon clicking the name of the diagram in the report, user will be able to open the diagram. Click to view the diagram on the overview page and to locate the diagram in the repository browser.
To open the diagram page directly, add the syntax ‘Diagram’ as type in your query,
For example,
select name, ea_guid as classguid, 'Diagram' as type, diagram_type as basetype, stereotype as stereotype from t_diagram
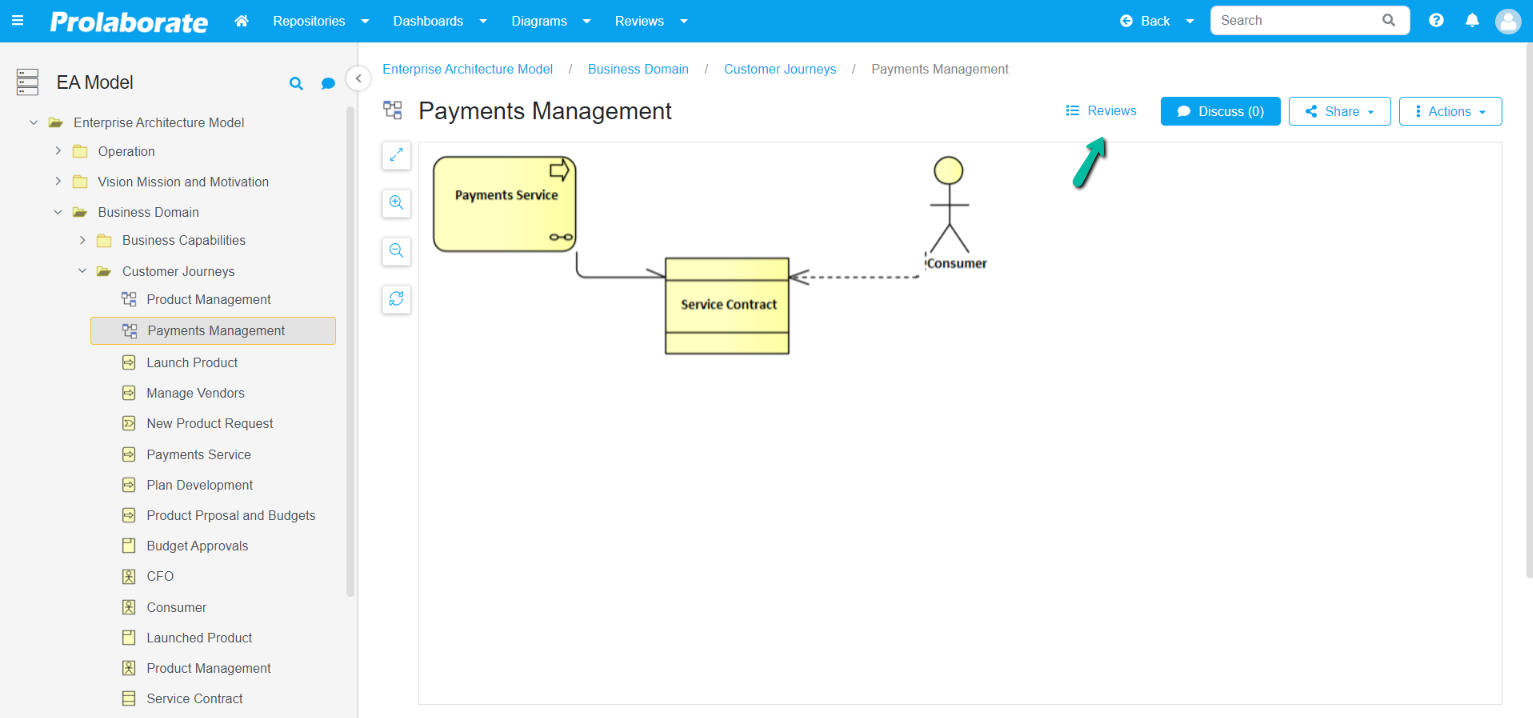
View Diagram on Overview Page
When viewing the diagram on the Overview page, the user can perform multiple functions such as creating a discussion on the diagram or sharing the diagram or inviting a collaborator to collaborate on a diagram. The overview page also gives holistic information about the diagram such as on the existing Review and Discussions, if any.