
Application Portfolio Rationalization (APR)
You can’t manage what you can’t see! You can’t innovate what you can’t manage!
The goal of this blog post is to guide you in rationalizing and managing the application portfolio as per the best practices using the Sparx Systems suite of products.
The context we have considered is that you are an existing user of Sparx Enterprise Architect or the complete Sparx Systems suite of products (Enterprise Architect, Pro Cloud Server, and Prolaborate) who has some information maintained about some or most of the applications.
Now, you are trying to rationalize and manage the portfolio but the efforts are in vain as the whole experience is not smooth and requires a lot of repeated manual efforts. As the process is not very smooth, you are not getting enough support from the teams.
What is APR?
A rationalized application landscape helps organizations keep up with the emergind business needs, drive competitive advantage, and deliver superior service.
Outline Objectives and Scope
Let’s get started!
For the rationalization project to be successful, It is imperative to have a clear objective with a defined scope. It is not a good practice to just start collecting data once in a while without planning how to use it!


For example, the objective can be to identify cost reduction opportunities in ways of consolidation, cloud migration, license optimization, etc., And the scope can be just the applications used in a specific business unit or all the apps used in a specific location.
We are suggesting the scope be limited as a larger scope will require a larger audience to be involved and we know what happens when you start waiting for too many inputs from too many stakeholders.
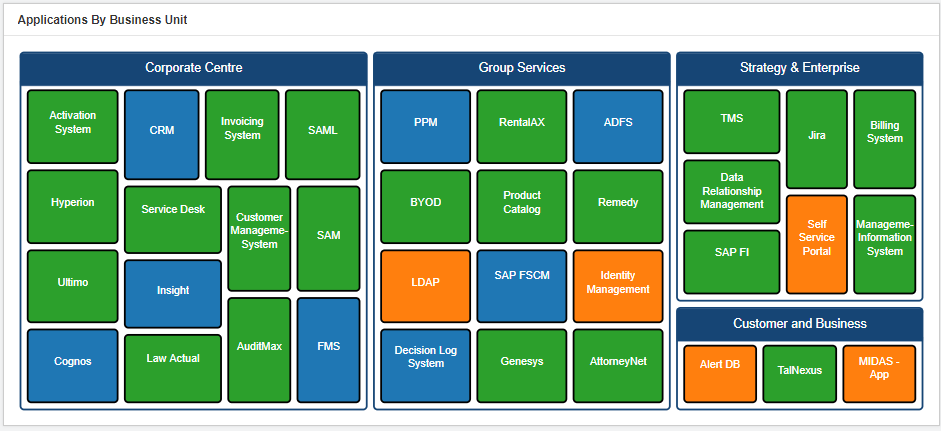
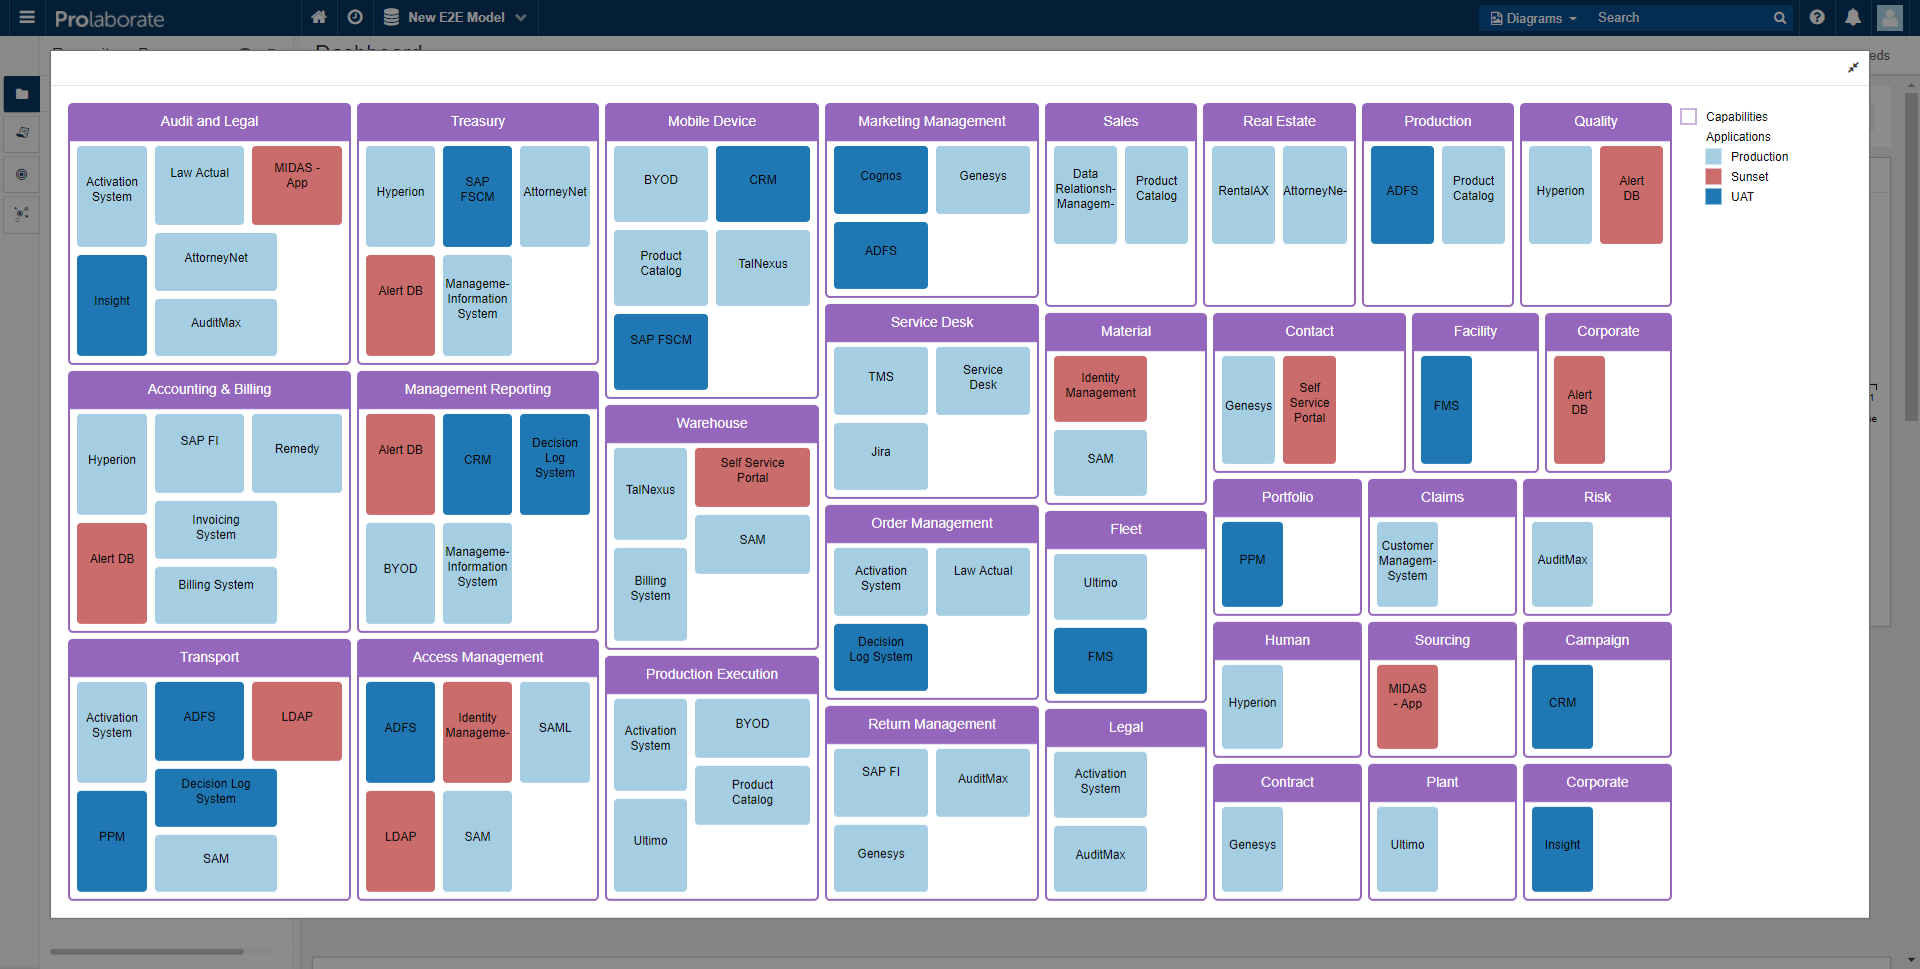
Scoping using Prolaborate
If you have the required data for scoping already in your Enterprise Architect models, you can use Prolaborate to identify the apps that need to be considered in the rationalization process.
Here, we have grouped the applications based on their Business Unit. Say, you can just consider the applications belonging to Corporate Centre and Group Services business units as the scope.
Build Inventory
Define Rationalization Model
Once you have identified what you want to achieve and where you want to start, the next step is to create a rationalization model i.e., finalize the details of the application that need to be collected.
It would be better to Involve Business and IT leaders while designing the rationalization model to start on the right foot and to get the right support.
While the rationalization model can be as elaborate as possible, it would be better to start simple. For example, here are the common attributes used in the model:
- Business Value rating
- Technical Health rating
- The total cost of ownership
- Lifecycle
- Business Unit
- Vendor
- Go Live and Sunset or EOL date
- Data Classification
While the above information can be just captured as individual tags in Enterprise Architect on each of the applications, it is not recommended to capture the data in that way as it will defeat the long-term goal of Application Portfolio Rationalization and Management.
The best way to start small, evolve, grow, and then take the rationalization process to a global level is to build a metamodel.
Here is a sample! You can build a metamodel based on the current clarity.
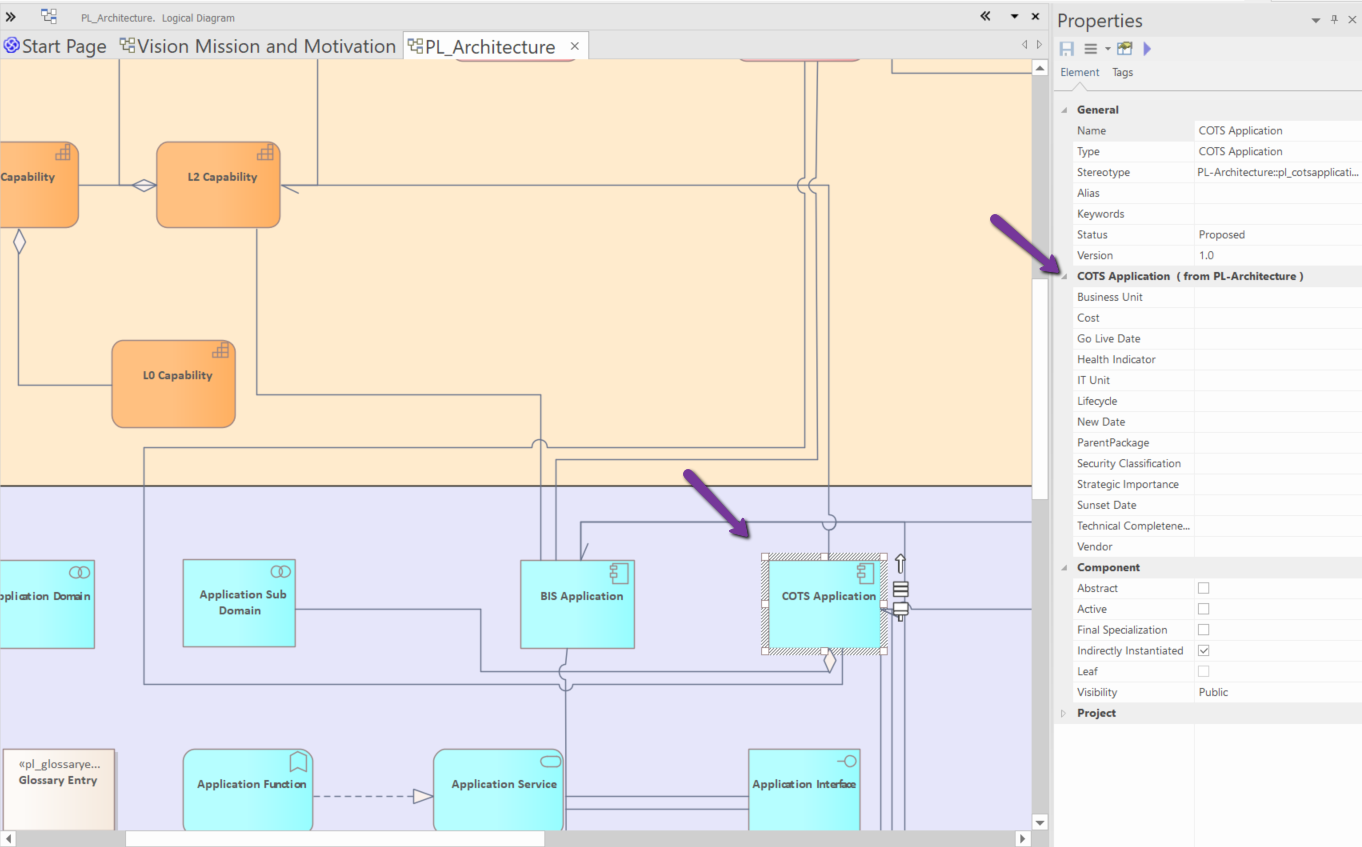
The good news is meta-models can be easily edited and are backward compatible as well.
Reach out to prolaborate[at]sparxsystems[dot]com to get this TOGAF ADM-based meta-model.
Import or Migrate Data
Import from Excel Files
Now, you know what you want to achieve and what data is needed to achieve that objective.
The next step is to build the application inventory by collecting the required data as per the rationalization model from the application owners.
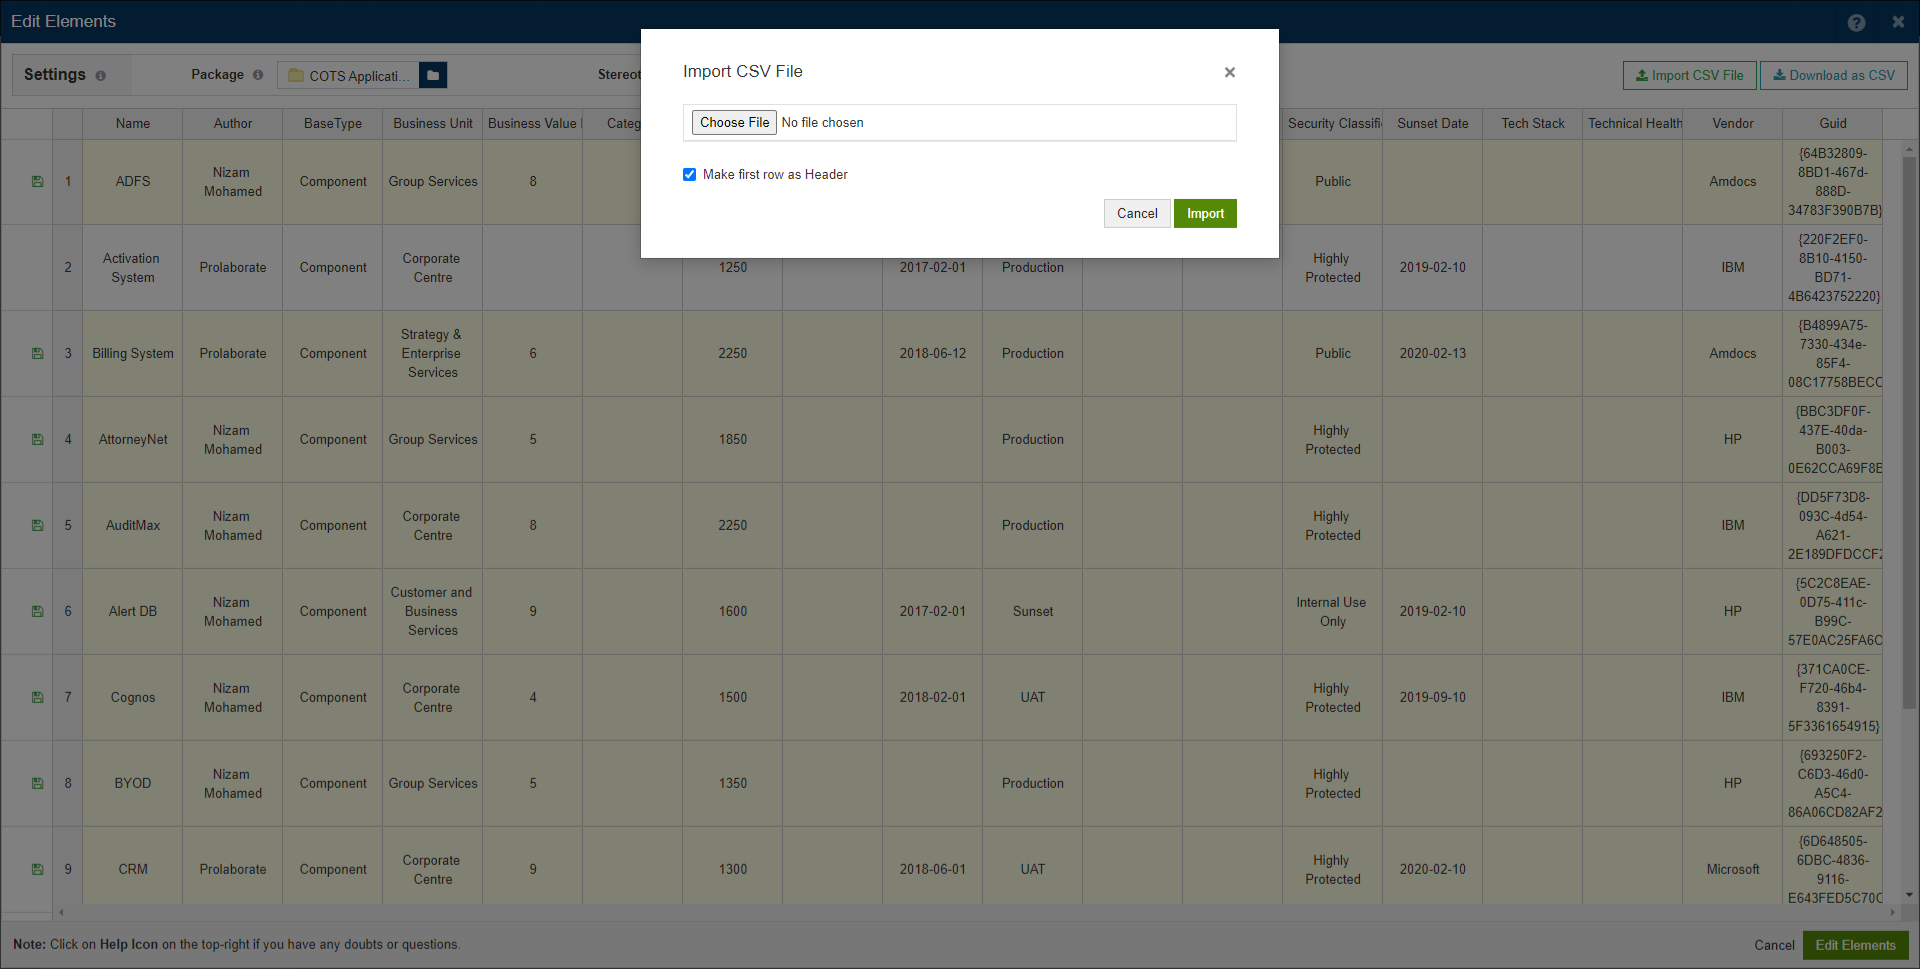
If you have the application data in excel or CSV files or planning to collect the data through files, there are 2 ways how you can import them to the EA models.
MDG Integration for Microsoft Office
Using this popular add-in, you can Import the excel or CSV files. Learn more here.
Prolaborate
You can also import the CSV files using the Excel Editor capability of Prolaborate. Learn more here.
Migrate Data from Other Tools
If the data is regularly maintained in other tools like ServiceNow, you can easily integrate them with the EA models through Pro Cloud Server.
Once integrated, there would be no need to import and export data between these tools.
Learn more here.
Data Collection using Prolaborate
Discussions
All that the architects or modelers have to do is just tag the application owner and initiate a discussion.
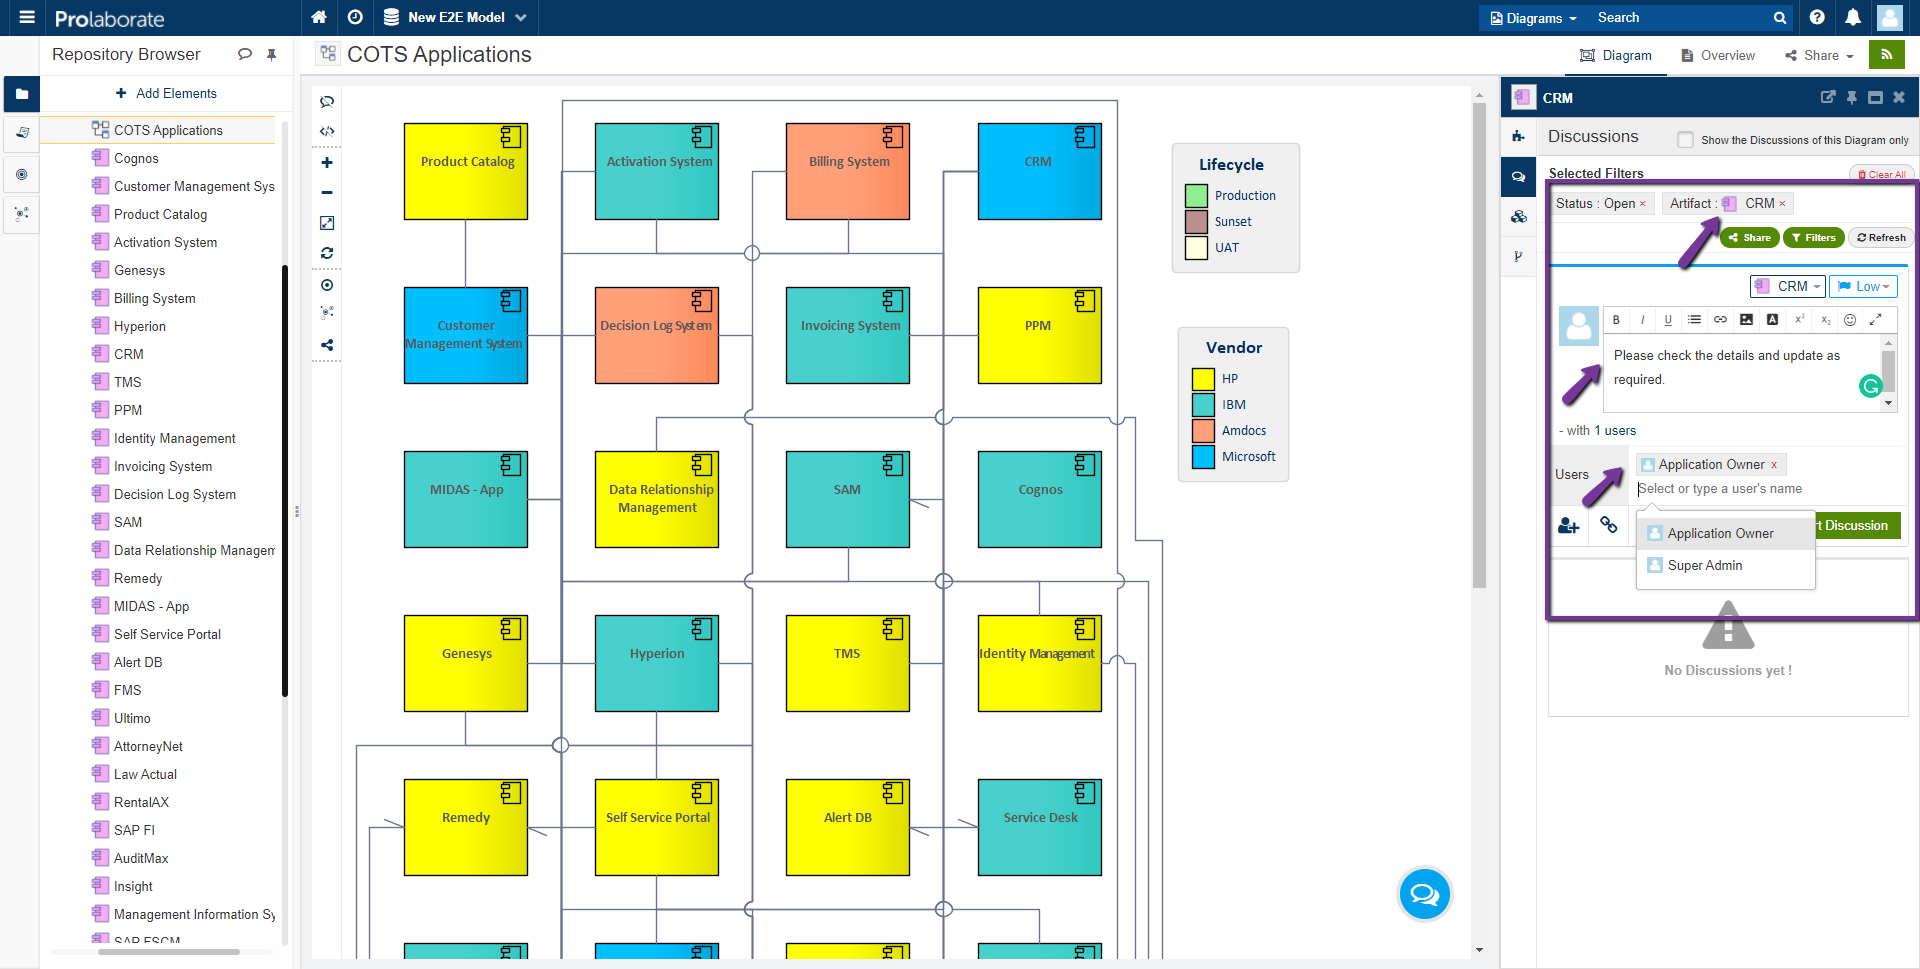
The application owners will get an email notification. They can just click on the link in the email and give their inputs.
While the Rationalization model can have a large list of attributes, you can customize the list and make it relevant based on the audience or current requirements (Learn more about MDG Form Designer of Prolaborate here).
As Prolaborate is directly connected to the EA models, the information is updated immediately.
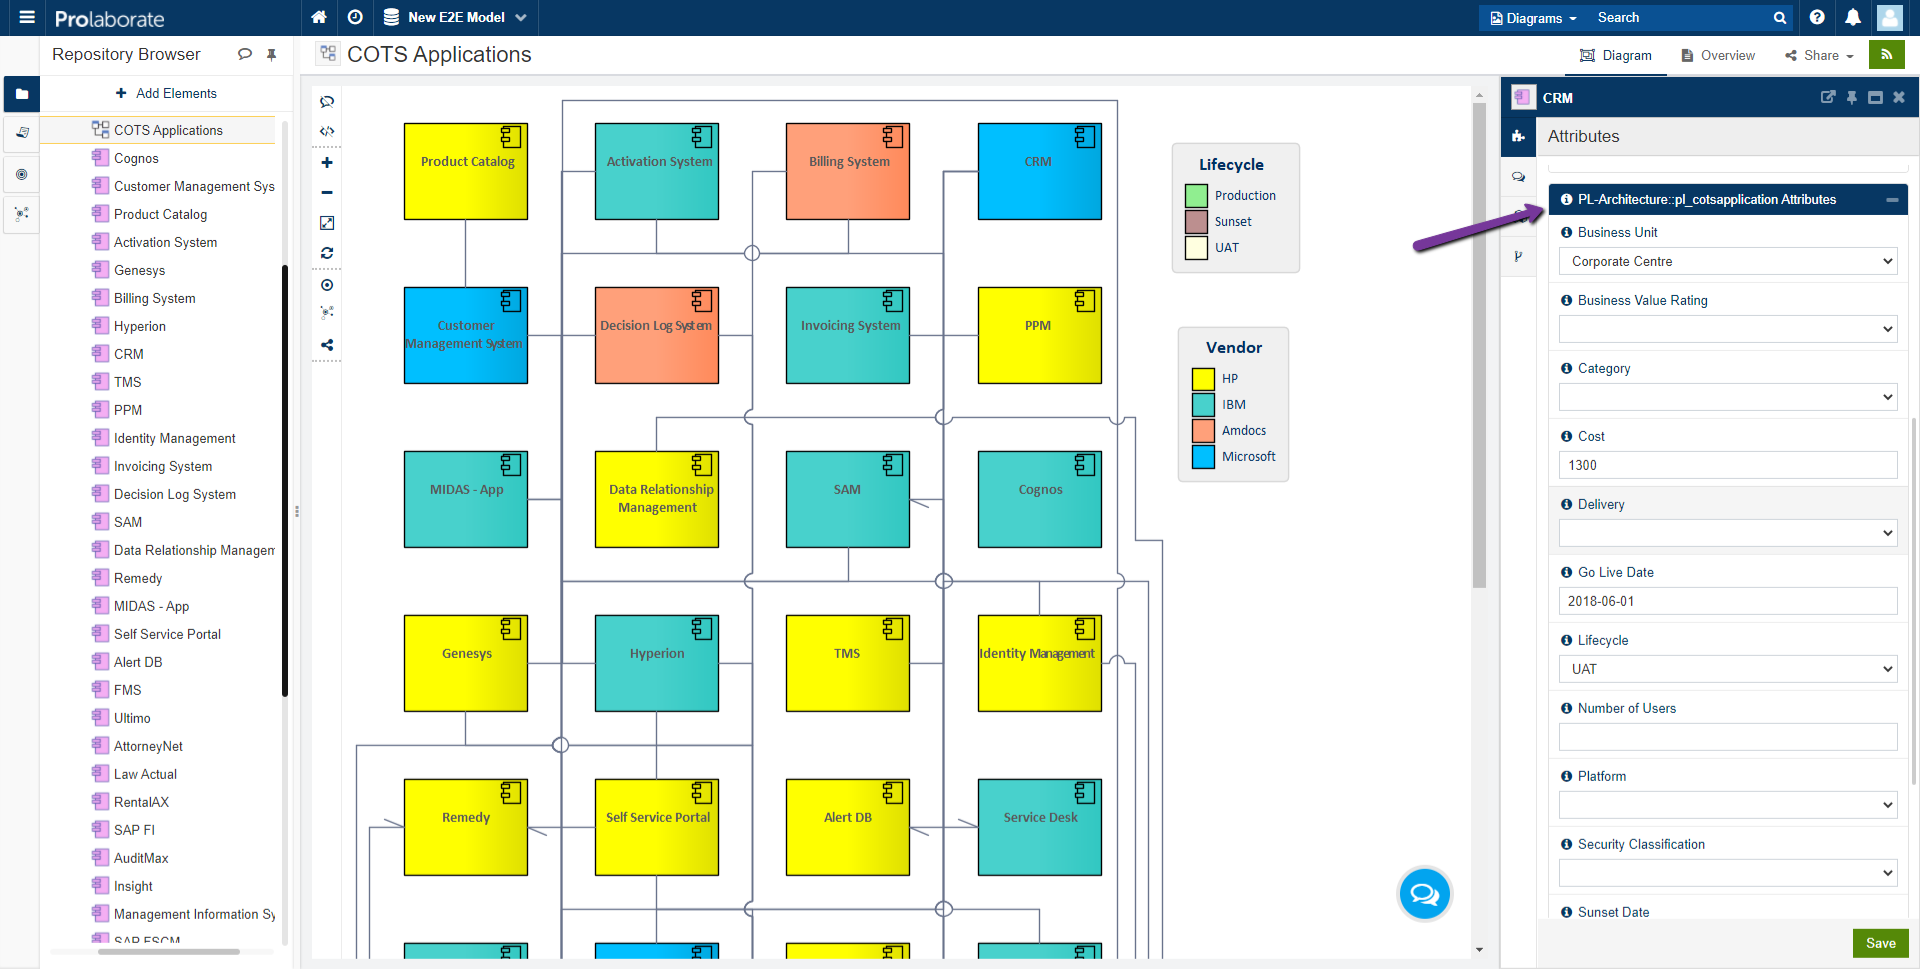
Bulk Edit Data
If you like to edit the data of applications in bulk rather than one by one through the forms above, use the Excel Editor.
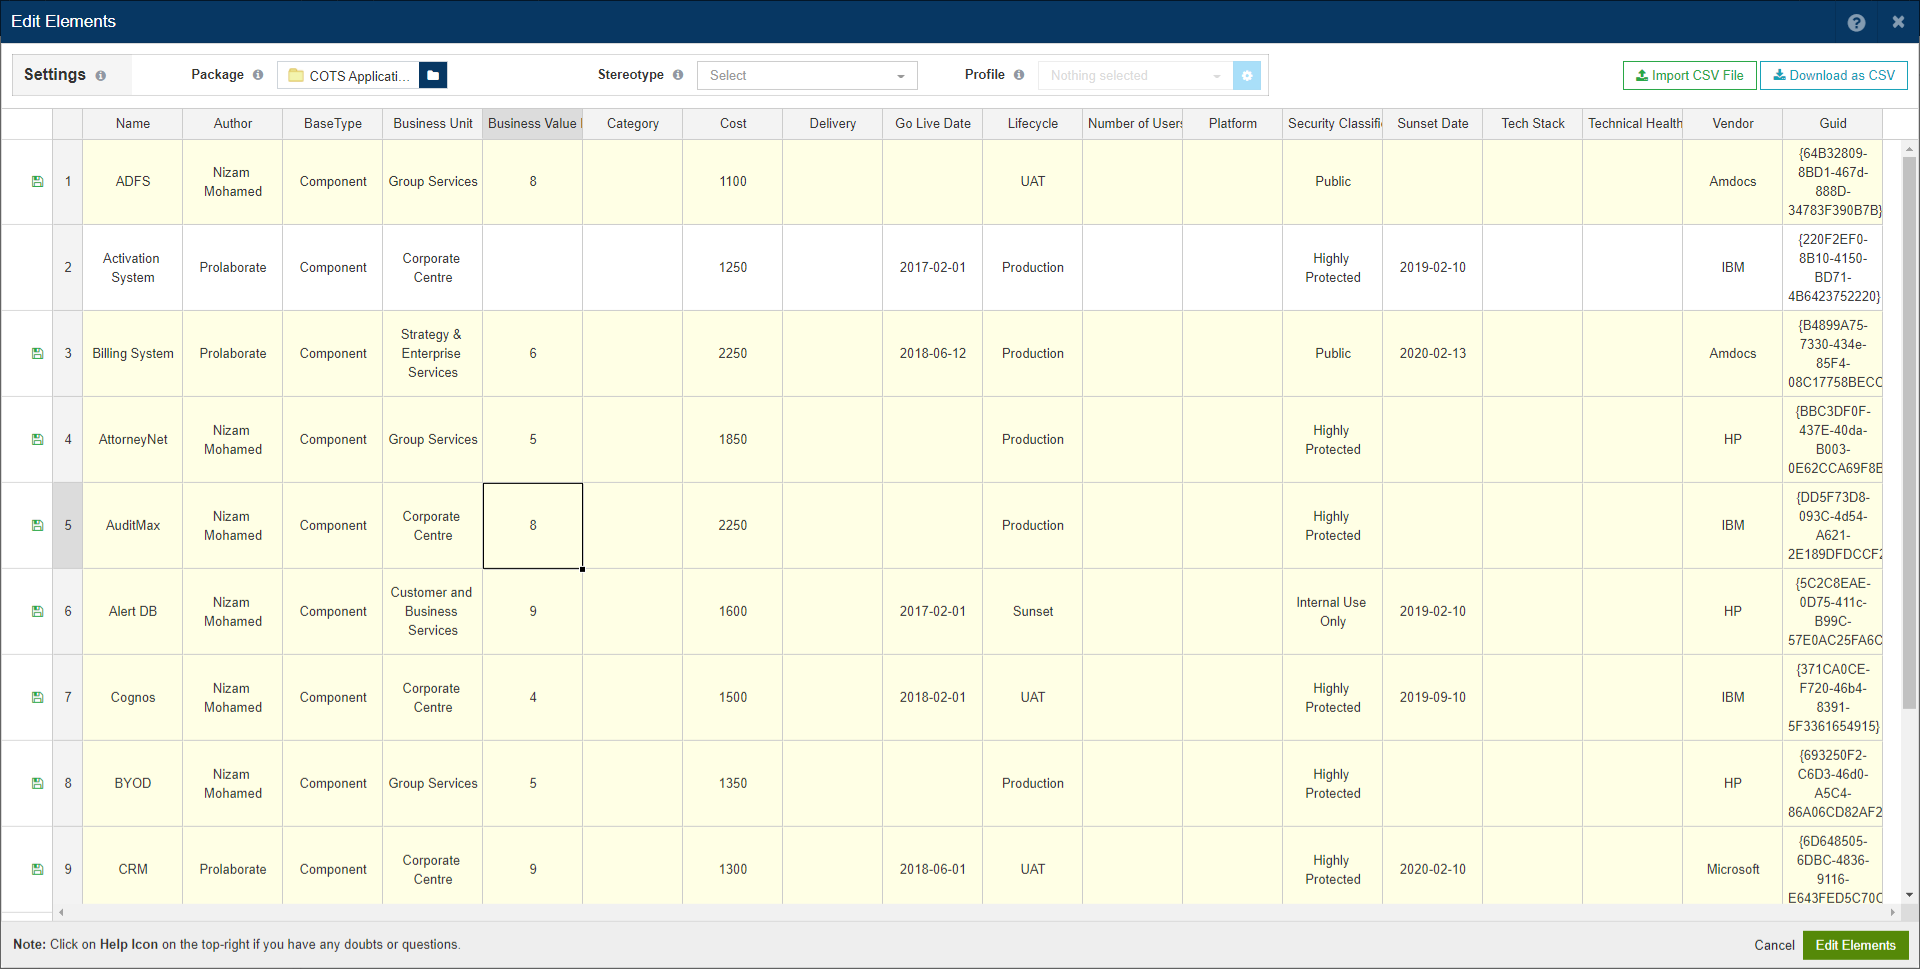
Excel Editor is extremely convenient and user-friendly. Learn more here.
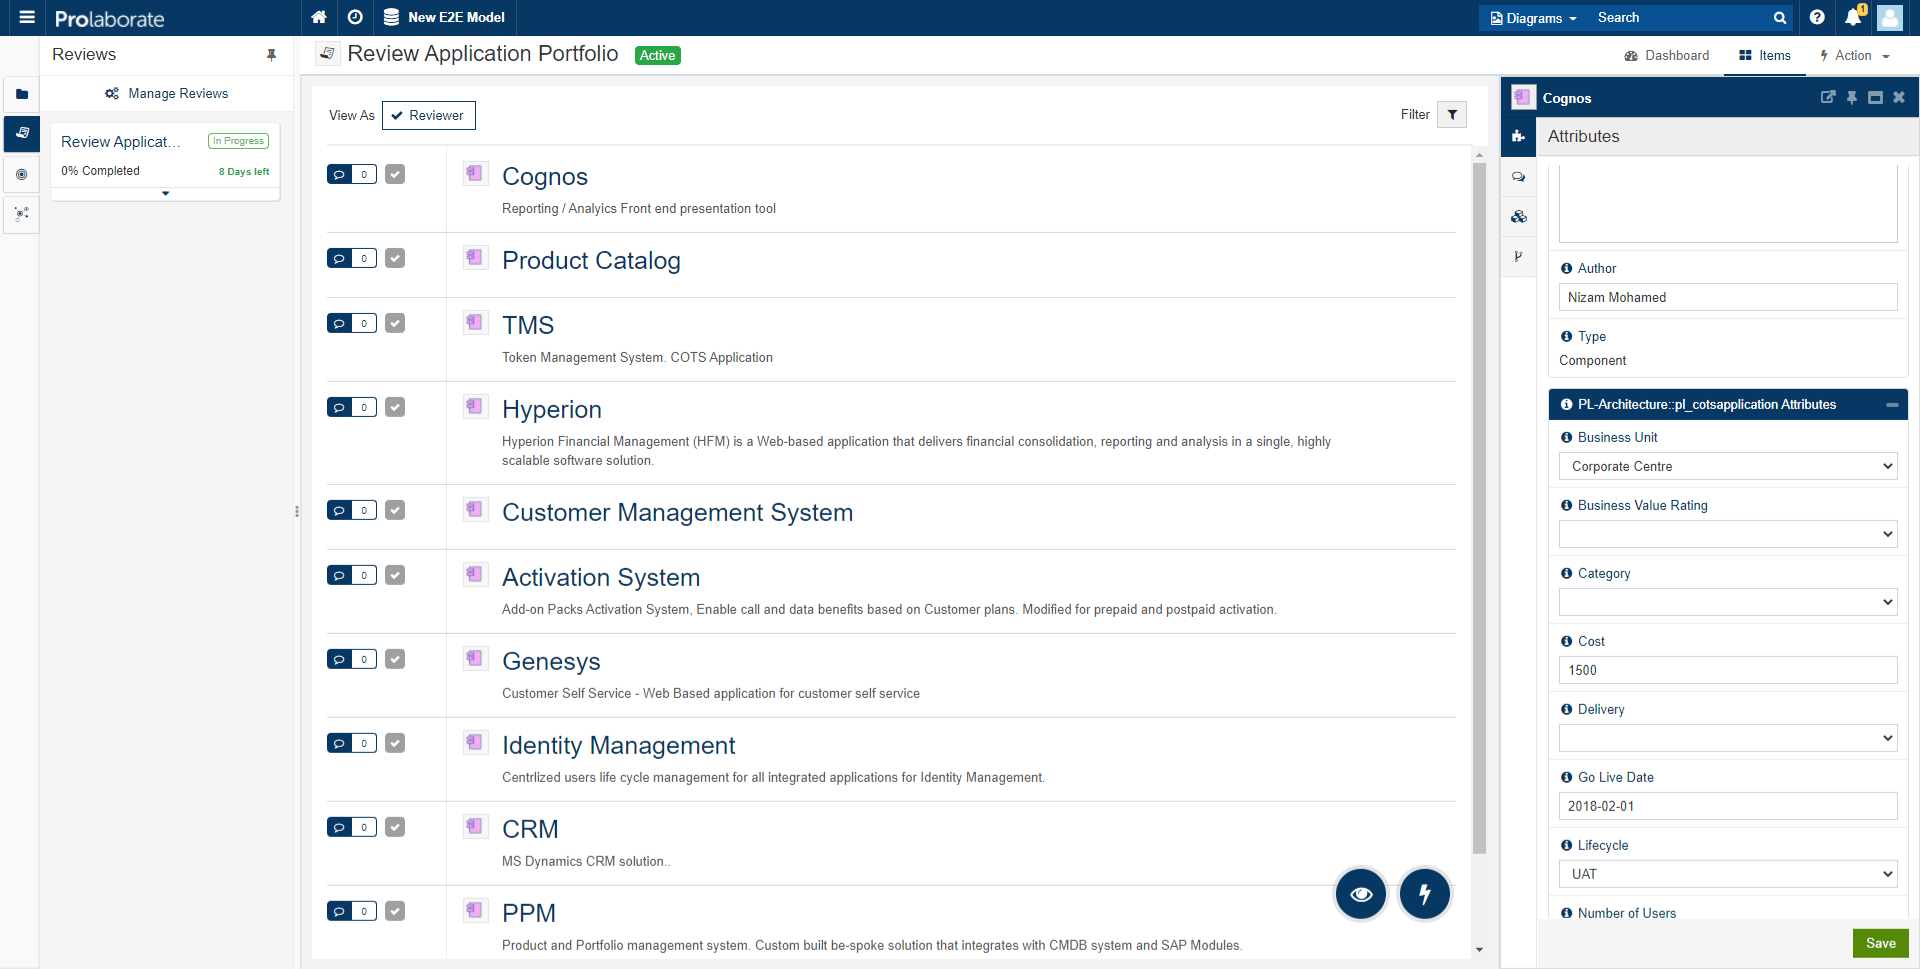
Reviews
If the information is mostly populated already and you require the Application owners to review the information of many applications at once, it would be better to start a Review.
The application owners can just review the information, update if needed, and provide their feedback.
Business Capability Mapping
While just the application data can be used to derive some valuable insights, powerful decision-driving insights can be derived only if the applications are linked to other layers like Business, Information, and Technology. At least, Business capability mapping is mandatory.
If you have the connection details in excel, it can also be imported to the models using the MDG Integration for Microsoft Office.
Learn more about building Business Capability Maps here.
Data Validation
Now, all the application data has been properly loaded and linked to other layers in the EA model.
Or has it not been done? How can you be sure?
While we will be talking about the elaborate use of Prolaborate in visualizing the application data in the next section, you can start using the charting capabilities of Prolaborate in the Data Collection phase itself.
Here are few examples.
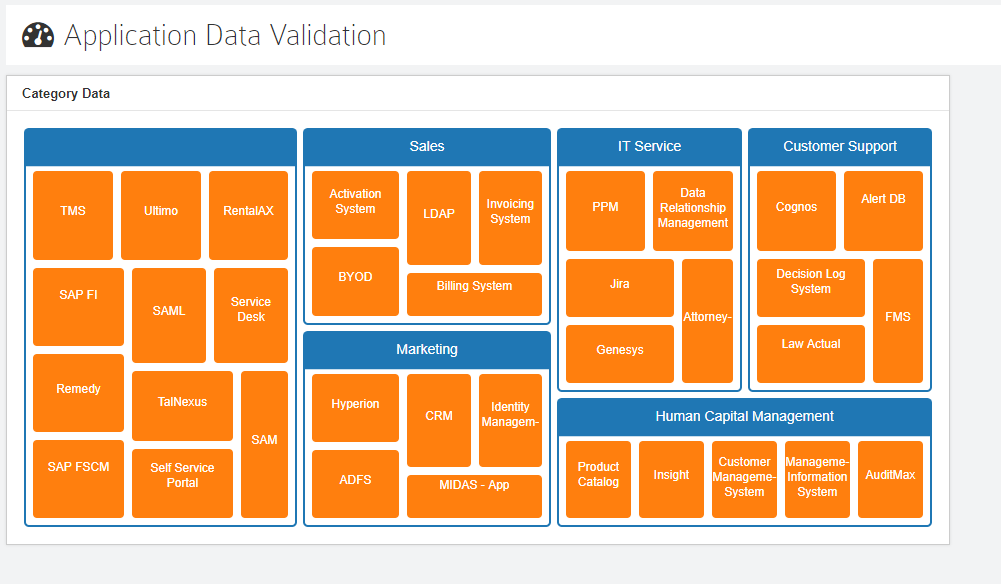
Have the application owners marked the Category for the applications?
From this chart, we can see that it is not filled. You can just click on the application for which the Category is not marked, tag the owner, and start a discussion.
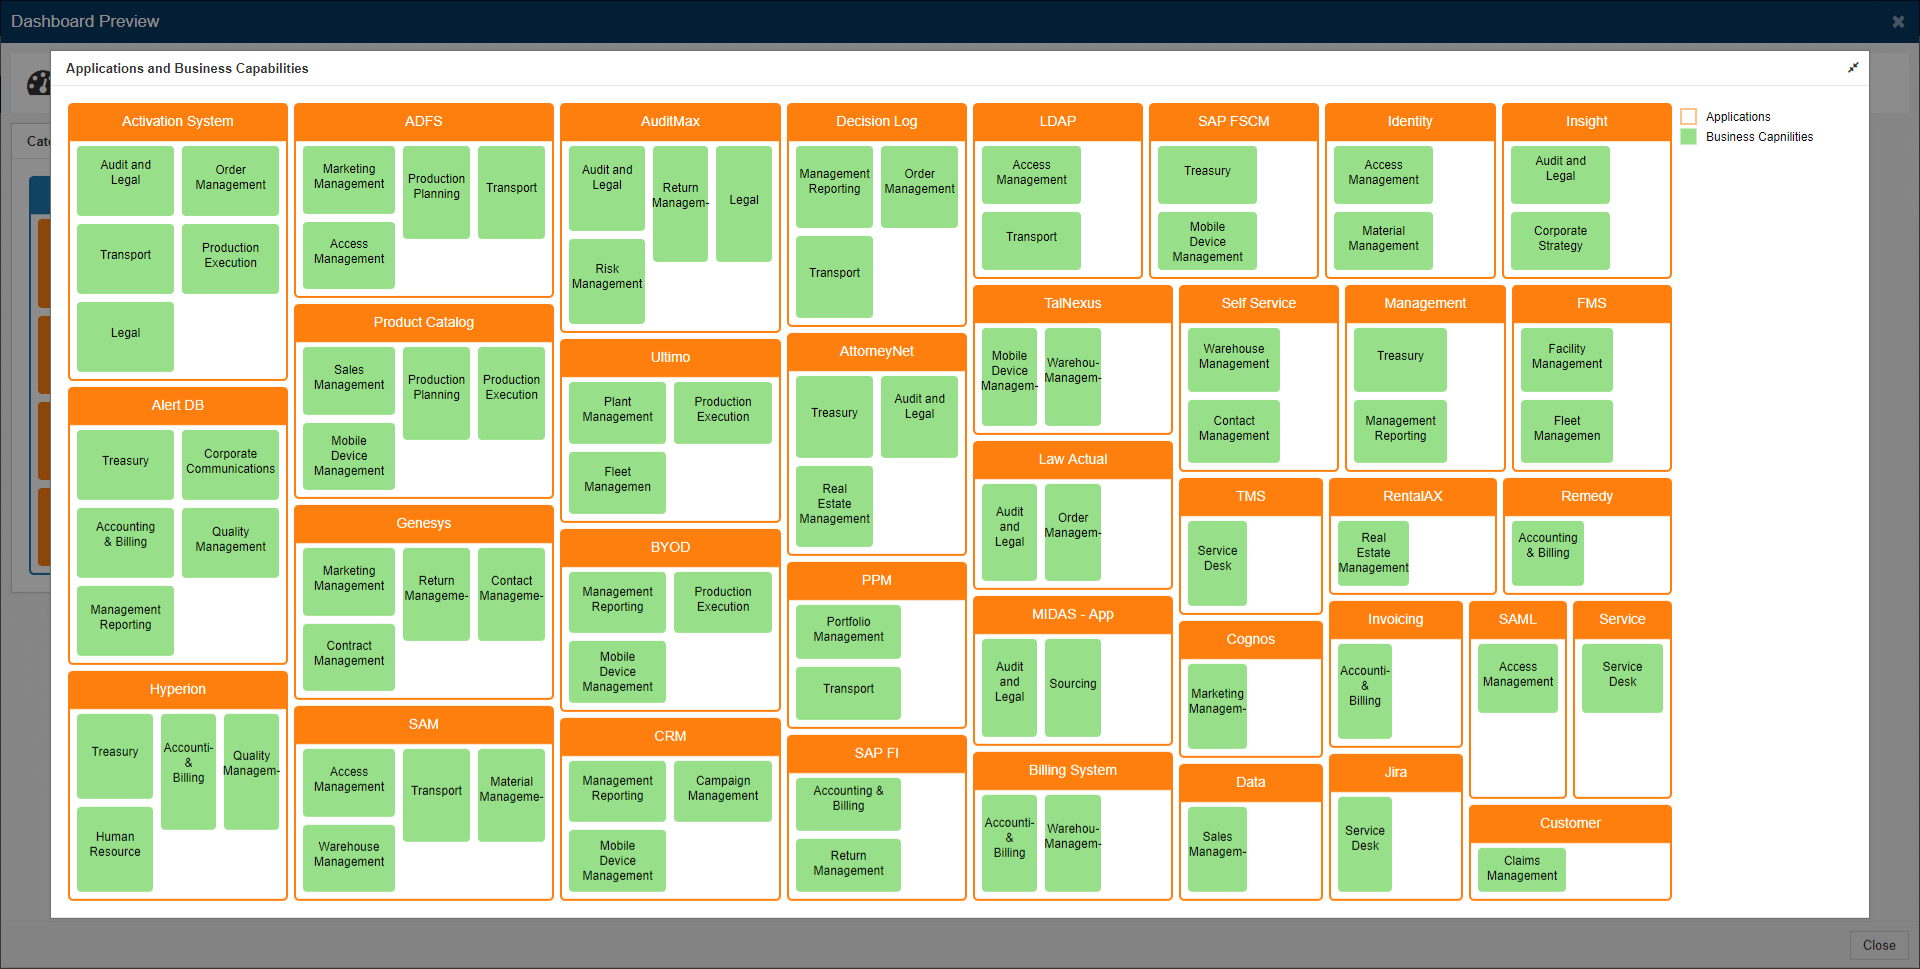
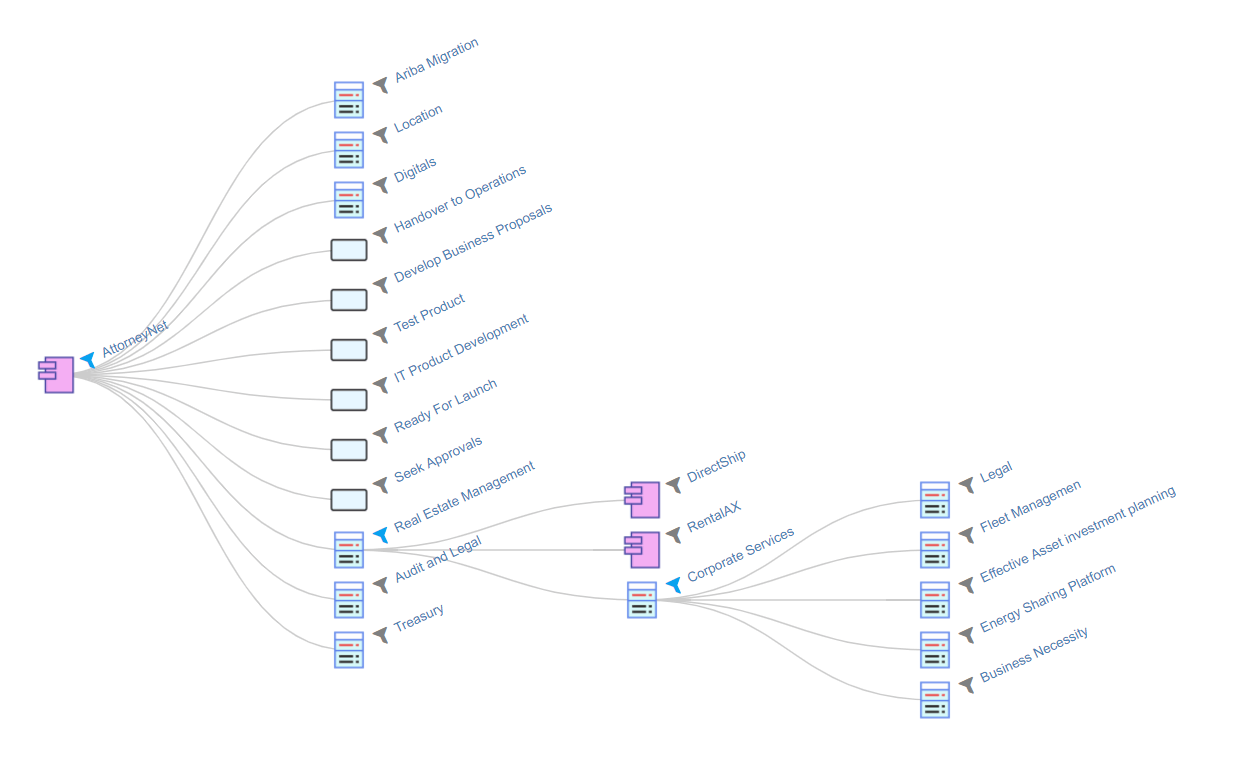
Are all Applications linked to respective Business Capabilities?
We could see all the applications (White boxes with orange header) are indeed connected to the capabilities (Green boxes).
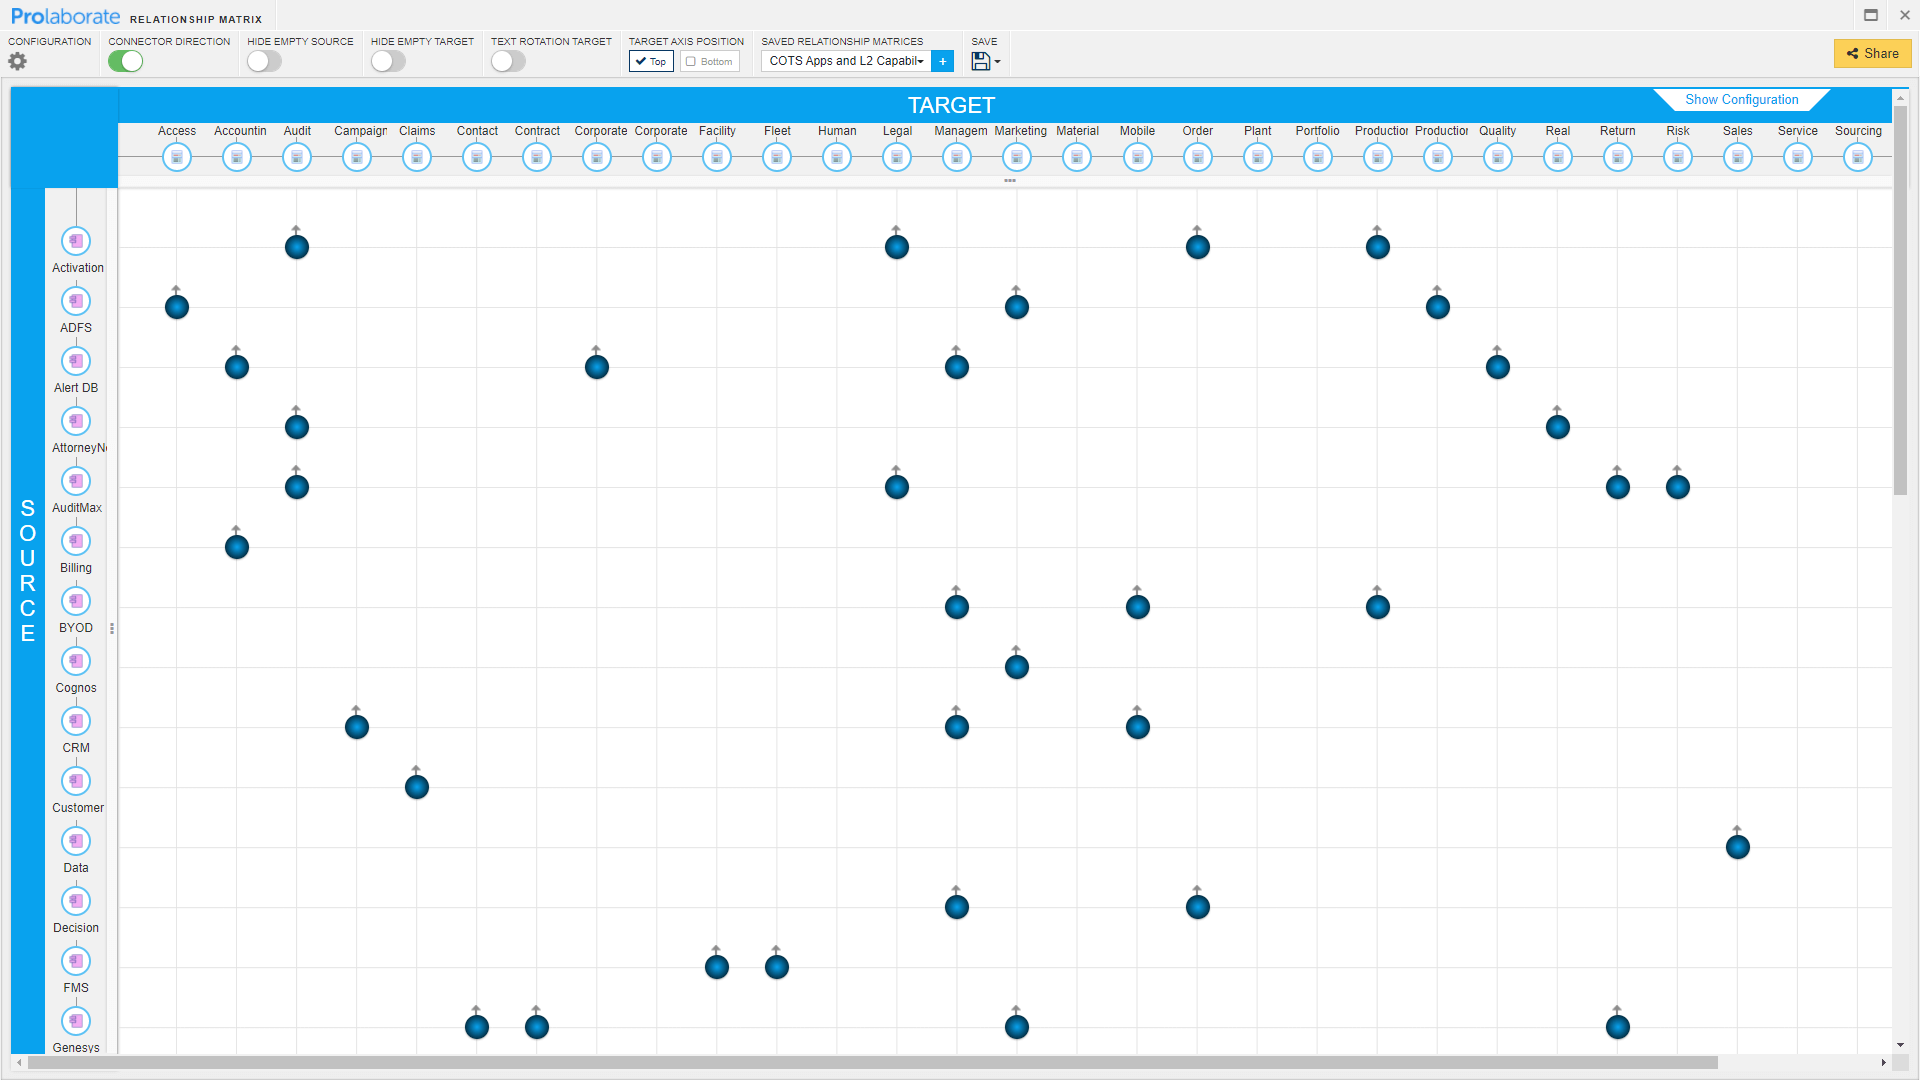
Alternatively, you can use the Relationship Matrix capability to ensure the required information is properly mapped.
Create Rationalization Map
Now, the application data is collected and validated for correctness as well. The next step is to confidently slice and dice the data to understand what’s going on!
Rationalization Map
Application map based on TIME matrix is a powerful and renowned rationalization tool!
Here we have mapped the Business Value and Technical Health ratings of the applications. The size of the bubbles represents the Total Cost of Ownership (TCO).
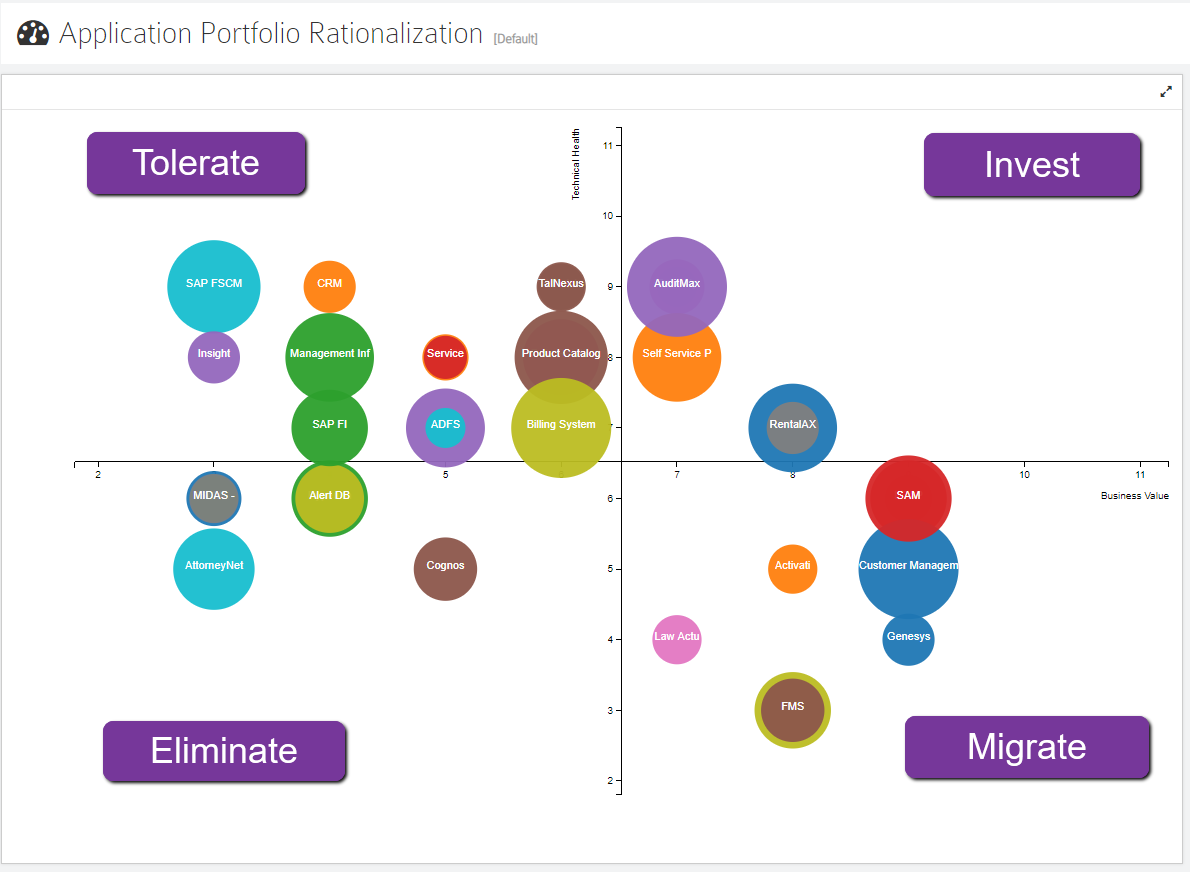
We can now clearly see the position of the applications:
- InvestThe applications in this quadrant are of High business value and in good technical health. You can invest in these applications and enlarge the user base, if possible
- TolerateThe applications here are of Low business value but in good health and so, you can tolerate these applications for now. You can keep an eye on these applications if the health deteriorates.
- EliminateThe applications here are of Low business value and health. There is a high probability that these apps will just be removed from the catalog after a formal analysis. These apps will be our second priority in the rationalization process.
- MigrateWhile apps marked for elimination are easy to target and start with, the apps in this section will be our priority (At least for the analysis!) as these apps have high business value but at risk with a low technical health score.Working on the health of these apps will be much more beneficial and cost-effective than saving some bucks from eliminating apps.
Drive Insights
While you can jump right on to the next step to analyze changes, here are examples of some visualizations that can help you understand the possibilities in Prolaborate.
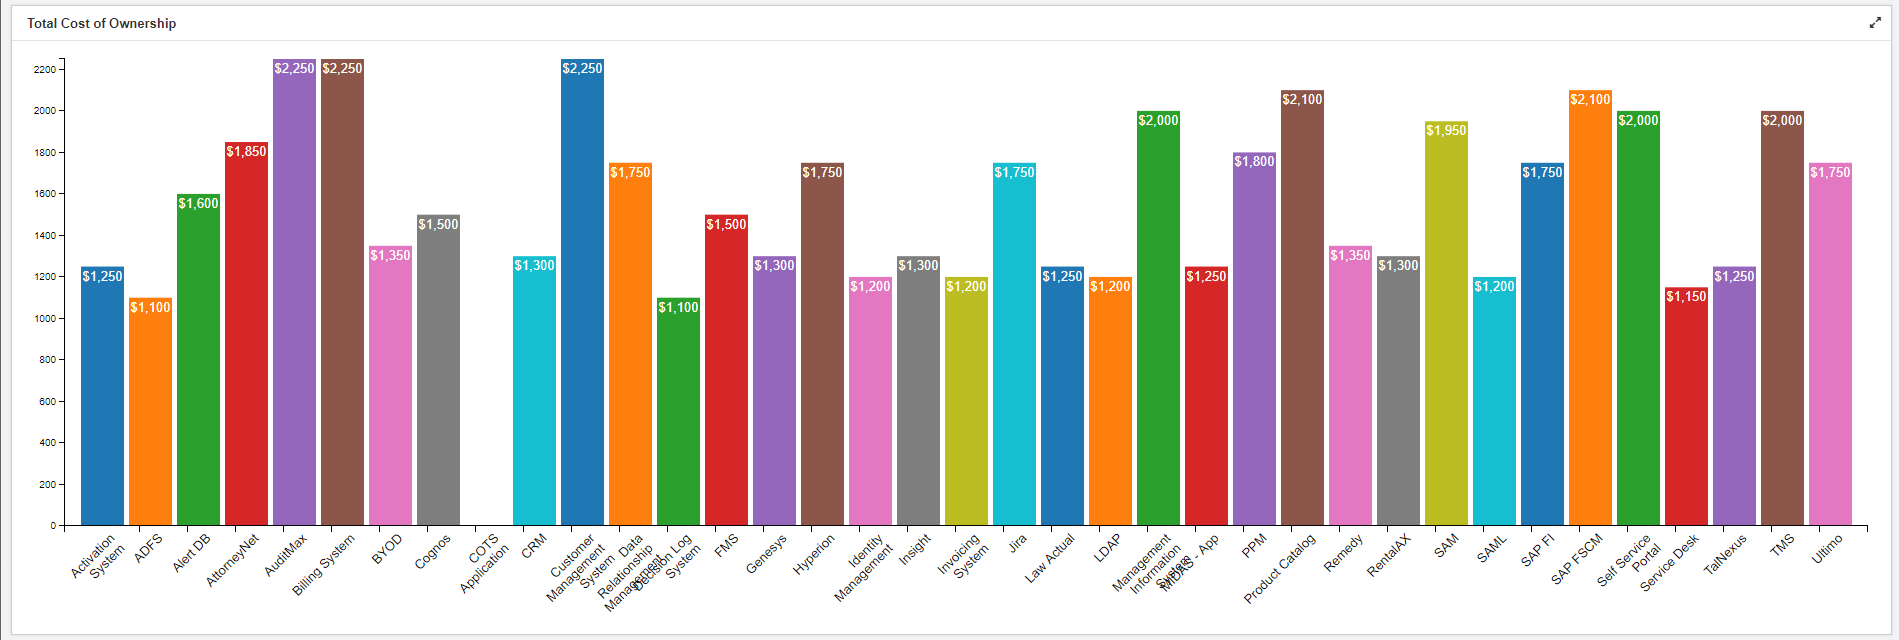
What is the TCO of Applications?
We can understand the Total Cost of Ownership of applications easily through this bar chart.
Which Capabilities rely on retiring applications?
Here we are visualizing the relationship between Capabilities and Applications.
We can easily see which capabilities that are at risk because of relying on applications that are retiring soon as they are color-coded in Red.
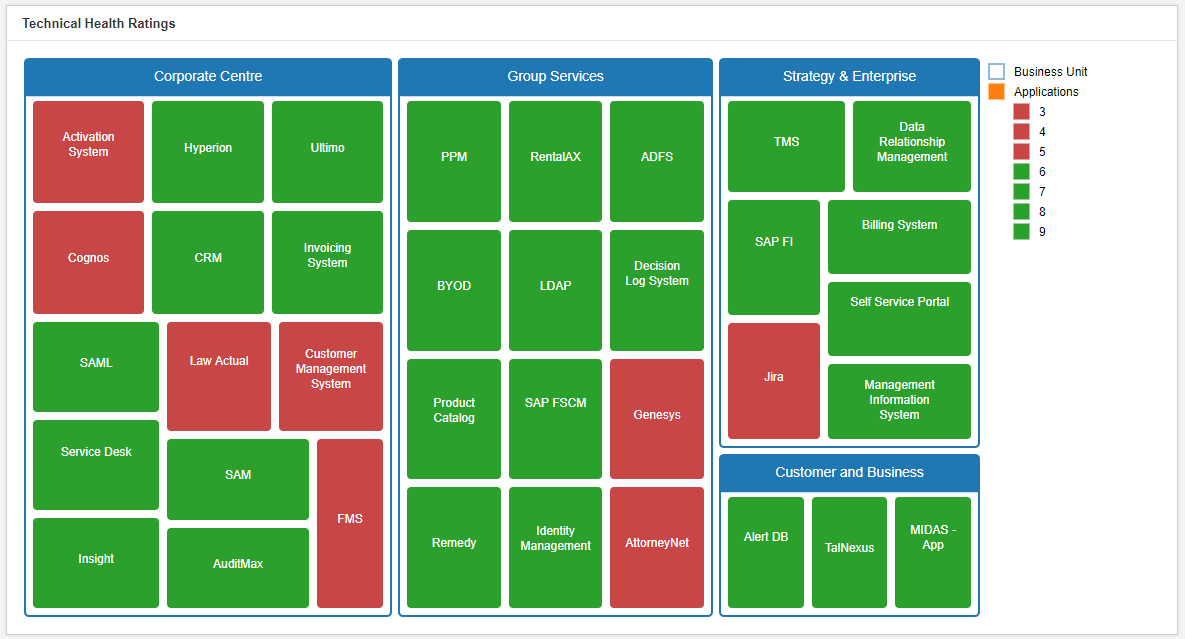
Which Business Units rely on Applications with low Technical Health rating?
Here we try to understand the impact of applications with low Technical Health ratings on the Business Units.
We can see 3 out of 4 business units use applications with low technical health.
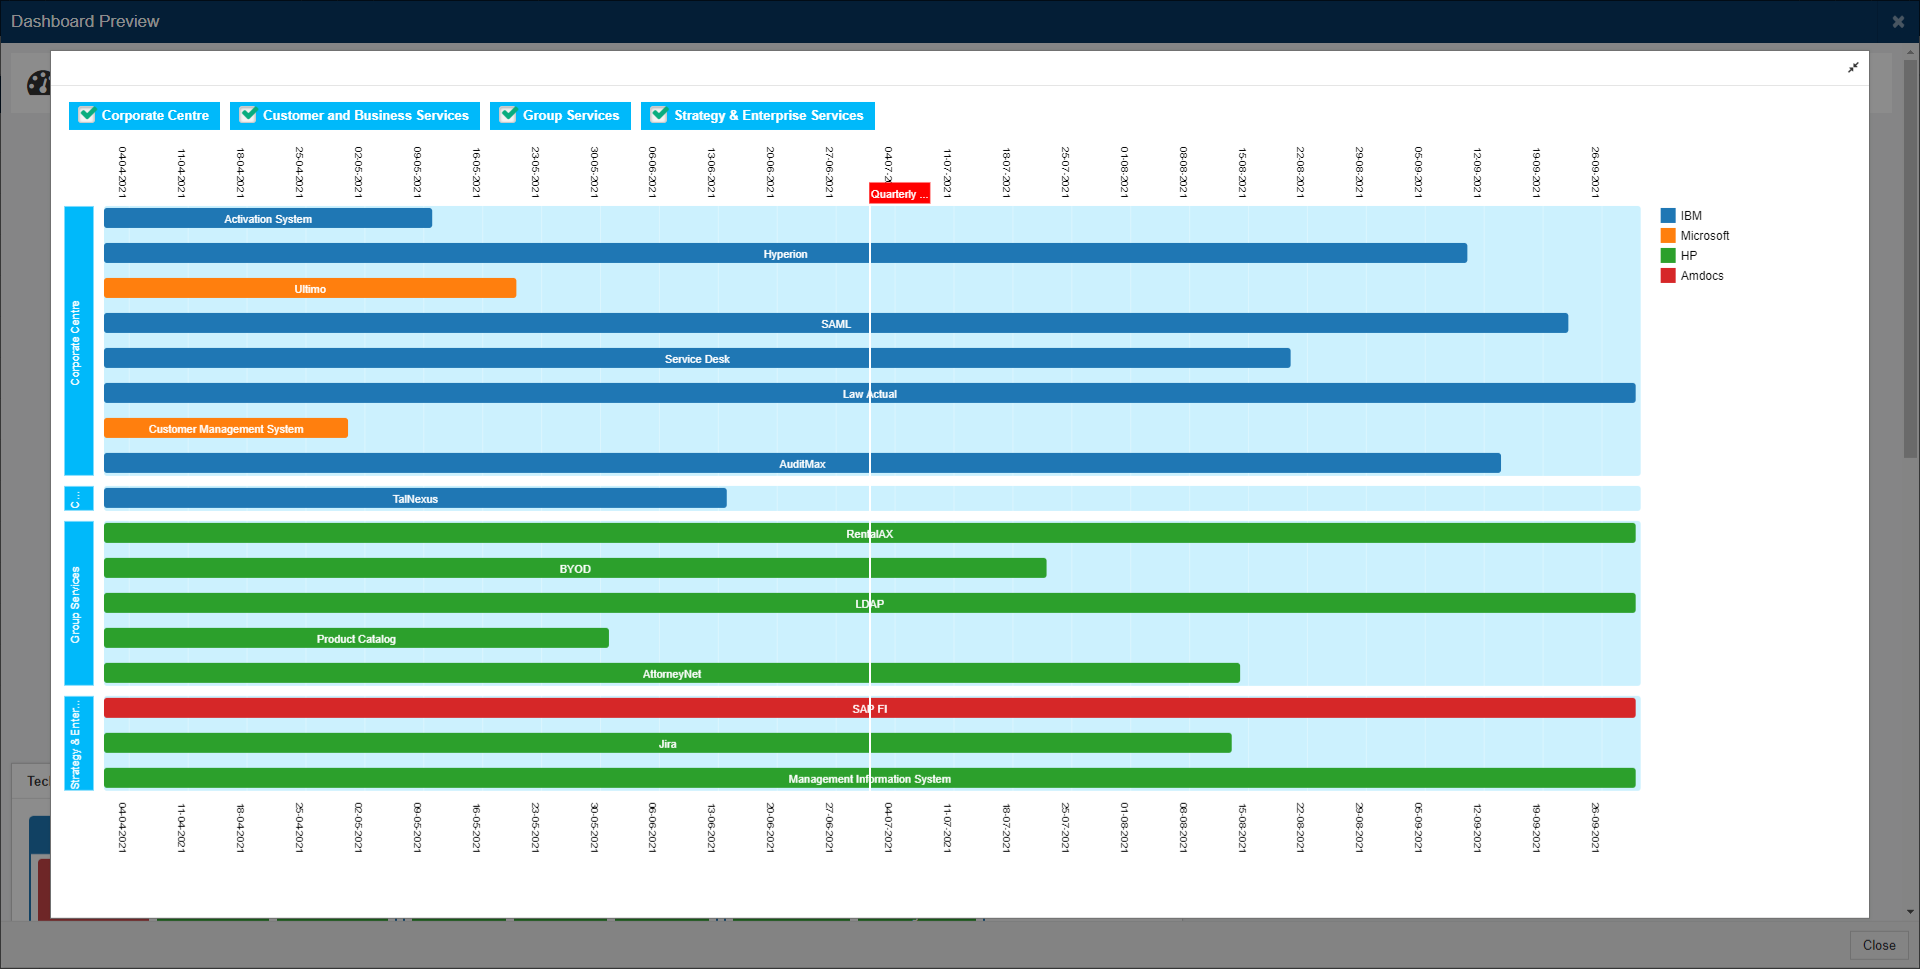
Which Applications are expiring in the next 6 months?
To decide a successor or plan an alternative, we need to understand the EOL or Sunset date or license expiry of applications.
This chart helps us do exactly that. The applications are color-coded based on the Vendor and grouped by Business Unit for better understanding. Milestones are introduced for reviews.
Analyze Changes
Now, you have a clear view of the portfolio and you have identified some applications to migrate or eliminate.
The next step is to analyze the impact of changing or removing these applications.
You can use the Impact Analysis feature of Prolaborate to understand how an application to other layers of the architecture.
Here, we could see an application is connected to other projects, data models, business activities, capabilities at the first level. Further, we are seeing what a specific business capability is connected to.
You can go on and on to explore multiple levels of impacts in a controlled way easily.
Create Target Portfolio and Roadmap
Now, we have a good idea of the portfolio, what changes can be made, and the impact of the changes.
The next step is to present these findings to the decision-makers, plan and kick-start the rationalization process.
Build CxO-level or Role-based dashboards
Different audiences would like to see different aspects of the portfolio and so, you need to build specific dashboards to suit their needs.
Create role-based dashboards in Prolaborate and assign them to the right audience.
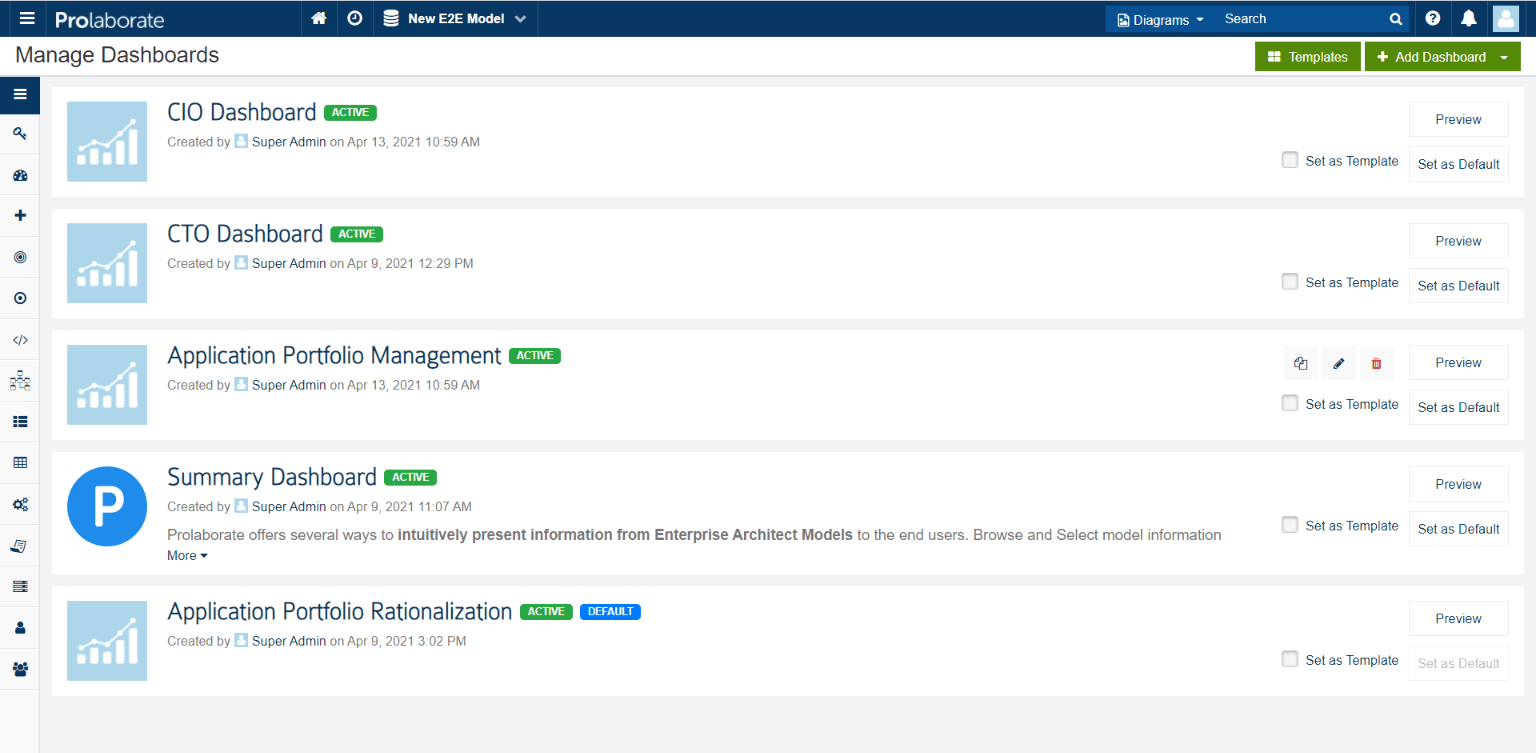
Here, we can see there are different dashboards created based on the audience:
- Application Portfolio Rationalization – Focusses on the ongoing rationalization process
- CIO and CTO dashboards – Dashboards specifically built for CIO and CTO office respectively
- Application Portfolio Management – Provides varied inputs on managing the application portfolio. This serves as a quick reference if you want to get an idea about the portfolio
- Summary Dashboard – This primarily serves as a Navigation dashboard giving an idea of the different kinds of dashboards that are built in Prolaborate
Whenever a user logs in, they will see their default dashboard as the landing page. No clicks or navigation expected!
Collaborate
The users can go through the information presented in the dashboard and give their feedback or suggestions using the Dashboard Collaboration widget.
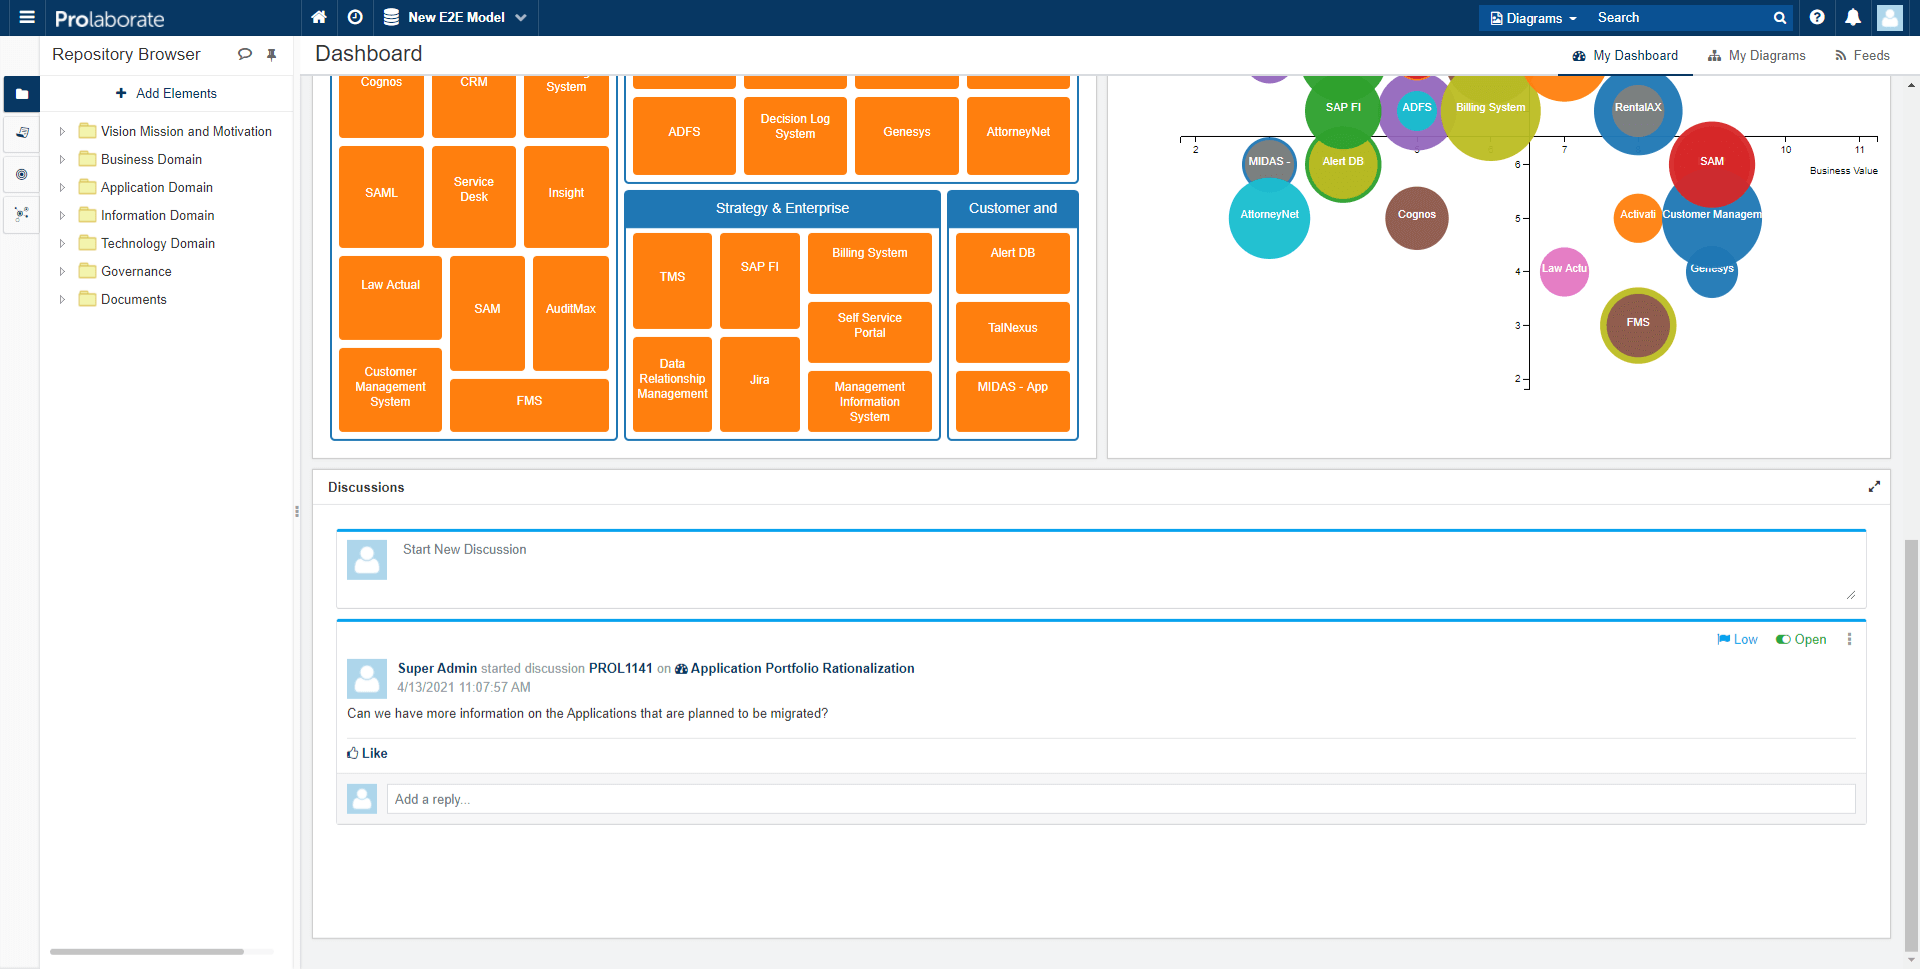
This enables better collaboration between the teams.
Start Reviews
You can also start reviews of the Future state architecture and get approvals from the stakeholders within Prolaborate.
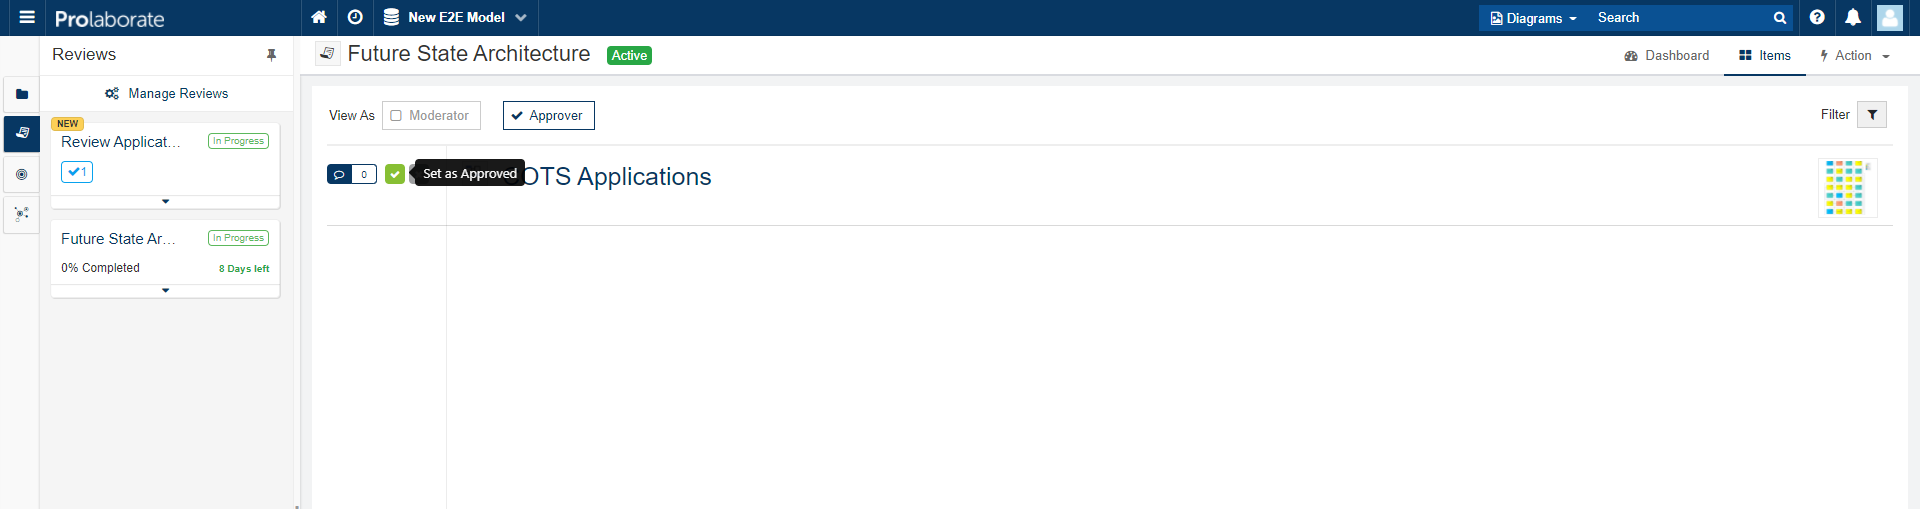
The stakeholders can give their comments easily.
Plan and Execute
Once the changes are discussed and the changes are approved, now is the time for the execution to be kick-started.
You can plan out the activities, build a Roadmap, add to the stakeholder’s dashboards, and complete the project.

The complete project lifecycle can be managed within Prolaborate. You can break down the breakdown into multiple tasks and activities, assign timelines and status to them.
Then you can keep a track of the progress by building a project dashboard and track the project to completion.
Repeat and Manage
Phew! Finally, we have completed a scoped rationalization project!
While you can rest and cheer for a while, you should be mindful that rationalizing the portfolio once is not the goal but just the first step in achieving the larger goal I.e., keeping the application portfolio optimized and rationalized.
Next time, you can choose a different scope or enlarge the scope, have a different set of objectives, tweak the rationalization model to better suit the objectives and goals.
At the end of the day, what you require is an ongoing governance process. It is imperative to establish a formal application portfolio management process wherein the above cycle is repeated based on a schedule and there is always a focus to keep the application portfolio rationalized rather than rationalizing it once in a while.
If you have any questions or need further assistance, feel free to reach out to prolaborate[at]sparxsystems[dot]com